. 2020 Sep 5;10(17):e3744.
doi: 10.21769/BioProtoc.3744.

Identification of Socially-activated Neurons

Affiliations

Identification of Socially-activated Neurons

Mary L Phillips et al. Bio Protoc. .

Abstract

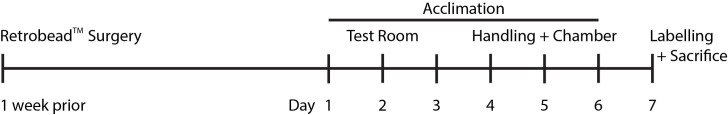
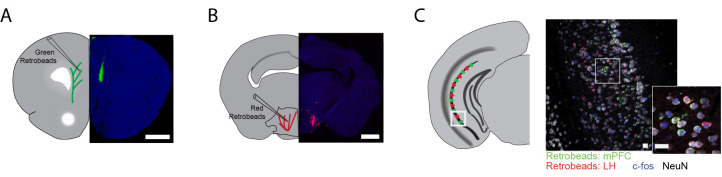
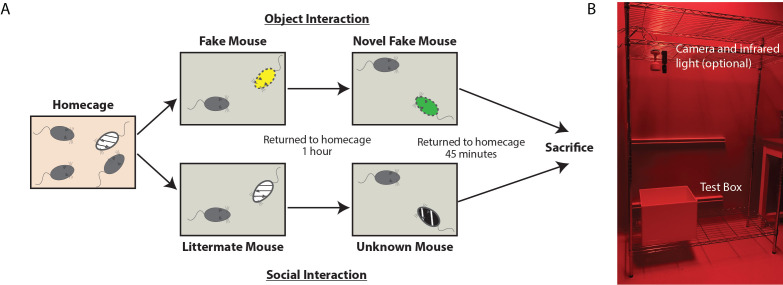
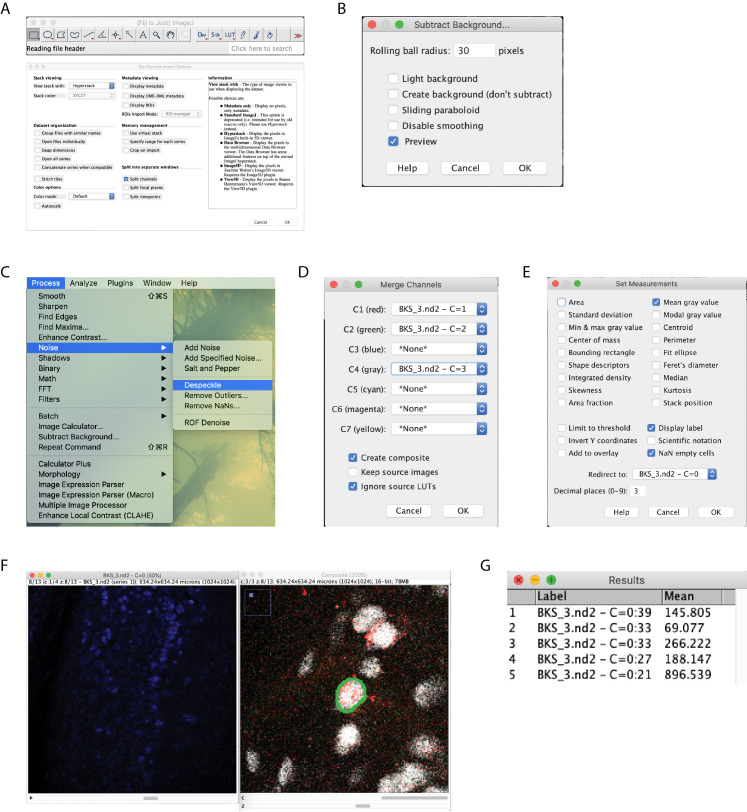
Determining the neuronal circuitry responsible for specific behaviors is a major focus in the field of neurobiology. Activity-dependent immediate early genes (IEGs), transcribed and translated shortly after neurons discharge action potentials, have been used extensively to either identify or gain genetic access to neurons and brain regions involved in such behaviors. By using immunohistochemistry for the protein product of the IEG c-Fos combined with retrograde labeling of specific neuronal populations, precise experimental timing, and identical data acquisition and processing, we present a method to quantitatively identify specific neuronal subpopulations that were active during social encounters. We have previously used this method to show a stronger recruitment of ventral hippocampal neurons that project to the medial prefrontal cortex, compared to those that project to the lateral hypothalamus, following social interactions. After optimization of surgeries for the injection of retrograde tracers, this method will be useful for the identification and mapping of neuronal populations engaged in many different behaviors.

Keywords: Confocal microscopy; Multicolor immunohistochemistry; Neuronal activity; Retrograde tracers; Social behavior; c-Fos.


Conflict of interest statement

Competing interestsThe authors declare no competing financial interests.

Figures

Figure 1.
Figure 1.. Timeline of experimental procedures.
Mice are injected with RetrobeadsTM one week prior to behavioral acclimation. On days 1-3, mice are acclimated to the testing room. On days 4-6, mice are handled (to reduce their anxiety) and the test mice are acclimated to the testing chamber. On day 7, mice are exposed to the behavioral paradigm for labeling and sacrificed.
Figure 2.
Figure 2.. Example of successful retrobead injection.
Green RetrobeadsTM were injected into the mPFC (A) and red RetrobeadsTM were injected into the lHYP (B). Minimal spread of RetrobeadsTM is observed. Two weeks following injection, neuronal cell bodies containing RetrobeadsTM can be observed in the target region, vHIP, determined by their colocalization with NeuN (C).
Figure 3.
Figure 3.. Schematic and Image of Labeling Day.
A. Schematic of behavioral interactions on labeling day. Test mice reside in their homecage until immediately prior to interactions. One group of randomly selected mice will interact with toy mice (Object condition) while the other will interact with live mice (Social condition). Each test mouse is moved to the testing arena, immediately after which either the toy mouse or live littermate mouse is added. After 10 min of unrestricted interaction, the test mouse is returned to the home cage for 1 h. The test mouse is placed in the same, cleaned testing arena immediately joined by either a second toy mouse or live novel mouse. After 10 min of unrestricted interaction, the test mouse is returned to their home cage. The test mouse is anesthetized and perfused 45 min following the cessation of the last interaction. B. Image of behavioral set up, consisting of optional video camera (housing a long-pass filter) with infrared light positioned above the test box. In this set up, the room is equipped with red lights, but a red head lamp is also acceptable.
Figure 4.
Figure 4.. Image analysis workflow.
Begin by opening images, check the split channels box so that options box matches that pictured (A). Subtract background with a 30 pixel rolling ball radius on all channels (B). Despeckle the c-Fos channel (C). Merge the RetrobeadsTM and NeuN channels (D). Set measurement settings to record the mean gray value, redirect to the c-Fos channel (E). Manually circle the NeuN label that contains RetrobeadsTM (F). Being sure to move the c-Fos channel to the same z-plane, measure the intensity (G).

References

    1. Aronov D., Nevers R. and Tank D. W.(2017). Mapping of a non-spatial dimension by the hippocampal-entorhinal circuit. Nature 543(7647): 719-722. - PMC - PubMed
    1. Barros V. N., Mundim M., Galindo L. T., Bittencourt S., Porcionatto M. and Mello L. E.(2015). The pattern of c-Fos expression and its refractory period in the brain of rats and monkeys . Front Cell Neurosci 9: 72. - PMC - PubMed
    1. Bird C. M. and Burgess N.(2008). The hippocampus and memory: insights from spatial processing. Nat Rev Neurosci 9(3): 182-194. - PubMed
    1. DeNardo L. and Luo L.(2017). Genetic strategies to access activated neurons. Curr Opin Neurobiol 45: 121-129. - PMC - PubMed
    1. Eun S. Y., Hong Y. H., Kim E. H., Jeon H., Suh Y. H., Lee J. E., Jo C., Jo S. A. and Kim J.(2004). Glutamate receptor-mediated regulation of c-fos expression in cultured microglia. Biochem Biophys Res Commun 325(1): 320-327. - PubMed

LinkOut - more resources