. 2021 Jan 28;24(2):102110.
doi: 10.1016/j.isci.2021.102110. eCollection 2021 Feb 19.

Systematic errors in orthology inference and their effects on evolutionary analyses

Affiliations

Systematic errors in orthology inference and their effects on evolutionary analyses

Paschalis Natsidis et al. iScience. .

Abstract

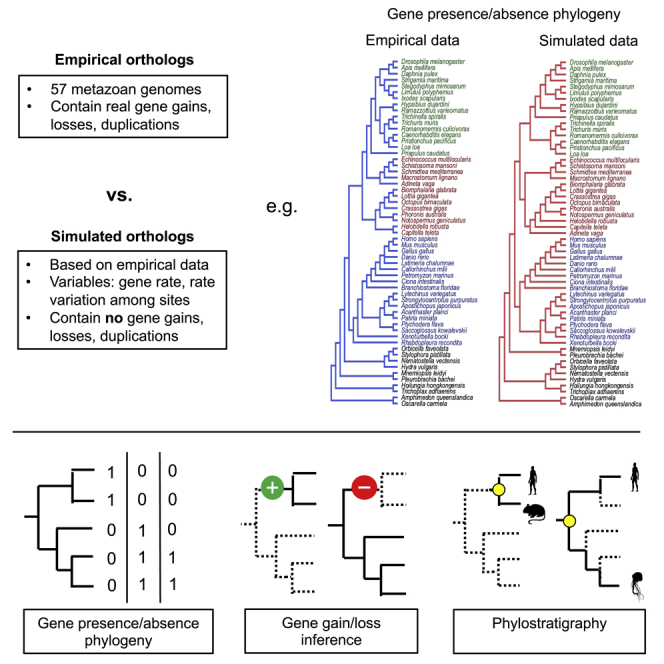
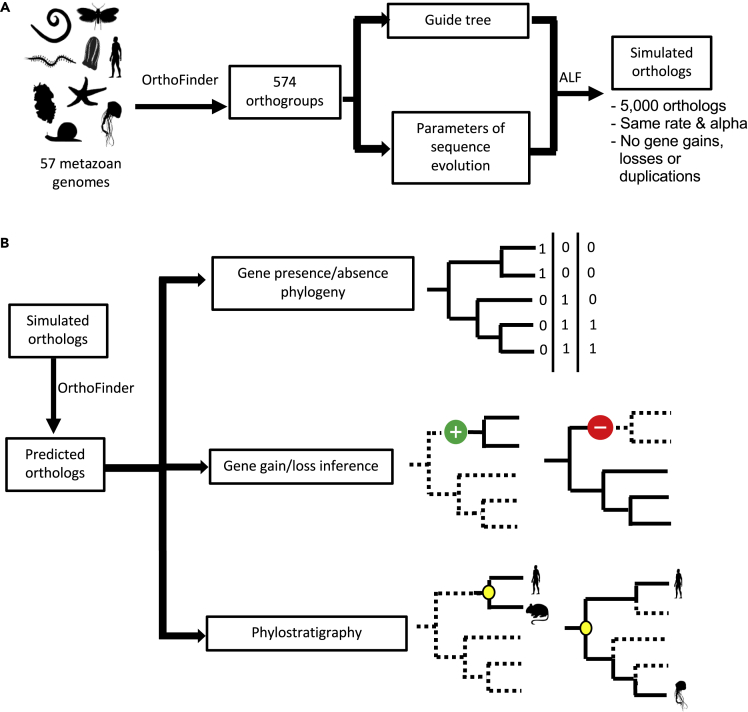
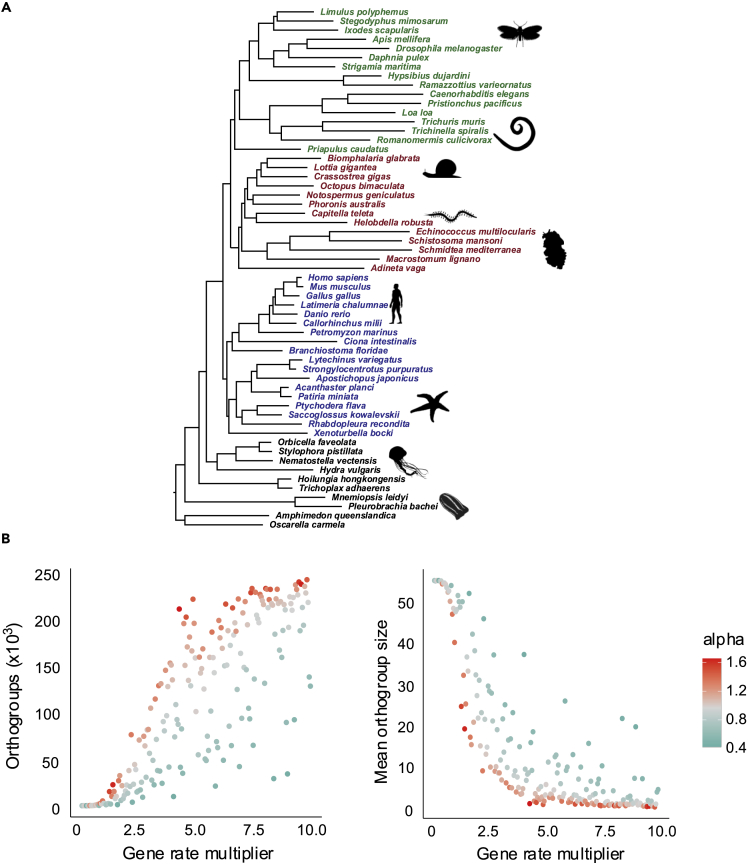
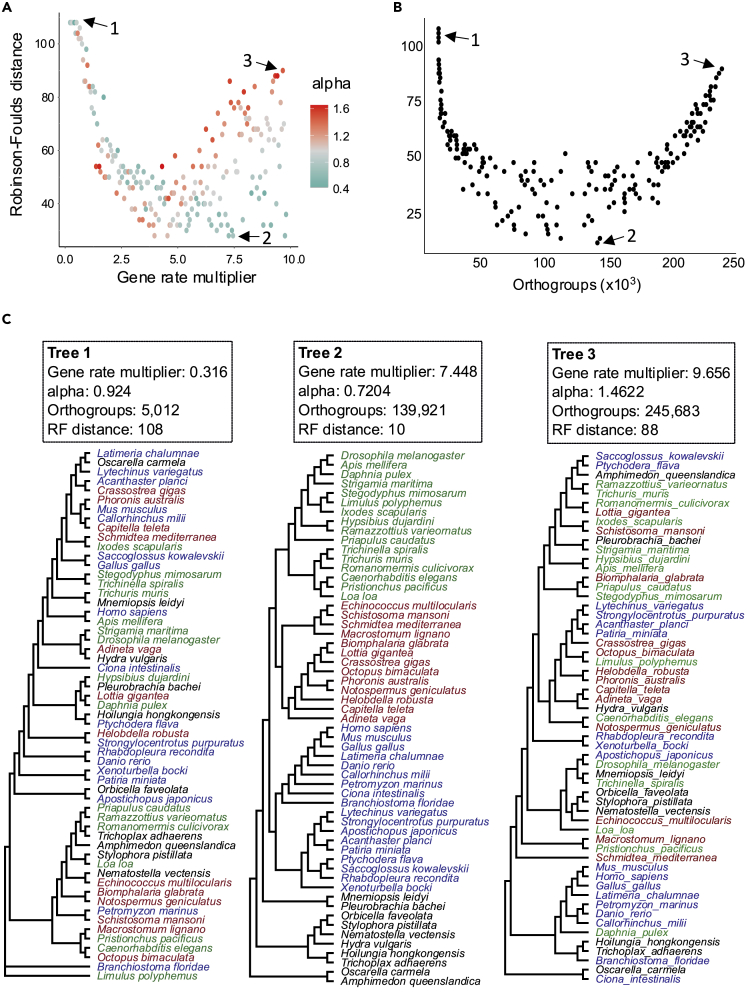
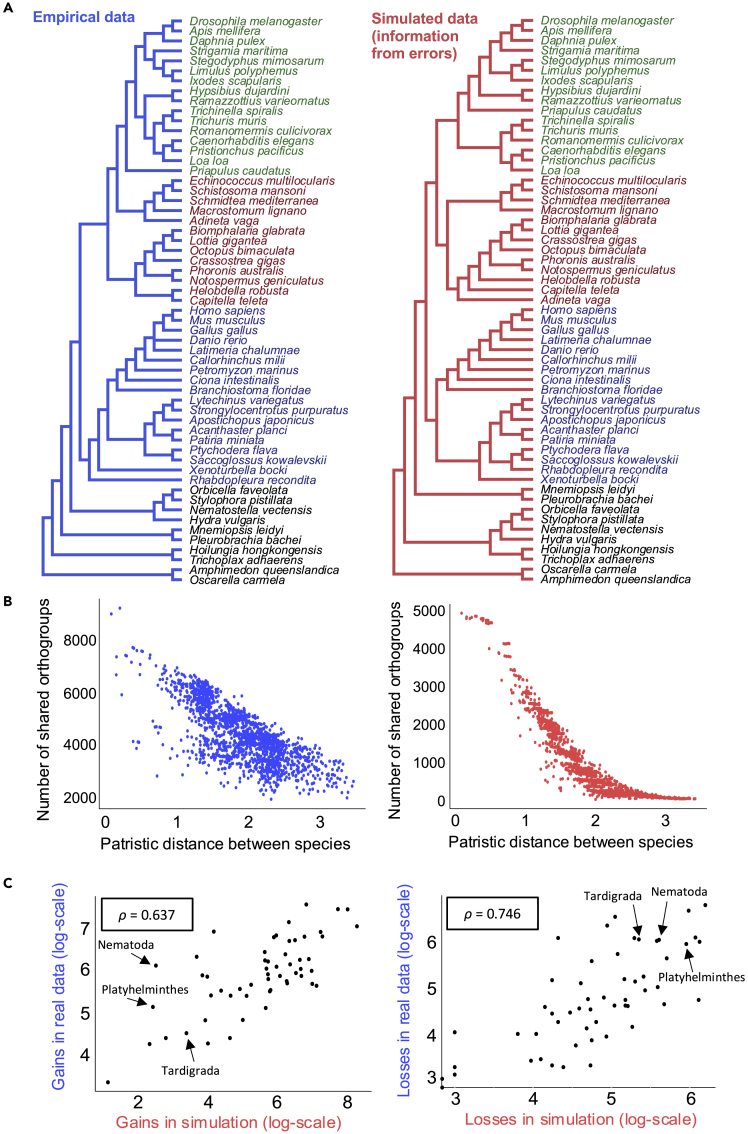
The availability of complete sets of genes from many organisms makes it possible to identify genes unique to (or lost from) certain clades. This information is used to reconstruct phylogenetic trees; identify genes involved in the evolution of clade specific novelties; and for phylostratigraphy-identifying ages of genes in a given species. These investigations rely on accurately predicted orthologs. Here we use simulation to produce sets of orthologs that experience no gains or losses. We show that errors in identifying orthologs increase with higher rates of evolution. We use the predicted sets of orthologs, with errors, to reconstruct phylogenetic trees; to count gains and losses; and for phylostratigraphy. Our simulated data, containing information only from errors in orthology prediction, closely recapitulate findings from empirical data. We suggest published downstream analyses must be informed to a large extent by errors in orthology prediction that mimic expected patterns of gene evolution.

Keywords: Biological Sciences; Evolutionary Biology; Evolutionary Mechanisms; Evolutionary Processes; Phylogenetics; Phylogeny.


Conflict of interest statement

The authors declare no competing interests.

Figures

None
Graphical abstract
Figure 1
Figure 1
Workflow diagram (A) We used information from 574 metazoan orthologs from 57 genomes to infer realistic parameters of sequence evolution to inform our simulations. Two hundred sets of 5,000 orthologs were simulated according to the empirically derived parameters and a fixed tree topology without any gene gains, losses, or duplications. (B) Orthology relationships among each of the simulated orthologs were inferred using OrthoFinder. These results were used in three different downstream analyses to understand the impact of orthology prediction error: gene presence/absence phylogeny; gene gain/loss inference; and phylostratigraphy.
Figure 2
Figure 2
Errors in orthology prediction among simulated orthologs are more frequent with faster genes and with higher alphas (A) The guide tree under which the orthologs evolved in our simulations. Branch lengths were estimated based on the concatenated set of 574 orthogroups using the LG + F + G + C60 model. Each simulation involved the evolution of 5,000 orthologs along a scaled version of this guide tree, where all branch lengths were multiplied by a scalar ranging from 0.2x to 10x. Green: Ecdysozoa, Red: Lophotrochozoa, Blue: Deuterostomia, Black: Non-Bilateria. (B) Number of orthogroups inferred from each of the 200 simulation replicates plotted according to rate of evolution and alpha. An accurate inference would contain 5,000 orthogroups (left). Mean orthogroup size inferred from each of the 200 simulation replicates plotted according to rate of evolution and with different alphas (right). An accurate inference would show orthogroups containing 57 species. Higher orthogroup sizes indicate more errors. In simulations with small gene rate multipliers (corresponding to slow-evolving genes) orthology inference was successful in recovering 5,000 orthologs with the correct mean size of 57 genes. With larger gene-rate multipliers, orthology inference erroneously inferred more and smaller orthogroups. Higher alphas (less between-site rate heterogeneity) resulted in more errors in orthology inference.
Figure 3
Figure 3
Gene presence/absence phylogenies benefit from errors in orthology inference (A) Relationship between gene evolution rate on the accuracy of trees reconstructed from the per-species presence//absence matrix for each simulation. Accuracy is calculated using the Robinson-Foulds distance (RF) between the true tree and the reconstructed tree. In simulations of slow-evolving genes (few orthology inference errors) the corresponding presence/absence trees are very poor (High RF). For faster-evolving simulations (more orthology inference errors) the trees become much more accurate. For slower genes a higher alpha gives better trees. As the rate increases, a lower alpha results in superior trees. The values corresponding to the trees (1,2,3) shown in part C are indicated by arrows. (B) The most accurate trees correspond to an intermediate level of error as measured by the number of inferred orthogroups. With very low and very high error rates the trees are very poor. The values corresponding to the trees (1,2,3) shown in part C are indicated by arrows. (C) Examples of trees reconstructed using matrices of gene presence/absence based on slow-, intermediate-, and fast-evolving simulations. The trees correspond to the points indicated by arrows in Figure parts A and B. The parameters used in the three simulations are indicated in the boxes. Green species are ecdysozoans, brown species are lophotrochozoans, and blue species are deuterostomes.
Figure 4
Figure 4
Downstream analyses based on orthology prediction errors in simulated data closely resemble the results from real data (A) A phylogenetic tree reconstructed using the gene presence/absence matrix from real data (left/blue) closely resembles the tree based on orthology prediction errors from simulated data (right/red). Green species are ecdysozoans, brown species are lophotrochozoans, and blue species are deuterostomes. (B) The number of orthogroups shared between pairs of species correlates with the patristic distance between them for orthology predictions based on both real data (left/blue) and for simulated data for which all information results from errors (right/red). (C) Comparison of numbers of gene gains and losses in each node of the guide tree estimated from real (y axis/blue) and simulated (x axis/red) data. Numbers of gene gains in each node (left) and gene losses (right) are strongly correlated between simulated and real data. Each dot represents an internal node of the guide tree. The values for the nodes leading to the fast-evolving tardigrades, platyhelminths, and nematodes are indicated. The correlation coefficient ρ was calculated using Spearman's rank test.

Similar articles

Cited by

References

    1. Altenhoff A.M., Glover N.M., Dessimoz C. Inferring orthology and paralogy. In: Anisimova M., editor. Evolutionary Genomics. Springer; 2019.
    1. Buchfink B., Xie C., Huson D.H. Fast and sensitive protein alignment using DIAMOND. Nat. Methods. 2015;12:59–60. - PubMed
    1. Cannon J.T., Vellutini B.C., Smith J., Ronquist F., Jondelius U., Hejnol A. Xenacoelomorpha is the sister group to Nephrozoa. Nature. 2016;530:89–93. - PubMed
    1. Domazet-Lošo T., Brajković J., Tautz D. A phylostratigraphy approach to uncover the genomic history of major adaptations in metazoan lineages. Trends Genet. 2007;23:533–539. - PubMed
    1. Domazet-Lošo T., Carvunis A.-R., Mar Albá M., Šestak M.S., Bakaric R., Nemek R., Tautz D. No evidence for phylostratigraphic bias impacting inferences on patterns of gene emergence and evolution. Mol. Biol. Evol. 2017;34:843–856. - PMC - PubMed

LinkOut - more resources