. 2021 May;15(5):1566-1583.
doi: 10.1002/1878-0261.12934. Epub 2021 Mar 14.

The miR-19b-3p-MAP2K3-STAT3 feedback loop regulates cell proliferation and invasion in esophageal squamous cell carcinoma

Affiliations

The miR-19b-3p-MAP2K3-STAT3 feedback loop regulates cell proliferation and invasion in esophageal squamous cell carcinoma

Ying Zhang et al. Mol Oncol. 2021 May.

Abstract

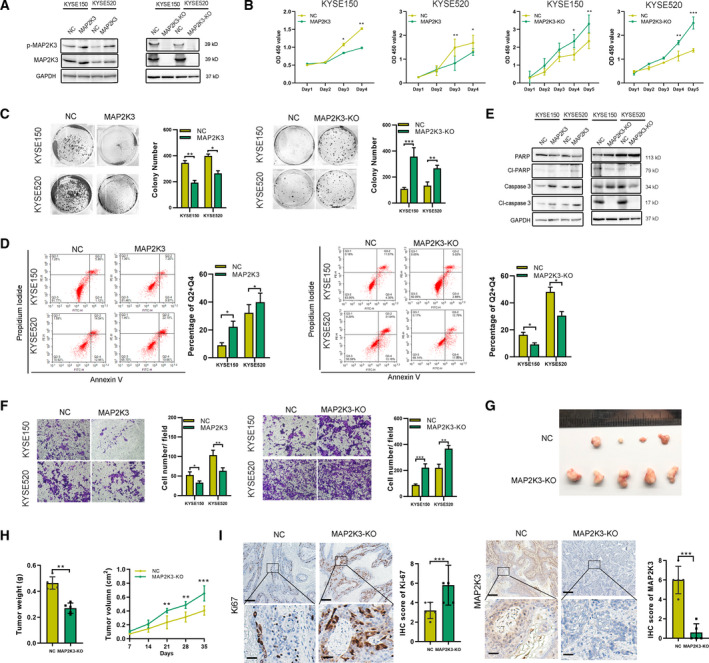
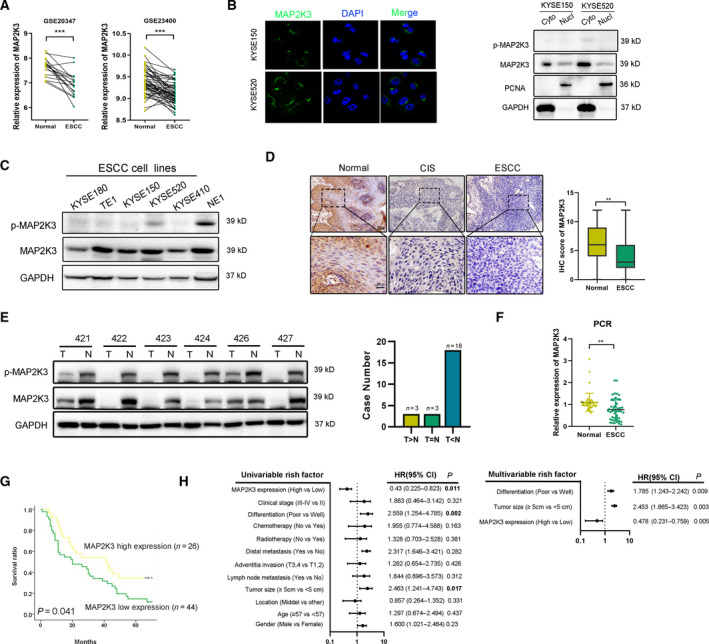
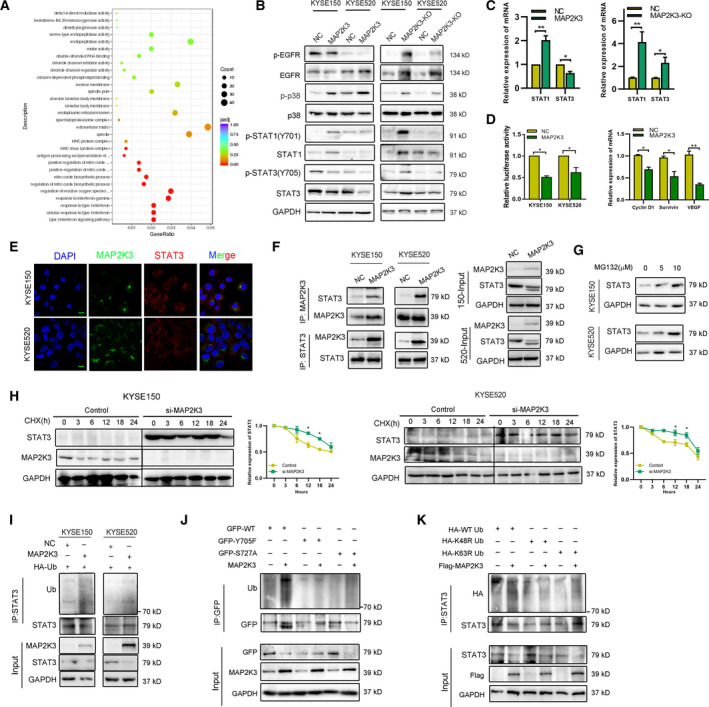
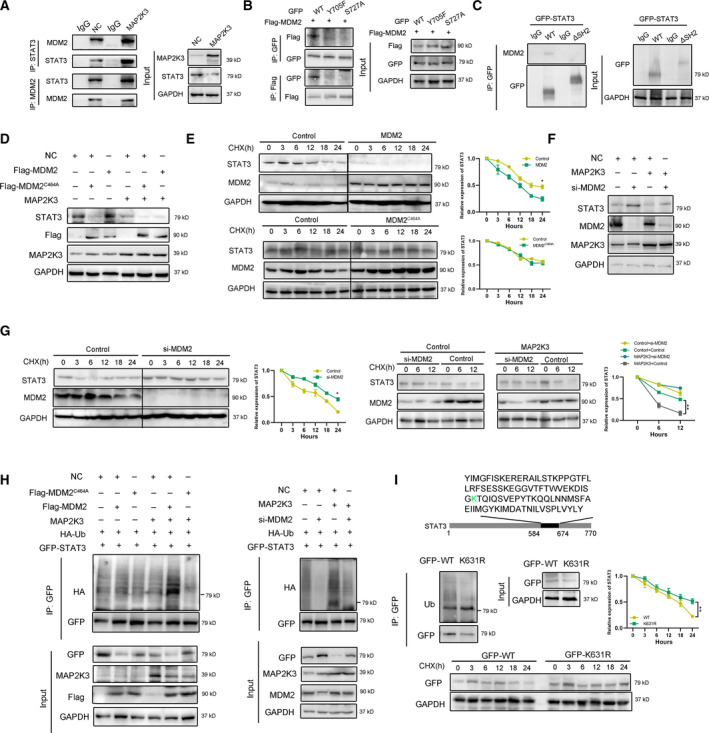
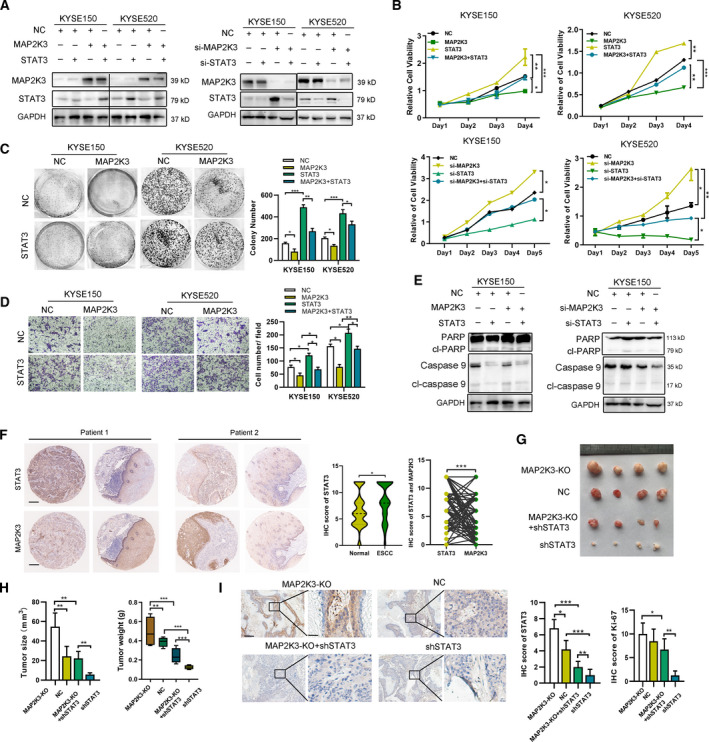
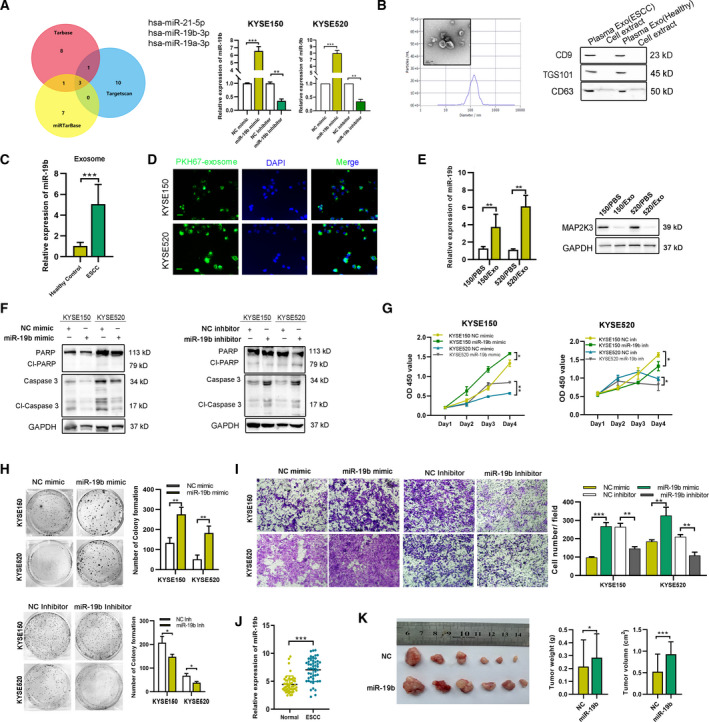
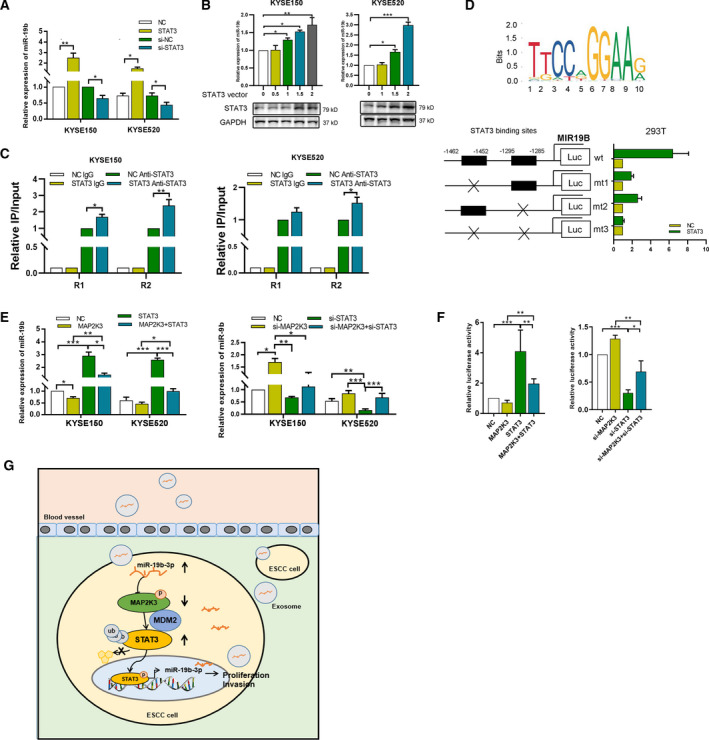
Esophageal squamous cell carcinoma (ESCC) is one of the most refractory malignancies worldwide. Mitogen-activated protein kinase 3 (MAP2K3) has a contradictory role in tumor progression, and the function and expression patterns of MAP2K3 in ESCC remain to be determined. We found that MAP2K3 expression to be downregulated in ESCC, and MAP2K3 downregulation correlated with clinically poor survival. MAP2K3 inhibited ESCC cell proliferation and invasion in vitro and in vivo. MAP2K3 suppressed STAT3 expression and activation. Mechanistically, MAPSK3 interacted with MDM2 to promote STAT3 degradation via the ubiquitin-proteasome pathway. Furthermore, exosomal miR-19b-3p derived from the plasma of patients with ESCC could suppress MAP2K3 expression to promote ESCC tumorigenesis. STAT3 was found to bind to the MIR19B promoter and increased the expression of miR-19b-3p in ESCC cells. In summary, our results demonstrated that the miR-19b-3p-MAP2K3-STAT3 feedback loop regulates ESCC tumorigenesis and elucidates the potential of therapeutically targeting this pathway in ESCC.

Keywords: MAP2K3; MDM2; STAT3; miR-19b-3p.


Conflict of interest statement

The authors declare no conflicts of interest.

Figures

Fig. 1
Fig. 1
MAP2K3 inhibited cell proliferation and invasion in ESCC in vitro and in vivo. (A) Expression of p‐MAP2K3 and MAP2K3 was detected by western blot in KYSE150 and KYSE520 cells after MAP2K3 transfection or knockout. (B) Cell growth was detected by CCK8 after MAP2K3 transfection or knockout in KYSE150 and KYSE520 cells. (C) Colony formation assay was performed after MAP2K3 transfection or knockout in KYSE150 and KYSE520 cells. (D) Flow cytometry analysis of cell apoptosis caused by MAP2K3 transfection or knockout in KYSE150 and KYSE520 cells. (E) Western blot assay was performed to detect apoptosis biomarkers, cleaved (cl‐) PARP, and caspase 3, after MAP2K3 transfection or knockout in KYSE150 and KYSE520 cells. (F) Cell invasion ability was detected by Transwell assay after MAP2K3 transfection or knockout in KYSE150 and KYSE520 cells. (G) Six weeks after KYSE520 MAP2K3‐KO and control cells were inoculated into the armpits of nude mice (n = 5 each group). Tumor volume and mouse weight were measured after injection of the indicated ESCC cells. (H) The tumor weight and size was measured in the indicated time after injection. (I) The representative photographs of immunohistochemistry staining of MAP2K3 and Ki67 in tissues from control or MAP2K3‐KO groups of mice (scale bar: 400 µm, 50 µm, respectively). Error bars represent the SD from at least three independent biological replicates. (*P < 0.05; **P < 0.01; ***P < 0.001 by Student’s t‐test)
Fig. 2
Fig. 2
Expression of MAP2K3 in ESCC tissues and its clinical parameters. (A) Expression of MAP2K3 in ESCC and case‐matched normal epithelium was explored in the GSE database (GSE20347 n = 34 and GSE23400 n = 106). (B) MAP2K3 expression was detected in KYSE150 and KYSE520 by immunofluorescence and nucleus/cytoplasmic assay. (C) Western blot for p‐MAP2K3 and MAP2K3 in ESCC cell lines (KYSE180, TE1, KYSE150, KYSE520, and KYSE410) and an immortalized esophageal cell line (NE1). (D) Representative IHC detection of MAP2K3 in ESCC (n = 140), carcinoma in situ (CIS) (n = 12), and normal epithelial tissues (n = 140). Immunostaining of MAP2K3 in ESCC and normal groups was scored (scale bar: 100 µm, 20 µm, respectively). (E) Western blot for protein expression of MAP2K3 in ESCC (T) and case‐matched normal (N) tissues (n = 24). (F) MAP2K3 was detected in 34 pairs of ESCC and case‐matched normal esophageal epithelial tissues by qRT‐PCR. (G) Kaplan–Meier analysis showed that ESCC patients with high levels of MAP2K3 expression (n = 26) had longer survival times compared with low MAP2K3‐expressing patients (n = 44) (P = 0.041, log‐rank test). (H) Forest plot showing the association between MAP2K3 expression and ESCC survival using univariate and multivariate analyses (HR, hazard ratio; CI, confidence interval). Error bars represent the SD from at least three independent biological replicates. (*P < 0.05; **P < 0.01; ***P < 0.001 by Student’s t‐test).
Fig. 3
Fig. 3
MAP2K3 modulates the EGFR/STAT3 signaling pathway in ESCC by promoting its proteasome degradation. (A) Distribution of the top 20 enriched GO terms in biology process, cellular component, and molecular function for the differentially expressed genes in MAP2K3‐overexpressing ESCC cells based on RNA‐seq analysis. (B) Immunoblot analysis to detect phosphorylation and total EGFR, p38, STAT1, and STAT3 protein expression in ESCC cells. (C) qPCR analysis to detect STAT1 and STAT3 RNA expression after MAP2K3 knockout and transfection in KYSE520 cells. (D) The transcription activity of STAT3 was detected after MAP2K3 transfection by luciferase reporter assay (left panel). The mRNA expression of STAT3 downstream genes was detected by qRT‐PCR (right panel). (E) Colocalization of STAT3 and MAP2K3 was detected by immunofluorescence in KYSE150 and KYSE520 (scale bar: 20 µm). (F) Binding of endogenous MAP2K3 with STAT3 was detected by co‐immunoprecipitation in KYSE150 and KYSE520 cells. (G) Expression of STAT3 was detected by western blot after different doses of MG132 treatment for 24 h. (H) ESCC cells were treated by cycloheximide (CHX, 200 µg·mL−1) in a time‐dependent manner after transfecting si‐MAP2K3 and control. I. STAT3 ubiquitination was detected after MAP2K3 transfection by immunoprecipitation with anti‐STAT3 antibody and immunoblotting with anti‐Ub. (J) GFP‐STAT3 (WT), GFP‐STAT3 (Y705F), or GFP‐STAT3 (S727A) were transfected into KYSE150 cells together with the MAP2K3 plasmid or control, then STAT3 ubiquitination was detected. (K) HA‐tagged wild‐type, K48R, and K63R Ub were transfected into KYSE150 cells together with the MAP2K3 plasmid. STAT3 ubiquitination was detected. Error bars represent the SD from at least three independent biological replicates. (*P < 0.05; **P < 0.01; ***P < 0.001 by Student’s t‐test).
Fig. 4
Fig. 4
MAP2K3 interacted with E3 ligase MDM2 to promote STAT3 degradation. (A) The interaction of STAT3, MAP2K3, and MDM2 was detected by co‐immunoprecipitation in KYSE150 cells. (B) The interaction of GFP‐tagged STAT3 wild‐type (WT), Y705F, S727A, and Flag‐MDM2 was detected by co‐immunoprecipitation in 293T cells. (C) The interaction of GFP‐tagged STAT3 wild‐type (WT) or SH2 domain deletion (ΔSH2) and MDM2 was detected by co‐immunoprecipitation in KYSE150 cells. (D) MDM2 decreased STAT3 protein. KYSE150 cells were transfected with Flag‐MDM2 or Flag‐MDM2C464A as well as control or MAP2K3 transfection. The protein expression level of STAT3 was assayed by western blot. (E) The cells expressing MDM2 or MDM2C464A were treated with cycloheximide (CHX, 200 µg·mL−1). The protein levels of STAT3 and MDM5 were analyzed by western blot. (F) Knockdown MDM2 increased STAT3 protein. KYSE150 cells were transfected with si‐MDM2 as well as control or MAP2K3 transfection. (G) KYSE150 cells were transfected with control or MDM2 siRNAs treated with CHX, and the protein levels of STAT3 and MDM2 were analyzed by western blot. (H) MDM2 ubiquitylates STAT3. KYSE150 cells were transfected with indicated plasmids or siRNA for 48 h. (I) KYSE150 cells were transfected with indicated plasmid, and western blot was performed to analyze the expression of indicated proteins and ubiquitination. Error bars represent the SD from at least three independent biological replicates. (*P < 0.05; **P < 0.01; ***P < 0.001 by Student’s t‐test).
Fig. 5
Fig. 5
STAT3 is an essential factor in MAP2K3‐mediated tumorigenesis in ESCC. (A) The transfection efficiency of indicated plasmids was detected by western blot. (B) Cell growth was detected by CCK8 in KYSE150 and KYSE520 cells with indicated transfection. (C) Colony formation was detected in STAT3 and MAP2K3 transfected KYSE150 and KYSE520 cells. (D) Cell invasion was detected in STAT3 and MAP2K3 transfection cells by Transwell assay. (E) Western blot was performed to detect the expression of (cl‐) PARP and caspase 9 in KYSE150 cells after indicated transfection. (F) MAP2K3 and STAT3 expression was evaluated by IHC (n = 140, scale bars: 200 µm). The IHC score and the correlation between STAT3 and MAP2K3 expression in ESCC patients were shown. (G). The 5‐week‐old immunodeficient nude mice (4 mice per group) were injected subcutaneously with indicated cells (1 × 107 cells). (H). Tumor volume and weight were measured at day 30. (I) Immunohistochemistry analysis of STAT3 and Ki67 of tumor xenografts with indicated treatment (scale bar: 200µm, 50 µm, respectively). Error bars represent the SD from at least three independent biological replicates (*P < 0.05; **P < 0.01; ***P < 0.001 by Student’s t‐test).
Fig. 6
Fig. 6
Exosomal miR‐19b‐3p‐mediated cell proliferation and invasion via suppressing MAP2K3. (A) Venn Diagram: Number of predicted miRNAs from TargetScan, DIANA‐TarBase, and miRTarBase is shown, identifying three miRNAs: miR‐21‐5p, miR‐19a‐3p, and miR‐19b‐3p. The transfection efficiency was detected after miR‐19b‐3p mimic or inhibitor transfection. (B) The exosomes were identified using transmission electron microscopy, nanoparticle tracking analysis (NTA), and western blot analysis (scale bar, 100 nm). (C) Exosomal miR‐19b‐3p expression in healthy (n = 7) and ESCC patient (n = 7) plasma detected by qRT‐PCR. (D) ESCC patient plasma‐derived exosome was dyed with PKH67 (green) and cocultured with ESCC cells for 12 h (scale bar, 100 nm). (E) The expression of miR‐19b‐3p and MAP2K3 in ESCC cells with indicated treatment was detected by qRT‐PCR and western blot. (F) Western blot for apoptosis biomarkers, PARP, and caspase 3 after miR‐19b‐3p mimic transfection. (G) CCK8 assay was performed to detect the cell proliferation in KYSE150 and KYSE520 cells transfected with miR‐19b‐3p mimic, inhibitor, or control vector. (H) Colony formation of KYSE150 and KYSE520 cells transfected with miR‐19b‐3p mimic, inhibitor, or control vector was detected. (I) Cell invasion ability was detected by Transwell assay in KYSE150 and KYSE520 cells transfected with miR‐19b‐3p mimic, inhibitor, or control vector. (J) The expression of miR‐19b‐3p was detected by IHC in ESCC tissues and case‐matched normal esophageal epithelial (n = 48). (K) The 5‐week‐old BALB/C nude mice (6 per group) were injected with stable miR‐19b‐3p expression or control cells, and then, the tumor volume and weight were measured after 4 weeks. Error bars represent the SD from at least three independent biological replicates. (*P < 0.05; **P < 0.01; ***P < 0.001 by Student’s t‐test).
Fig. 7
Fig. 7
STAT3 binds with miR‐19‐3p promoter to increase miR‐19‐3p expression. (A) The expression of miR‐19b‐3p was detected in STAT3 overexpressed and knockdown KYSE150 and KYSE520 cells. (B) The expression of miR‐19b‐3p was detected in different doses of STAT3 plasmids transfected KYSE150 and KYSE520 cells. (C) ChIP assay was performed to detect the binding of STAT3 in the promoter of MIR19 after STAT3 transfection. (D) The binding motif of STAT3 (upper panel). The HEK‐293T cells were cotransfected STAT3 or control with different combinations of wild‐type (wt) and mutated reporter constructs (mt1, mt2, or mt3). The relative luciferase activity was measured (lower panel). (E) The expression of miR‐19b‐3p was detected in KYSE150 and KYSE520 cells with indicated transfection. (F) The relative luciferase activity of MIR19B was analyzed in the indicated transfected KYSE150 and KYSE520 cells. (G) Schematic model of the role of miR‐19b‐3p/MAP2K3/STAT3 feedback loop in regulating ESCC tumorigenesis. Error bars represent the SD from at least three independent biological replicates. (*P < 0.05; **P < 0.01; ***P < 0.001 by Student’s t‐test).

Similar articles

Cited by

References

    1. Lin DC, Hao JJ, Nagata Y, Xu L, Shang L, Meng X, Sato Y, Okuno Y, Varela AM, Ding LW et al. (2014) Genomic and molecular characterization of esophageal squamous cell carcinoma. Nat Genet 46, 467–473. - PMC - PubMed
    1. Paez JG, Janne PA, Lee JC, Tracy S, Greulich H, Gabriel S, Herman P, Kaye FJ, Lindeman N, Boggon TJ et al. (2004) EGFR mutations in lung cancer: correlation with clinical response to gefitinib therapy. Science 304, 1497–1500. - PubMed
    1. Schadendorf D, van Akkooi ACJ, Berking C, Griewank KG, Gutzmer R, Hauschild A, Stang A, Roesch A & Ugurel S (2018) Melanoma. Lancet 392, 971–984. - PubMed
    1. Bossi G (2016) MKK3 as oncotarget. Aging 8, 1–2. - PMC - PubMed
    1. Baldari S, Ubertini V, Garufi A, D'Orazi G & Bossi G (2015) Targeting MKK3 as a novel anticancer strategy: molecular mechanisms and therapeutical implications. Cell Death Dis 6, e1621. - PMC - PubMed

Publication types

MeSH terms