. 2021 Mar 16;93(10):4619-4627.
doi: 10.1021/acs.analchem.0c05277. Epub 2021 Mar 4.

Native Mass Spectrometry Imaging of Proteins and Protein Complexes by Nano-DESI

Affiliations

Native Mass Spectrometry Imaging of Proteins and Protein Complexes by Nano-DESI

Oliver J Hale et al. Anal Chem. .

Abstract

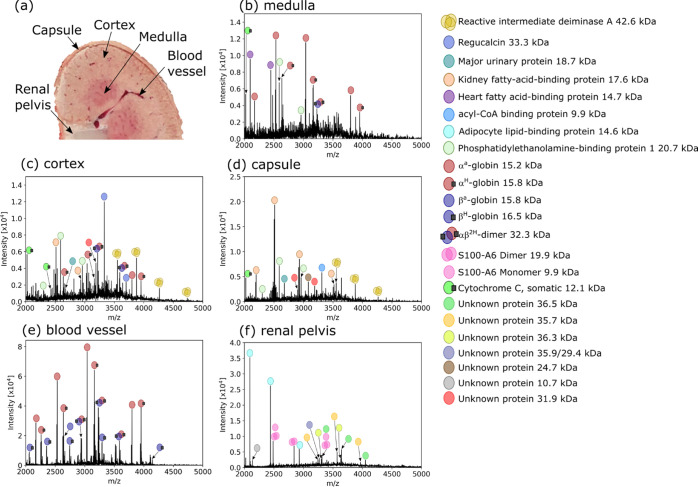
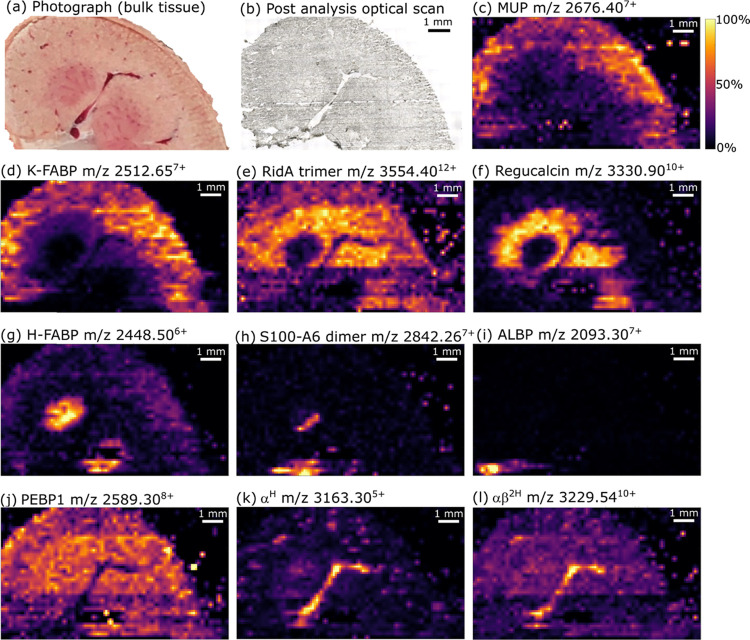
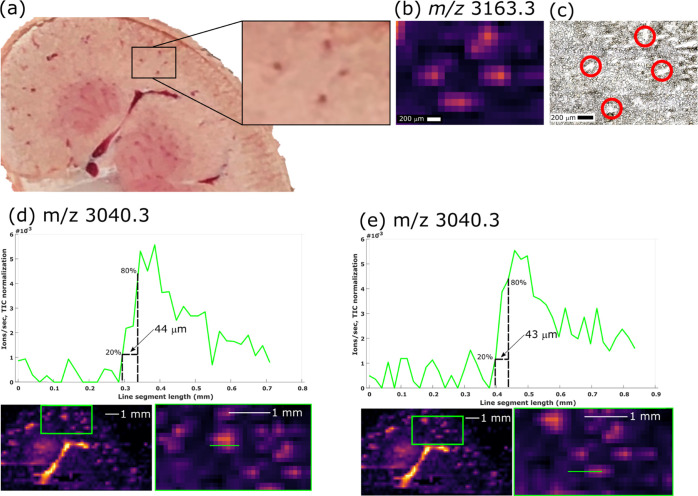
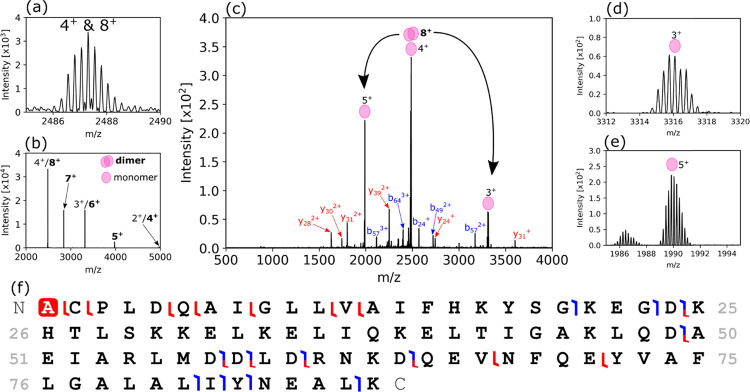
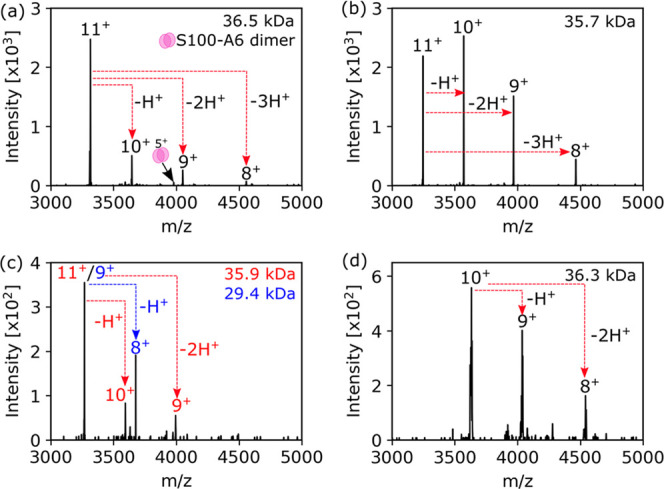
Previously, we have demonstrated native mass spectrometry imaging (native MSI) in which the spatial distribution of proteins maintained in their native-like, folded conformations was determined using liquid extraction surface analysis (LESA). While providing an excellent testbed for proof of principle, the spatial resolution of LESA is currently limited for imaging primarily by the physical size of the sampling pipette tip. Here, we report the adoption of nanospray-desorption electrospray ionization (nano-DESI) for native MSI, delivering substantial improvements in resolution versus native LESA MSI. In addition, native nano-DESI may be used for location-targeted top-down proteomics analysis directly from tissue. Proteins, including a homodimeric complex not previously detected by native MSI, were identified through a combination of collisional activation, high-resolution MS and proton transfer charge reduction.


Conflict of interest statement

The authors declare no competing financial interest.

Figures

Figure 1
Figure 1
(a) Photograph of the rat kidney during sectioning with labeled regions corresponding to the following mass spectra. (b–f) Native mass spectra from distinct regions of the kidney. Some proteins exhibited strong signals in one region, e.g., H-FABP in the medulla (b), regucalcin in the cortex (c), and adipocyte lipid-binding protein in the renal pelvis (f). Spectra are the result of averaging multiple orbitrap scans ((b): 48, ∼0.096 mm2 of tissue sampled, (c): 148, ∼0.3 mm2, (d): 18, ∼0.036 mm2, (e): 22, ∼0.044 mm2, (f): 188, ∼0.376 mm2) from raster line scans acquired at 20 μm/s in the respective region of tissue to improve the signal-to-noise ratio.
Figure 2
Figure 2
Native nano-DESI mass spectrometry imaging: (a) photograph of the kidney during the production of the section for analysis. (b) Optical image of the kidney section after native nano-DESI analysis. Ion images show the distribution of intact proteins throughout the tissue section; (c) MUP (outer cortex), (d) K-FABP (outer cortex), (e) RidA trimer (cortex), (f) regucalcin (inner cortex), (g) H-FABP (medulla), (h) S100-A6 dimer (medulla, renal pelvis) (i) ALBP (renal pelvis adipose tissue), (j) PEBP1 (bulk tissue), (k) αH (vasculature), and (l) αβ2H (vasculature). Images showing additional charge states are found in Figures S13–S18, S20, S22, S24, and S25.
Figure 3
Figure 3
(a) Pattern of four blood vessels was observable on the kidney. The blood vessels (∼200 μm across) are resolved in ion images for m/z 3163.3 (holo-α globin) with pixel dimensions of (b) 200 μm × 200 μm. (c) Optical image of the tissue section post-analysis; blood vessels are highlighted with the red circles. (d, e) Extracted ion chronograms for m/z 3040.3 (apo-α-globin) allow approximation of spatial resolution. Tailing of the signal suggests the resolving power is closer to 200 μm.
Figure 4
Figure 4
Identification of S100-A6 protein dimer. (a) The precursor ion signal showed overlap of two charge states. (b) PTCR-enabled determination of an 8+ charge state obscured by the 4+ signal. (c) HCD MS2 (NCE = 42%) of m/z 2487.3 ± 2.5 (average of 148 scans from a raster line scan through the renal pelvis) dissociated the 8+ dimer to 5+ (d) and 4+ and 3+ (e) subunits, and produced sequence ions noted in (f).
Figure 5
Figure 5
PTCR-enabled charge state determination for low-abundance proteins, which cannot be isotopically resolved by high-resolution MS. (a) m/z 3315.9411+ (36.5 kDa), the 5+ charge state of S100-A6 is also detected due to overlap of the (unknown) 11+ precursor with the (S100-A6 dimer) 6+ precursor. (b) m/z 3247.0711+ (35.7 kDa), (c) m/z 3268.259+/11+ (29.4/35.9 kDa) indicated the presence of two overlapping signals within the isolation window. (d) m/z 3632.9710+ (36.3 kDa).

References

    1. Leney A. C.; Heck A. J. R. Native Mass Spectrometry: What is in the Name?. J. Am. Soc. Mass Spectrom. 2017, 28, 5–13. 10.1007/s13361-016-1545-3. - DOI - PMC - PubMed
    1. Heck A. J. R.; van den Heuvel R. H. H. Investigation of intact protein complexes by mass spectrometry. Mass Spectrom. Rev. 2004, 23, 368–389. 10.1002/mas.10081. - DOI - PubMed
    1. Ruotolo B. T.; Benesch J. L.; Sandercock A. M.; Hyung S. J.; Robinson C. V. Ion mobility-mass spectrometry analysis of large protein complexes. Nat. Protoc. 2008, 3, 1139–1152. 10.1038/nprot.2008.78. - DOI - PubMed
    1. Caprioli R. M.; Farmer T. B.; Gile J. Molecular imaging of biological samples: localization of peptides and proteins using MALDI-TOF MS. Anal. Chem. 1997, 69, 4751–4760. 10.1021/ac970888i. - DOI - PubMed
    1. Stoeckli M.; Chaurand P.; Hallahan D. E.; Caprioli R. M. Imaging mass spectrometry: A new technology for the analysis of protein expression in mammalian tissues. Nat. Med. 2001, 7, 493–496. 10.1038/86573. - DOI - PubMed

Publication types

MeSH terms