. 2021 Apr 8;6(7):e143469.
doi: 10.1172/jci.insight.143469.

Activation of skeletal muscle-resident glial cells upon nerve injury

Affiliations

Activation of skeletal muscle-resident glial cells upon nerve injury

Daisy Proietti et al. JCI Insight. .

Abstract

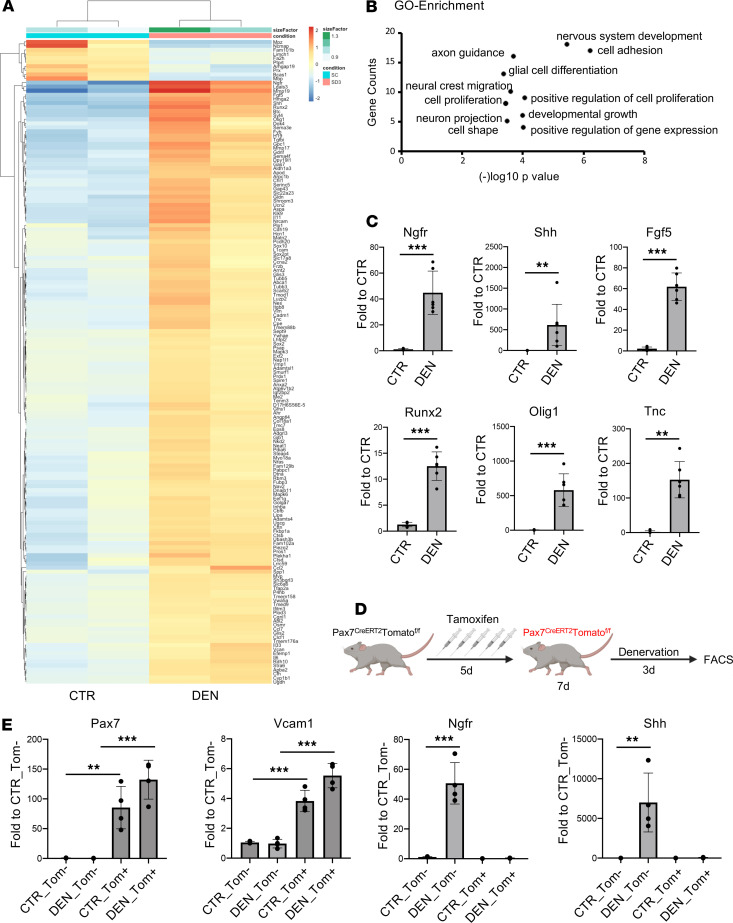
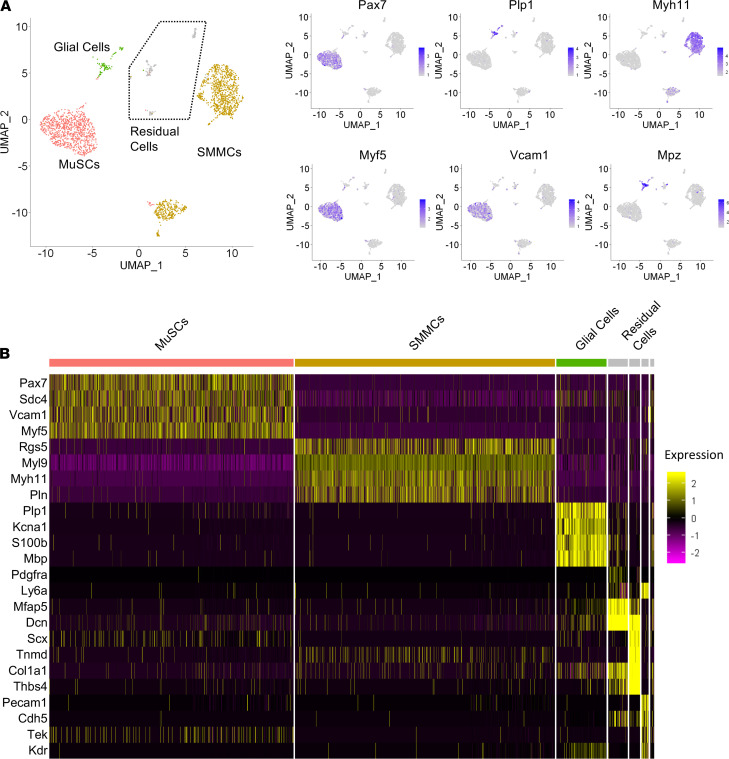
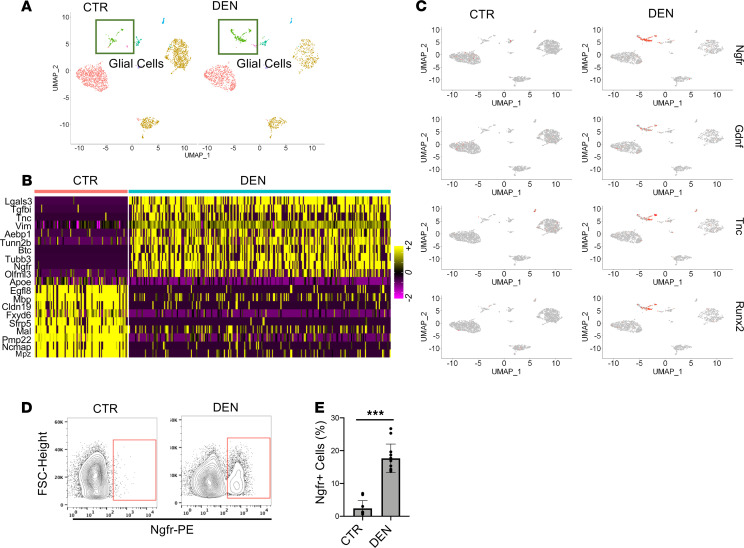
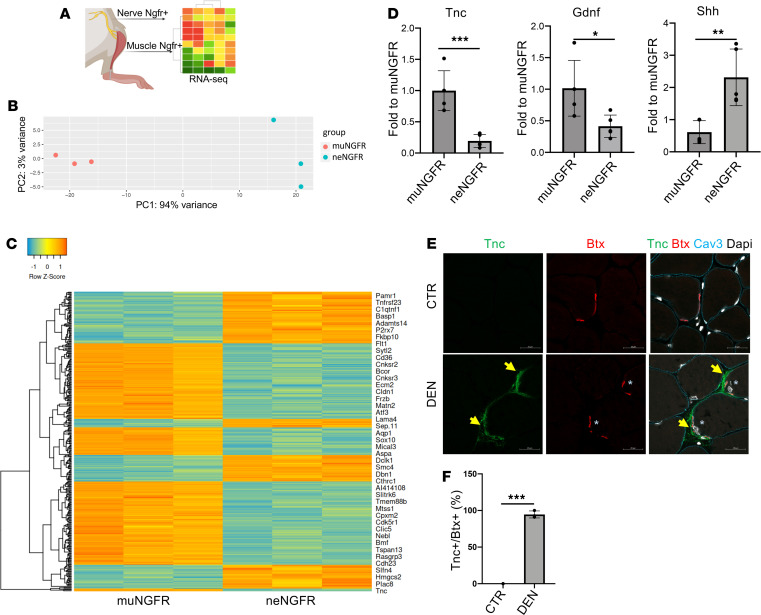
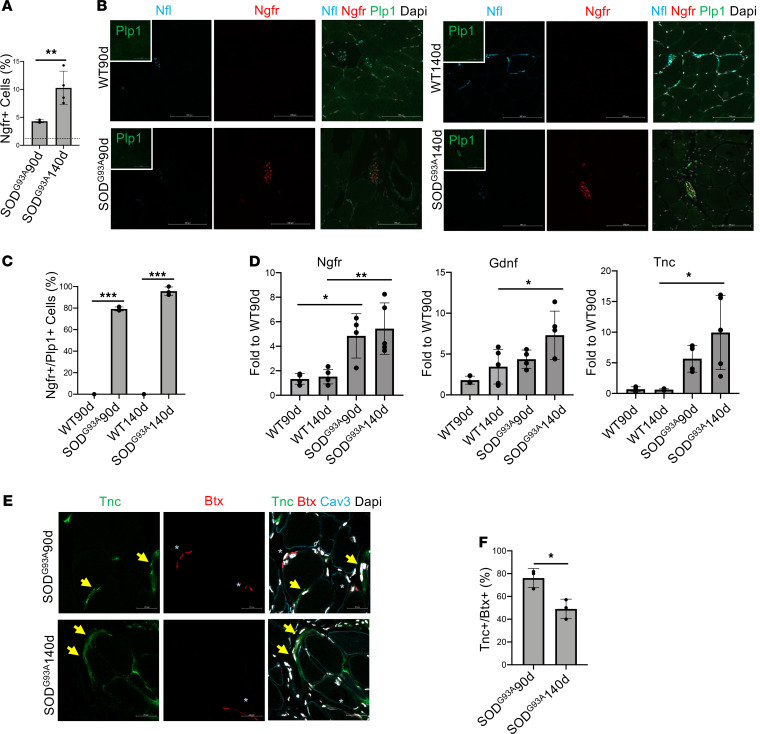
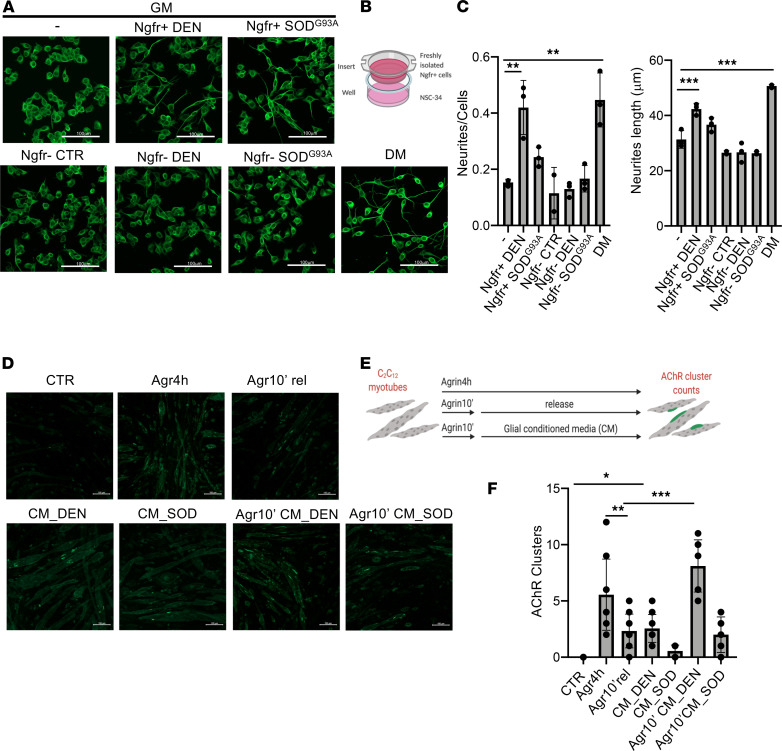
Here, we report on the identification of Itga7-expressing muscle-resident glial cells activated by loss of neuromuscular junction (NMJ) integrity. Gene expression analysis at the bulk and single-cell level revealed that these cells are distinct from Itga7-expressing muscle satellite cells. We show that a selective activation and expansion of Itga7+ glial cells occur in response to muscle nerve lesion. Upon activation, muscle glial-derived progenies expressed neurotrophic genes, including nerve growth factor receptor, which enables their isolation by FACS. We show that activated muscle glial cells also expressed genes potentially implicated in extracellular matrix remodeling at NMJs. We found that tenascin C, which was highly expressed by muscle glial cells, activated upon nerve injury and preferentially localized to NMJ. Interestingly, we observed that the activation of muscle glial cells by acute nerve injury was reversible upon NMJ repair. By contrast, in a mouse model of ALS, in which NMJ degeneration is progressive, muscle glial cells steadily increased over the course of the disease. However, they exhibited an impaired neurotrophic activity, suggesting that pathogenic activation of glial cells may be implicated in ALS progression.

Keywords: Muscle Biology; Neuromuscular disease; Skeletal muscle.


Conflict of interest statement

Conflict of interest: The authors have declared that no conflict of interest exists.

Figures

Figure 1
Figure 1. Activation of a neurotrophic signaling pathway in the Itga7+Sca1Ln myogenic cell fraction.
(A) Heatmap representation of genes significantly deregulated (P adj < 0.001) in ltga7+Sca1Ln freshly isolated cells derived from denervated (cut) muscle at 3 days after nerve lesion (n = 2). (B) Gene ontology (GO) enrichment in biological function of genes significantly deregulated (P adj < 0.001) in ltga7+Sca1Ln cells derived from 3 days denervated muscle. (C) qPCR analysis for Ngfr, Shh, Fgf5, Runx2, Olig1, and Tnc expression in freshly isolated ltga7+Sca1Ln cells derived from control and 3 days reversible denervated (crush) muscle. GAPDH was used as housekeeping gene (n ≥ 5, values represent mean ± SD, **P < 0.01, ***P < 0.001; by Student’s t test (Ngfr, Fgf5, Olig1, Runx2, and Shh) or by Mann-Whitney test (Tnc). (D) Working model of tamoxifen-induced (Tmx-induced) in vivo treatment. (E) qPCR analysis for Pax7, Vcam1, Ngfr, and Shh expression in freshly isolated Tomato+ and Tomato cells derived from control and 3 days denervated muscle of Tmx-treated PAX7.Cre_tdTomato mice. GAPDH was used as housekeeping gene (n = 4, values represent mean ± SD, **P < 0.01, ***P < 0.001; by 1-way ANOVA Tukey’s multiple-comparison test).
Figure 2
Figure 2. Itga7+ cell heterogeneity revealed by single-cell RNA-Seq analysis.
(A) Distribution of Pax7, Plp1, Myh11, Myf5, Vcam1, and Mpz transcripts in Uniform Manifold Approximation and Projection–derived (UMAP-derived) clusters of single cells (scRNA-Seq) of ltga7+Sca1Ln isolated cells from control muscle. (B) RNA expression heatmap for the given cell populations (column) and genes (row), sorted by clusters. The canonical markers used to identify each cluster are plotted (or the most variable genes per cluster in cases where markers were not already present in the literature). MuSCs, muscle satellite cells; SMMCs, smooth muscle mesenchymal cells.
Figure 3
Figure 3. Activation of a neurotrophic signaling pathway in muscle glial cells upon denervation.
(A) Distribution in UMAP-derived clusters of single cells (scRNA-Seq) of ltga7+Sca1Ln isolated cells from control (CTR, left) and 3-days denervated muscle (DEN, right). (B) RNA expression heatmap for Plp1 cell populations isolated from control and denervated muscle (column) and genes (row), sorted by clusters. (C) Distribution of Ngfr, Gdnf, Tnc, and Runx2 transcripts in UMAP-derived clusters of single cells (scRNA-Seq) of ltga7+Sca1Ln isolated cells from control (left) and denervated (right) muscle. (D) Representative cytofluorimetric plot of Ngfr+— gated within the ltga7+Sca1Ln population — cells in control (left) and denervated (right) muscle. (E) Quantification of Ngfr+ cells is shown in the graphs as a percentage of ltga7+Sca1Ln population (n = 8 CTR, n = 10 DEN, values represent mean ± SD, ***P < 0.001; by Mann-Whitney test).
Figure 4
Figure 4. A specific transcriptional signature distinguishes glial cells in muscle from those residing in the nerve.
(A) Experimental setting for RNA-Seq analysis of Ngfr+ cells derived from denervated muscle and nerve at 3 days after nerve lesion. (B) Sample distance — represented as principal component analysis (PCA) — of transcriptome of Ngfr+ cells derived from denervated muscle and nerve at 3 days after nerve lesion (n = 3). (C) Heatmap representation of genes significantly deregulated — P adj < 0.001 — in freshly isolated Ngfr+ cells derived from denervated muscle and nerve at 3 days after nerve lesion (n = 3). (D) qPCR analysis for Tnc, Gdnf, and Shh expression in freshly isolated Ngfr+ cells derived from denervated muscle (muNGFR) and nerve (neNGFR) at 3 days after nerve lesion (n = 4, values represent mean ± SD.*P < 0.05, **P < 0.01, ***P < 0.001; by 2-tailed Student’s t test Tnc, Gdnf or by Mann-Whitney, Shh). (E) Representative immunofluorescence analysis of TA muscle cryosection derived from control and denervated muscle, stained for Tnc (green), Bungarotoxin (Btx, red), and Caveolin-3 (Cav3, Cyan). Arrows highlight Tnc and asterisks highlight Btx. Nuclei were counterstained with DAPI. Scale bar: 20 μm. (F) Quantification Btx and Tnc colocalization in control and denervated muscle (n = 3, values represent mean ± SD, ***P < 0.001; by 2-tailed Student’s t test).
Figure 5
Figure 5. Muscle-resident glial cell activation in a mouse model of ALS.
(A) Ngfr+ cell cytofluorimetric quantification was shown in the graphs as a percentage of Itga7+Sca1Ln population, in 90- and 140-day-old SODG93A mice muscle (n = 4, values represent mean ± SD. **P < 0.01; by 1-way ANOVA Tukey’s multiple-comparison test). Dotted line highlights percentage in WT mice muscle. (B) Representative immunofluorescence analysis of TA muscle cryosection derived from 90- and 140-day-old SODG93A and WT mice stained for neurofilament-L (Nfl, Cyan), Ngfr (red), and Plp1 (green). Nuclei were counterstained with DAPI. Scale bars: 100 μm. (C) Quantification graph of Ngfr+/Plp1+ cells in 90- and 140-day-old WT and SODG93A mice muscle (n = 3, values represent mean ± SD; ***P < 0.001; by 1-way ANOVA Tukey’s multiple-comparison test). (D) qPCR analysis for Ngfr, Gdnf, and Tnc expression in freshly isolated Itga7+Sca1Ln cells derived from WT and SODG93A muscle at 90 and 140 days of postnatal life. GAPDH was used as housekeeping gene (n = 4, values represent mean ± SD; *P < 0.05, **P < 0.01; by 1-way ANOVA Tukey’s multiple-comparison test). (E) Representative immunofluorescence analysis of TA muscle cryosection derived from 90- and 140-day-old SODG93A and WT mice stained for Tnc (green), Btx (red), and Caveolin-3 (Cav3, cyan). Arrows highlight Tnc and asterisk highlights Btx. Nuclei were counterstained with DAPI. Scale bar: 20 μm. (F) Quantification of Btx and Tnc colocalization in 90- and 140-day-old SODG93A mice muscle (n = 3, values represent mean ± SD *P < 0.05; by 2-tailed Student’s t test).
Figure 6
Figure 6. Muscle-resident glial cells promote neurite outgrowth and AChR clustering.
(A) Representative immunofluorescence analysis of NSC-34 cells in growth media cultured either alone (-) or in coculture with Ngfr+ or with Ngfr–- cells, both from denervated muscle and SODG93A muscle at 90 days of postnatal life, and of NSC-34 cells cultured in neurogenic differentiation media (DM), stained for β-3-Tubulin (green). Scale bars: 100 μm. (B) Schematic representation of in vitro coculture system. (C) Quantification of neurite number per cell and length of NSC-34 cultured in the indicated conditions (n = 3, values represent mean ± SD; **P < 0.01, **P < 0.01; by 1-way ANOVA Tukey’s multiple-comparison test). (D) Representative immunofluorescence analysis of C2C12 myotubes treated or not with agrin or conditioned media from glial cells as indicated and stained with Btx (green). Scale bars: = 100 μm. (E) Schematic representation of the experimental setting. (F) Quantification of AChR clustering (25 μm) (n = 5, values represent mean ± SD; *P < 0.05, **P < 0.01, ***P < 0.001; by 1-way ANOVA Tukey’s multiple-comparison test).

References

    1. Farup J, et al. Interactions between muscle stem cells, mesenchymal-derived cells and immune cells in muscle homeostasis, regeneration and disease. Cell Death Dis. 2015;6(7):e1830–e1830. doi: 10.1038/cddis.2015.198. - DOI - PMC - PubMed
    1. Bentzinger CF, et al. Cellular dynamics in the muscle satellite cell niche. EMBO Rep. 2013;14(12):1062–1072. doi: 10.1038/embor.2013.182. - DOI - PMC - PubMed
    1. Mauro A. Satellite cell of skeletal muscle fibers. J Biophys Biochem Cytol. 1961;9:493–495. doi: 10.1083/jcb.9.2.493. - DOI - PMC - PubMed
    1. Wosczyna MN, Rando TA. A muscle stem cell support group: coordinated cellular responses in muscle regeneration. Dev Cell. 2018;46(2):135–143. doi: 10.1016/j.devcel.2018.06.018. - DOI - PMC - PubMed
    1. Feige P, et al. Orienting muscle stem cells for regeneration in homeostasis, aging, and disease. Cell Stem Cell. 2018;23(5):653–664. doi: 10.1016/j.stem.2018.10.006. - DOI - PMC - PubMed

Publication types

MeSH terms