

Surveillance for West Nile Virus Disease - United States, 2009-2018
- PMID: 33661868
- PMCID: PMC7949089
- DOI: 10.15585/mmwr.ss7001a1
Surveillance for West Nile Virus Disease - United States, 2009-2018
Abstract
Problem/condition: West Nile virus (WNV) is an arthropodborne virus (arbovirus) in the family Flaviviridae and is the leading cause of domestically acquired arboviral disease in the contiguous United States. An estimated 70%-80% of WNV infections are asymptomatic. Symptomatic persons usually develop an acute systemic febrile illness. Less than 1% of infected persons develop neuroinvasive disease, which typically presents as encephalitis, meningitis, or acute flaccid paralysis.
Reporting period: 2009-2018.
Description of system: WNV disease is a nationally notifiable condition with standard surveillance case definitions. State health departments report WNV cases to CDC through ArboNET, an electronic passive surveillance system. Variables collected include patient age, sex, race, ethnicity, county and state of residence, date of illness onset, clinical syndrome, hospitalization, and death.
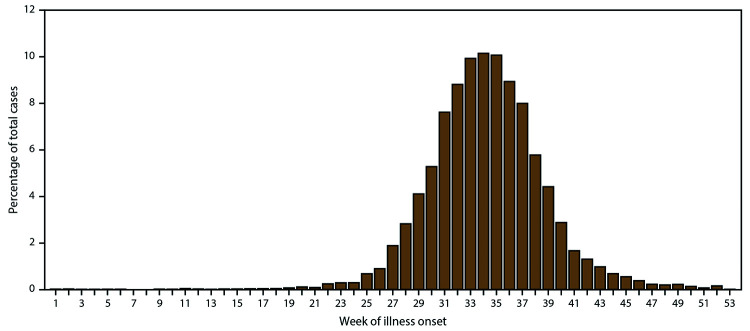
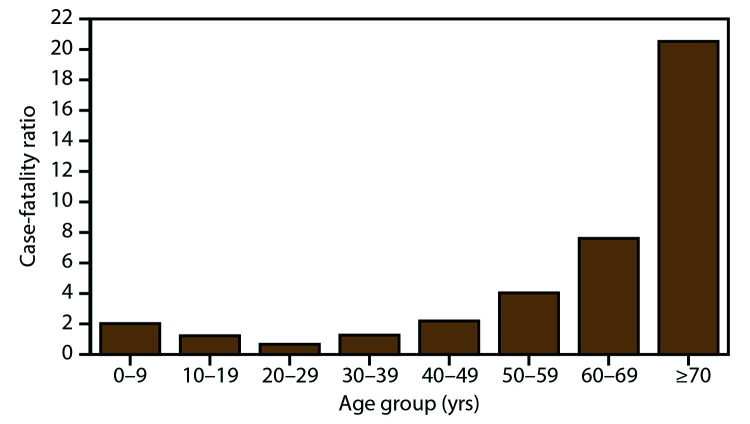
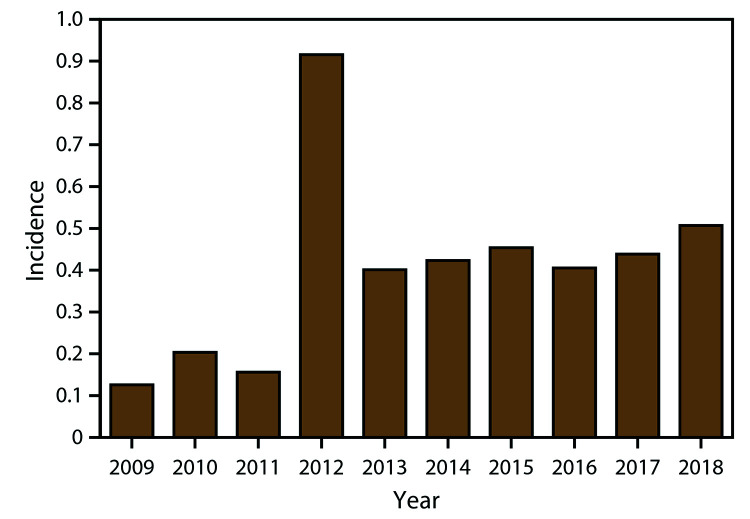
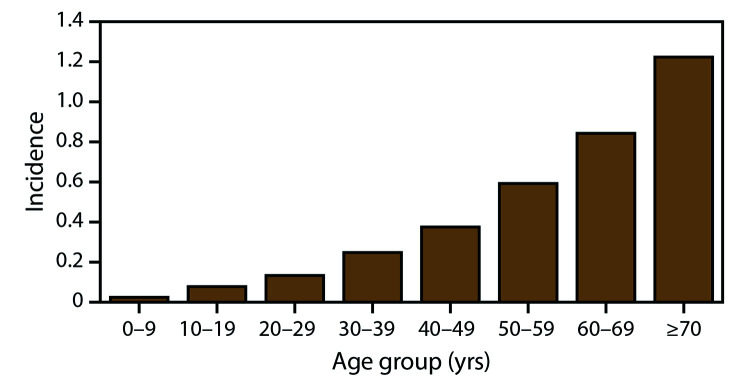
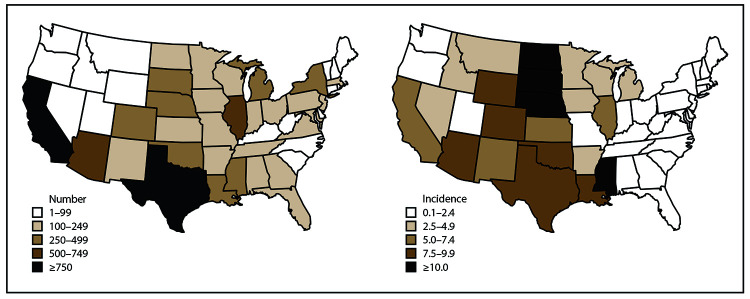
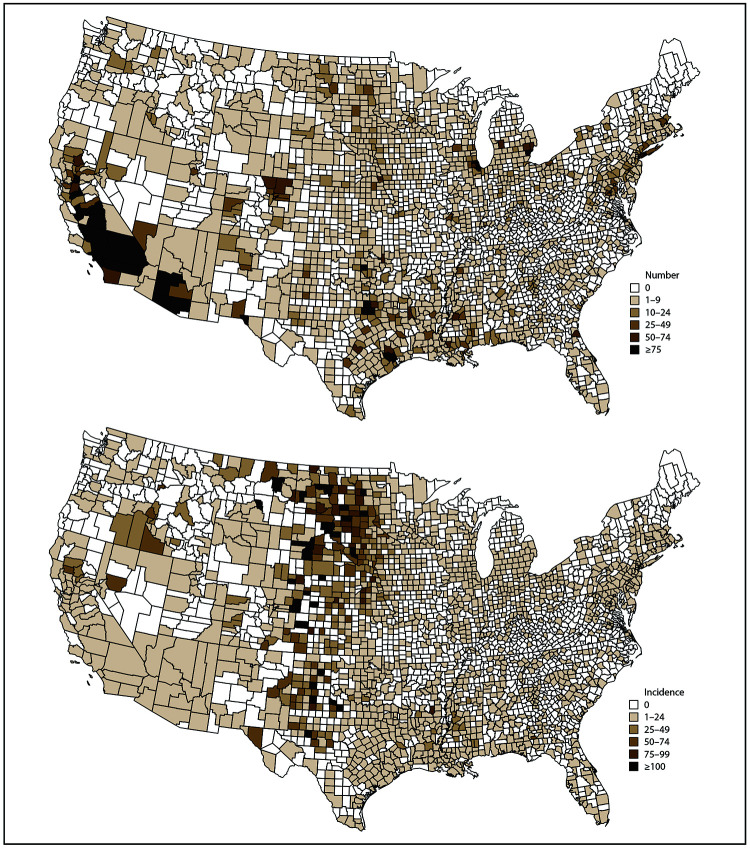
Results: During 2009-2018, a total of 21,869 confirmed or probable cases of WNV disease, including 12,835 (59%) WNV neuroinvasive disease cases, were reported to CDC from all 50 states, the District of Columbia, and Puerto Rico. A total of 89% of all WNV patients had illness onset during July-September. Neuroinvasive disease incidence and case-fatalities increased with increasing age, with the highest incidence (1.22 cases per 100,000 population) occurring among persons aged ≥70 years. Among neuroinvasive cases, hospitalization rates were >85% in all age groups but were highest among patients aged ≥70 years (98%). The national incidence of WNV neuroinvasive disease peaked in 2012 (0.92 cases per 100,000 population). Although national incidence was relatively stable during 2013-2018 (average annual incidence: 0.44; range: 0.40-0.51), state level incidence varied from year to year. During 2009-2018, the highest average annual incidence of neuroinvasive disease occurred in North Dakota (3.16 cases per 100,000 population), South Dakota (3.06), Nebraska (1.95), and Mississippi (1.17), and the largest number of total cases occurred in California (2,819), Texas (2,043), Illinois (728), and Arizona (632). Six counties located within the four states with the highest case counts accounted for 23% of all neuroinvasive disease cases nationally.
Interpretation: Despite the recent stability in annual national incidence of neuroinvasive disease, peaks in activity were reported in different years for different regions of the country. Variations in vectors, avian amplifying hosts, human activity, and environmental factors make it difficult to predict future WNV disease incidence and outbreak locations.
Public health action: WNV disease surveillance is important for detecting and monitoring seasonal epidemics and for identifying persons at increased risk for severe disease. Surveillance data can be used to inform prevention and control activities. Health care providers should consider WNV infection in the differential diagnosis of aseptic meningitis and encephalitis, obtain appropriate specimens for testing, and promptly report cases to public health authorities. Public health education programs should focus prevention messaging on older persons, because they are at increased risk for severe neurologic disease and death. In the absence of a human vaccine, WNV disease prevention depends on community-level mosquito control and household and personal protective measures. Understanding the geographic distribution of cases, particularly at the county level, appears to provide the best opportunity for directing finite resources toward effective prevention and control activities. Additional work to further develop and improve predictive models that can foreshadow areas most likely to be impacted in a given year by WNV outbreaks could allow for proactive targeting of interventions and ultimately lowering of WNV disease morbidity and mortality.
Conflict of interest statement
All authors have completed and submitted the International Committee of Medical Journal Editors form for disclosure of potential conflicts of interest. No potential conflicts of interest were disclosed.
Figures
References
-
- Hayes CG. West Nile fever. In: Monath TP, ed. The arboviruses: epidemiology and ecology, vol. V. Boca Raton, Florida: CRC Press;1989:59–88.
MeSH terms
LinkOut - more resources
Full Text Sources
Other Literature Sources
Medical