. 2021 Mar 4;19(3):e3001121.
doi: 10.1371/journal.pbio.3001121. eCollection 2021 Mar.

CD74 is a regulator of hematopoietic stem cell maintenance

Affiliations

CD74 is a regulator of hematopoietic stem cell maintenance

Shirly Becker-Herman et al. PLoS Biol. .

Abstract

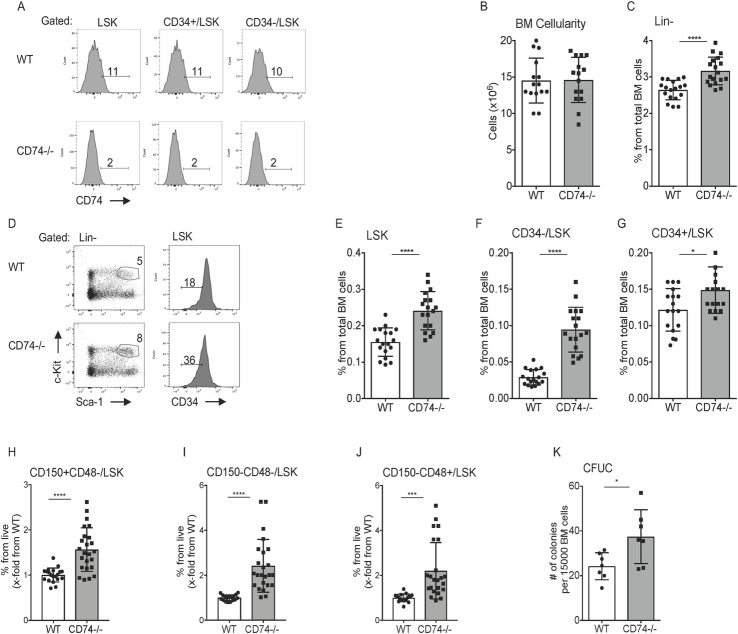
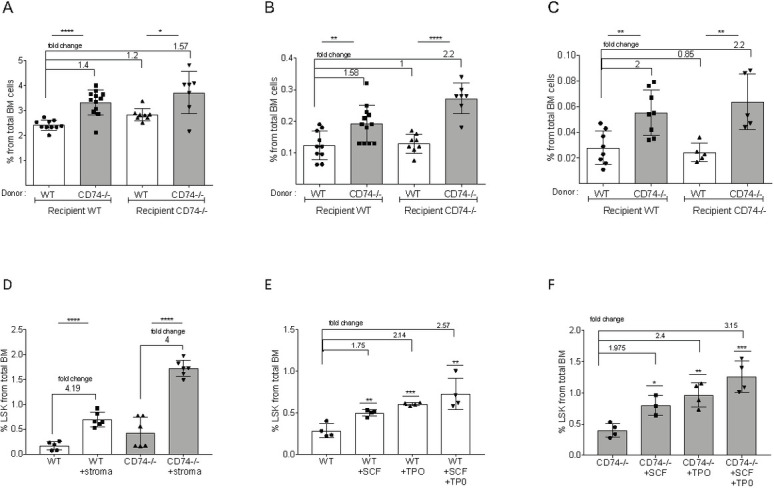
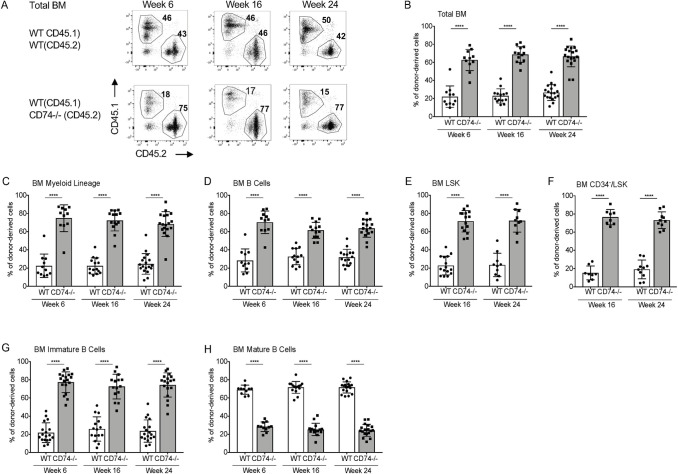
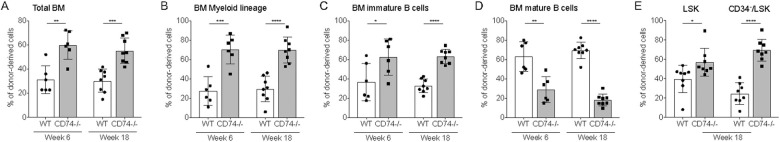
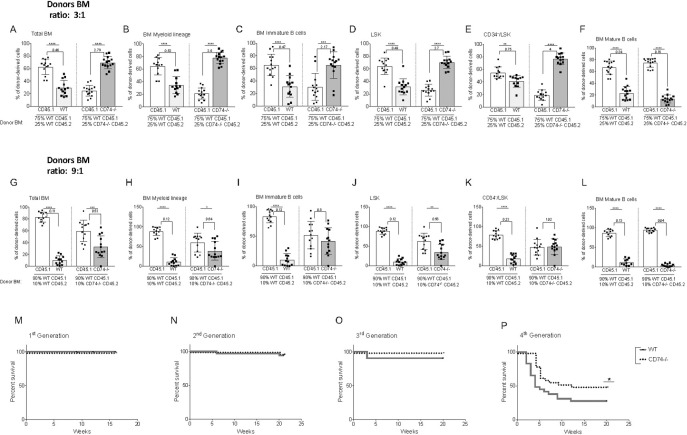
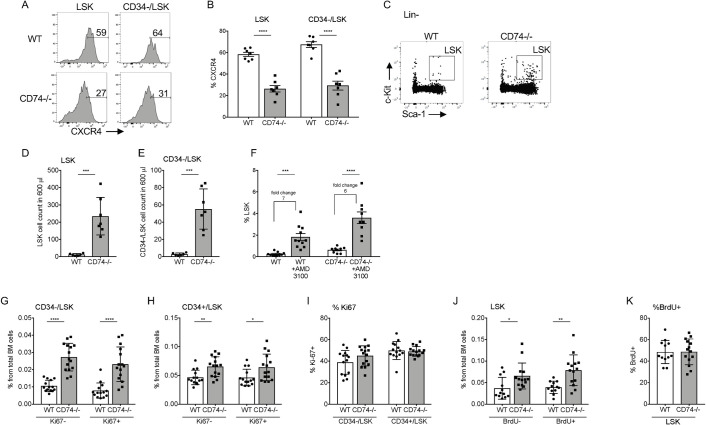
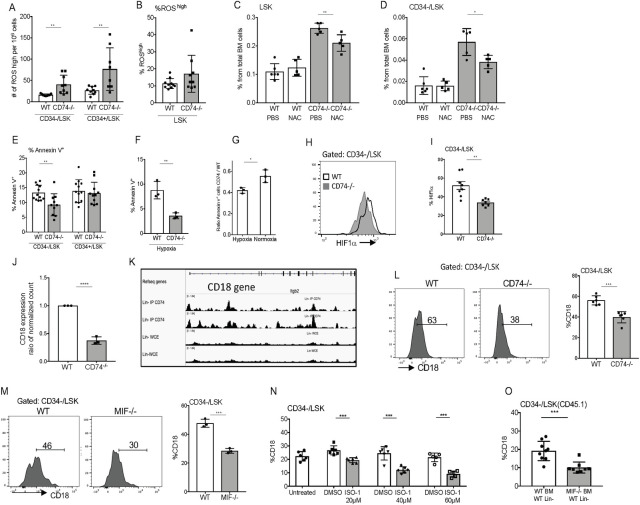
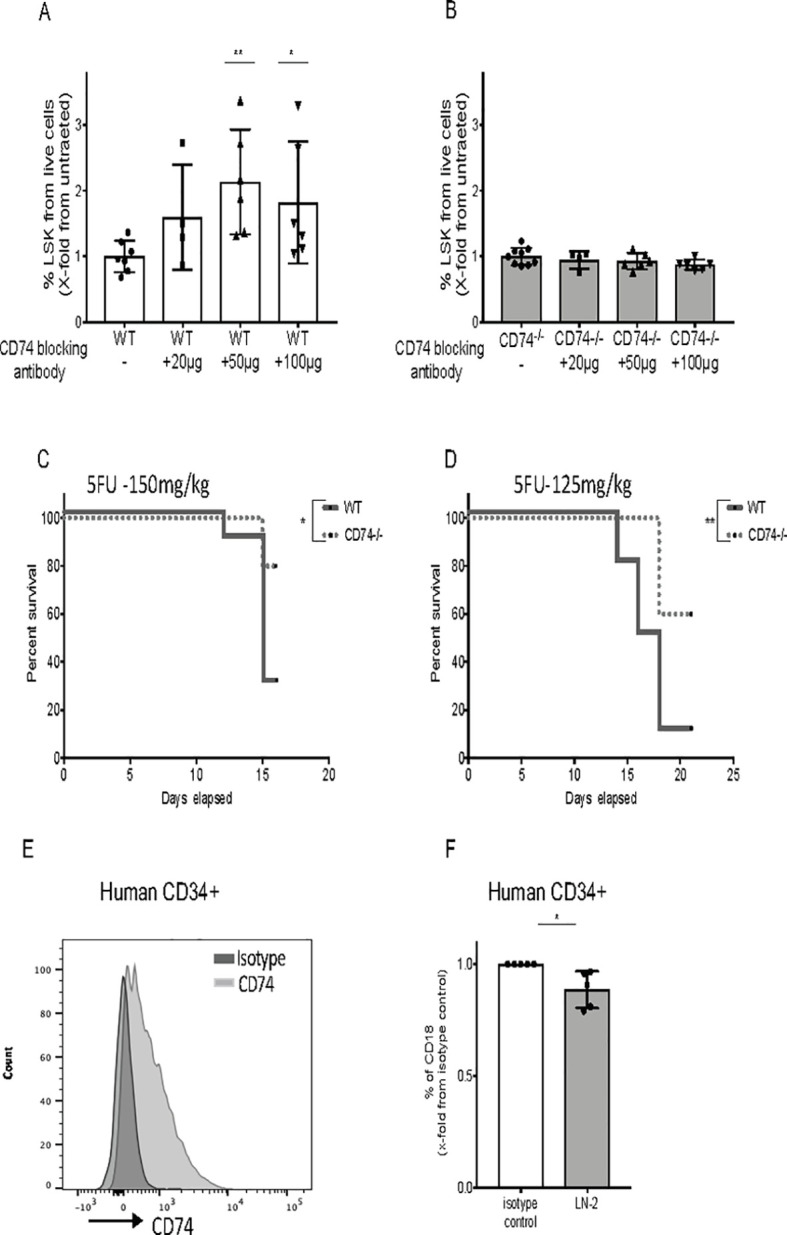
Hematopoietic stem and progenitor cells (HSPCs) are a small population of undifferentiated cells that have the capacity for self-renewal and differentiate into all blood cell lineages. These cells are the most useful cells for clinical transplantations and for regenerative medicine. So far, it has not been possible to expand adult hematopoietic stem cells (HSCs) without losing their self-renewal properties. CD74 is a cell surface receptor for the cytokine macrophage migration inhibitory factor (MIF), and its mRNA is known to be expressed in HSCs. Here, we demonstrate that mice lacking CD74 exhibit an accumulation of HSCs in the bone marrow (BM) due to their increased potential to repopulate and compete for BM niches. Our results suggest that CD74 regulates the maintenance of the HSCs and CD18 expression. Its absence leads to induced survival of these cells and accumulation of quiescent and proliferating cells. Furthermore, in in vitro experiments, blocking of CD74 elevated the numbers of HSPCs. Thus, we suggest that blocking CD74 could lead to improved clinical insight into BM transplant protocols, enabling improved engraftment.


Conflict of interest statement

The authors have declared that no competing interests exist.

Figures

Fig 1
Fig 1. Expansion of HSPCs in the BM of CD74−/− mice.
(A) BM cells derived from WT or CD74−/− were purified. Histograms show representative analysis of CD74 expression on HSPCs in WT and CD74−/− mice. n = 3. (B) Total BM cellularity per femur and tibia in WT and CD74−/− mice, Data A in S1 Data. (C–J) The percent of the different populations in WT and CD74−/−-derived BM cells. (C) Lin-; Data B in S1 Data (D) Representative FACS analysis of WT and CD74−/− HSPCs; (E) LSK; Data C in S1 Data (F) CD34-/LSK; Data D in S1 Data and (G) CD34+; Data E in S1 Data (H) CD150+CD48-LSK; Data F in S1 Data (I) CD150-CD48-/LSK; Data G in S1 Data and (J) CD150-CD48+/LSK; n = 14–18, Data H in S1 Data. (K) CFUC assay: Total BM cells from WT and CD74−/− mice were seeded at 15,000 cells/mL in semisolid cultures supplemented with cytokines and nutrients. CFU-C were counted 7 days later; n = 7, Data I in S1 Data. Bars show SEM. Unpaired two-tailed t test *p < 0.05; **p < 0.01; ***p < 0.001; ****p < 0.0001. The fcs files and gates can be found at the Flow Repository (accession number FR-FCM-Z3F2). BM, bone marrow; CFU-C, colony-forming unit cell; FACS, fluorescence-activated cell sorting; HSPC, hematopoietic stem and progenitor cell; WT, wild-type.
Fig 2
Fig 2. CD74−/− HSPC expansion is cell intrinsic.
Lethally irradiated WT or CD74−/− mice were transplanted with either WT or CD74−/− total BM cells. Long-term reconstitution was evaluated 16 weeks posttransplantation. Percent of total BM cells was calculated for (A) LIN-; Data A in S2 Data (B) LSK; Data B in S2 Data and (C) CD34-/LSK; Data C in S2 Data n = 5–12. Bars show SEM. Unpaired two-tailed t test *<0.05 **<0.01 ***<0.001 ****<0.0001. (D) WT and CD74−/− BM (2*106 cells) were incubated with or without 105 stroma cells. After 48 h, percent LSK from live cells was analyzed; n = 5–6, Data D in S2 Data. (E, F) WT and CD74−/− BM (2*106) were incubated with or without 50 μg SCF and 50 μg TPO, or both SCF and TPO (50 μg each). After 48 h, percent LSK from live cells was analyzed; n = 4, Data E and F in S2 Data. BM, bone marrow; HSPC, hematopoietic stem and progenitor cell; SCF, stem cell factor; TPO, thrombopoietin; WT, wild-type.
Fig 3
Fig 3. CD74−/− HSPCs have an advantage in BM repopulation.
Lethally irradiated WT (CD45.1) mice were transplanted with BM derived from WT (CD45.1) and WT (CD45.2) at a 1:1 ratio, or BM derived from WT (CD45.1) and CD74−/− (CD45.2) mice at a 1:1 ratio. (A) Representative BM FACS staining. Percent of donor-derived cells was analyzed in the BM after 6, 16, and 24 weeks in (B) Total BM cells; Data A in S3 Data (C) myeloid cells (CD11B+); Data B in S3 Data (D) B cells (B220+); Data C in S3 Data (E) LSK; Data D in S3 Data (F) CD34-/LSK; Data E in S3 Data (G) immature BM B cells (B220+IgD-); Data F in S3 Data (H) mature BM B cells (B220+ IgM+ IgD+); Data G in S3 Data. n = 8–18. Bars show SEM. Unpaired two-tailed t test *p < 0.05; **p < 0.01; ***p < 0.001; ****p < 0.0001. The fcs files and gates can be found at the Flow Repository (accession number FR-FCM-Z3F2). BM, bone marrow; FACS, fluorescence-activated cell sorting; HSPC, hematopoietic stem and progenitor cell; WT, wild-type.
Fig 4
Fig 4. CD74−/− HSPCs show a higher potential to repopulate the BM.
Lethally irradiated WT CD45.1 recipient mice were reconstituted with 7.5*104 sorted LSK cells from WT (CD45.1), and 7.5 × 10⁴ sorted LSK from CD74−/− (CD45.2) at a 1:1 ratio. Percent of donor-derived cells was analyzed in the BM after 6 and 18 weeks. (A) Total BM cells; Data A in S4 Data (B) myeloid cells; Data B in S4 Data (C) immature BM B cells; Data C in S4 Data and (D) mature BM B cells, Data D in S4 Data. (E) Percent of donor-derived cells was analyzed in LSK and CD34-LSK cells 18 weeks posttransplant. n = 6–8. Data E in S4 Data. n = 6–8. Bars show SEM. Unpaired two-tailed t test *p < 0.05; **p < 0.01; ***p < 0.001; ****p < 0.0001. BM, bone marrow; HSPC, hematopoietic stem and progenitor cell; WT, wild-type.
Fig 5
Fig 5. CD74−/− HSPCs demonstrate enhanced long-term self-renewal capacity.
(A–F) Lethally irradiated WT(CD45.1) mice were transplanted with BM derived from WT (CD45.1) and WT(CD45.2) at a 3:1 ratio, or BM derived from WT (CD45.1) and CD74−/− (CD45.2) mice at a 3:1 ratio. Mice were analyzed 16 weeks after transplantation. Graphs show percent of donor derived cells from both WTCD45.1/WTCD45.2 and WTCD45.1/CD74−/− CD45.2 chimera. (A) Total BM cells; Data A in S5 Data (B) BM myeloid cells; Data B in S5 Data (C) BM immature B cells; Data C in S5 Data (D) LSK; Data D in S5 Data (E) CD34-/LSK; Data E in S5 Data (F) Mature BM B cells; Data F in S5 Data. n = 13. (G–L) Lethally irradiated WT(CD45.1) mice were transplanted with BM derived from WT (CD45.1) and WT(CD45.2) at a 9:1 ratio, or BM derived from WT (CD45.1) and CD74−/− (CD45.2) mice at a 9:1 ratio. Mice were analyzed 16 weeks after transplantation. Graphs show percent of donor-derived cells from both WTCD45.1/WTCD45.2 and WTCD45.1/CD74−/− CD45.2 chimera. (G) Total BM cells; Data G in S5 Data (H) BM myeloid cells; Data H in S5 Data (I) BM immature B cells; Data I in S5 Data (J) LSK; Data J in S5 Data (K) CD34-/LSK; Data K in S5 Data (L) Mature BM B cells; Data L in S5 Data. n = 12. Bars show SEM. Unpaired two-tailed t test * p < 0.05; **p < 0.01; ***p < 0.001; ****p < 0.0001. (M–P) Survival curves for serial transplantation assay. BM from 6 donors from each genotype were transplanted to 4–5 lethally irradiated hosts. After 10–12 weeks, one mouse from each donor served as a donor for the subsequent transplant. Each host were transplanted with 2 × 10⁶ BM cells. Log-rank test *<0.05, n = 20–30 mice in each transplant per genotype. Data M–P in S5 Data.
Fig 6
Fig 6. Accumulation of HSPCs is not CXCR4 dependent.
(A, B) FACS analysis of CXCR4 expression on BM LSK and BM CD34-/LSK of WT and CD74−/− mice, n = 7, Data A in S6 Data. Representative histograms are shown. (C–E) FACS analysis for HSPCs in the PB of WT and CD74−/−. (C) Dot plot analysis of LSK in WT and CD74−/− mice. (D, E) Cell number of (D) LSK and (E) CD34-LSK in 600 μl blood. WT n = 6 CD74−/− n = 7, Data B and C in S6 Data. (F) AMD3100 (20 mg/kg−1) was injected to WT and CD74−/− mice. After 2 h, percent of LSK in the PB was analyzed; n = 9–11, Data D in S6 Data. (G–I) FACS staining of WT and CD74−/− HSPCs for Ki-67. Results are presented as: (G) percent of CD34-/LSK Ki-67 and CD34-/LSK Ki-67+ from total BM cells, Data E in S6 Data; (H) percent of CD34+/LSK Ki-67- and CD34+/LSK Ki-67+ from total BM cells, Data F in S6 Data; and (I) percent of Ki-67+ from CD34-/LSK and percent of Ki-67+ from CD34+LSK, n = 15, Data G in S6 Data. (J, K) Mice were fed with 0.8 mg/ml BrdU in their drinking water for 3 days, and BrdU incorporation was analyzed by FACS. Results are represented as: (J) percent of LSK BrdU- and LSK BrdU+ from total BM cells, Data H in S6 Data; (K) percent of BrdU+ in LSK; n = 12–14, Data I in S6 Data. Bars show SEM. Unpaired two-tailed t test: *p < 0.05; **p < 0.01; ***p < 0.001; ****p < 0.0001. The fcs files and gates can be found at the Flow Repository (accession number FR-FCM-Z3F2). BM, bone marrow; BrdU, bromodeoxyuridine; FACS, fluorescence-activated cell sorting; HSPC, hematopoietic stem and progenitor cell; PB, peripheral blood; WT, wild-type.
Fig 7
Fig 7. CD74 regulates the survival of HSPCs and CD18 expression.
(A, B) FACS staining of WT and CD74-deficient HSPCs for ROS. (A) Results are presented as the number of ROS high cells per 106 cells, n = 9, Data A in S7 Data. (B) Percentage of ROShigh in LSK, Data B in S7 Data. (C, D) Percent of LSK (C) Data C in S7 Data, and CD34- (D) after 6 days of NAC injections (50 mg kg−1); n = 5, Data D in S7 Data. (E, F) FACS analysis of HSPCs from WT and CD74−/− mice for Annexin V (E); n = 10–12, Data E in S7 Data, and after 24 h under hypoxic (F); n = 3 (each dot represents a duplicate determination), Data F in S7 Data. (G) Ratio of Annexin V+ CD74−/− to WT of HSPCs under hypoxic and normoxic conditions, Data G in S7 Data. (H, I) FACS analysis of HSCs from WT and CD74−/− mice for HIF-1α; n = 7–8, Data H in S7 Data. (J) Sorted WT and CD74−/− CD34-/LSK cells were analyzed for CD18 mRNA levels; n = 3. The bars show the DESeq2 normalized counts for the CD18 gene, Data I in S7 Data. (K) Binding of CD74–ICD to CD18 promoter and intron regions in Lin− samples. ChIP-seq analysis using anti-CD74 antibody. (L) FACS analysis of HSCs from WT and CD74−/− mice for CD18. Graph summarizes the results of 6 mice in each group, Data J in S7 Data. (M) FACS analysis of HSCs from WT and MIF−/− mice for CD18; n = 3, Data K in S7 Data. (N) WT and CD74−/− BM were cultured with or without the MIF inhibitor, ISO-1, for 48 h, percent CD18 on CD34-/LSK was analyzed by FACS; n = 6, Data L in S7 Data. (O) WT (CD45.1) Lin negative cells were cultured in the presence of WT (CD45.2) total BM or MIF−/− (CD45.2) total BM for 48 h. The percent CD18 on CD34-/LSK cells (CD45.1) was analyzed by FACS; n = 8, Data M in S7 Data. Bars show SEM. Unpaired two-tailed t test *p < 0.05; **p < 0.01; ***p < 0.001. The fcs files and gates can be found at the Flow Repository (accession number FR-FCM-Z3F2). BM, bone marrow; ChIP-seq, chromatin immunoprecipitation-sequencing; FACS, fluorescence-activated cell sorting; HIF-1α, hypoxia-inducible factor 1 alpha; HSC, hematopoietic stem cell; HSPC, hematopoietic stem and progenitor cell; MIF, migration inhibitory factor; NAC, N-acetyl-L-cysteine; ROS, reactive oxygen species; WT, wild-type.
Fig 8
Fig 8. CD74 can serve as a potential target for therapy.
(A, B) WT and CD74−/− BM cells were cultured alone or incubated with blocking anti-CD74 antibody (20, 50, and 100 μg/ml). After 48 h, percent LSK from live cells was analyzed by FACS; n = 4–7, Data A and B in S8 Data. (C, D) Survival curve: 5-FU (150 mg/kg and 125mg/kg) was injected to WT and CD74−/− mice once a week. Log-rank test *<0.05; n = 10 in each group, Data C and D in S8 Data. (G) Human CD34+ BM cells were stained for CD74 cell surface expression by FACS; n = 5. (H) Human BM were cultured with anti-CD74 (LN2) antibody or isotype control for 48 h, and percent of CD18 on human CD34+ cells was analyzed by FACS; n = 5, Data E in S8 Data. Bars show SEM. Unpaired two-tailed t test *p < 0.05; **p < 0.01; ***p < 0.001. The fcs files and gates can be found at the Flow Repository (accession number FR-FCM-Z3F2). 5-FU, 5-fluorouracil; BM, bone marrow; FACS, fluorescence-activated cell sorting; WT, wild-type.

References

    1. Ludin A, Gur-Cohen S, Golan K, Kaufmann KB, Itkin T, Medaglia C, et al.. Reactive oxygen species regulate hematopoietic stem cell self-renewal, migration and development, as well as their bone marrow microenvironment. Antioxid Redox Signal. 2014;21(11):1605–19. 10.1089/ars.2014.5941 - DOI - PMC - PubMed
    1. Morrison SJ, Scadden DT. The bone marrow niche for haematopoietic stem cells. Nature. 2014;505(7483):327–34. 10.1038/nature12984 - DOI - PMC - PubMed
    1. Boulais PE, Frenette PS. Making sense of hematopoietic stem cell niches. Blood. 2015;125(17):2621–9. 10.1182/blood-2014-09-570192 - DOI - PMC - PubMed
    1. Mendelson A, Frenette PS. Hematopoietic stem cell niche maintenance during homeostasis and regeneration. Nat Med. 2014;20(8):833–46. 10.1038/nm.3647 - DOI - PMC - PubMed
    1. Peled A, Petit I, Kollet O, Magid M, Ponomaryov T, Byk T, et al.. Dependence of human stem cell engraftment and repopulation of NOD/SCID mice on CXCR4. Science. 1999;283(5403):845–8. 10.1126/science.283.5403.845 - DOI - PubMed

Publication types

MeSH terms

Substances