. 2021 Mar 4;17(3):e1009358.
doi: 10.1371/journal.pgen.1009358. eCollection 2021 Mar.

Neuronal SKN-1B modulates nutritional signalling pathways and mitochondrial networks to control satiety

Affiliations

Neuronal SKN-1B modulates nutritional signalling pathways and mitochondrial networks to control satiety

Nikolaos Tataridas-Pallas et al. PLoS Genet. .

Abstract

The feeling of hunger or satiety results from integration of the sensory nervous system with other physiological and metabolic cues. This regulates food intake, maintains homeostasis and prevents disease. In C. elegans, chemosensory neurons sense food and relay information to the rest of the animal via hormones to control food-related behaviour and physiology. Here we identify a new component of this system, SKN-1B which acts as a central food-responsive node, ultimately controlling satiety and metabolic homeostasis. SKN-1B, an ortholog of mammalian NF-E2 related transcription factors (Nrfs), has previously been implicated with metabolism, respiration and the increased lifespan incurred by dietary restriction. Here we show that SKN-1B acts in two hypothalamus-like ASI neurons to sense food, communicate nutritional status to the organism, and control satiety and exploratory behaviours. This is achieved by SKN-1B modulating endocrine signalling pathways (IIS and TGF-β), and by promoting a robust mitochondrial network. Our data suggest a food-sensing and satiety role for mammalian Nrf proteins.


Conflict of interest statement

The authors declare that they have no conflict of interest.

Figures

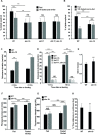
Fig 1
Fig 1. skn-1b is required for exploratory behaviour, but is not essential for DR longevity.
A) Effect of skn-1b on eat-2 lifespan. B) Survival of WT and skn-1b mutants in response to bacterial dilution as in [15]. For A and B: Representative experiments shown, individual trials summarised with Log-Rank analysis in S1 and S2 Tables. These DR protocols did not alter SKN-1B::GFP levels (S7B and S7C Fig). We use eat-2 as a DR longevity model as suggested [59], but recent work shows that eat-2 longevity also derives from reduced pathogenesis [60,61]. C. elegans derives nutrients from the bacteria and removing pathogenic components of bacteria will undoubtedly alter its nutritional profile but separating the two is challenging. C) Genetic locus of skn-1 with isoforms, mutants and SKN-B::GFP specific transgene. skn-1b mRNA is not detectable in tm4241 mutants but skn-1a and c mRNA levels are unchanged implying that this allele is skn-1b specific (S3A Fig). skn-1b mutants have normal brood sizes (S3B–S3E Fig). skn-1(zu67) and skn-1(zu135) encode point mutations leading to early stop codons and transcript degeneration via non-sense mediated decay. All skn-1 isoforms have the same binding site, and all Nrfs can bind the same sequence, suggesting the likelihood of overlapping targets. D) wuEx217 SKN-1B::GFP is expressed in ASI neurons. The SKN-1B::GFP translational reporter confirmed that SKN-1B::GFP can be expressed independently from other SKN-1 isoforms, that skn-1b is expressed solely in the ASIs. This expression pattern was confirmed with an endogenous Scarlet::SKN-1B reporter (S3F Fig). SKN-1B::GFP expression varies at different ages (S3G Fig). ASIs confirmed by DiI staining and SKN-1B::GFP was rarely observed in additional neurons (S3H Fig). E) Agar plates showing exploration of a single worm over 16hrs. Assay and controls shown (S4A and S4B Fig). F-H) Quantification of exploration. Mean plate coverage of n>11 worms per group ± st. dev. One representative experiment of 3 biological replicates shown. In F) SKN-1B was rescued using the ukcEx15 and ukcEx16 transgenes. In G) a 2hr period was used to allow quantification of hyperactive male exploration. I) Quantification of worms on different small bacterial lawns. Assay (S5A Fig). Each bar represents a mean of 3 biological replicates ± st. dev. For F-I) Two-tailed t-test *p<0.05, **p< 0.001, ***p<0.0001, NS not significant.
Fig 2
Fig 2. SKN-1B regulates satiety quiescence.
A) Quantification of exploration in fed vs fasted/re-fed conditions, worms fasted for 1hr. Mean plate coverage of n>35 individual worms per group ± st. dev., 3 combined experiments shown. B) Quantification of exploration in fed vs fasted/re-fed conditions, worms fasted for 16hrs. Mean plate coverage of n>7 worms per group ± st. dev., one representative experiment of 3 trials shown. C and D) Time spent in quiescence after fasting/re-feeding. Each bar represents a mean of 3 biological replicates ± SEM, n>40 worms per group. E) Worm volume. Each bar represents a mean of 3 biological replicates, ± st. dev., n>63 worms per group. F) Pharyngeal pumping rate. Each bar represents a mean of 3 biological replicates, ± st. dev., n = 7 worms per group. G) Effect of skn-1b on intake of fluorescently labelled OP50. Each bar represents a mean of 3 biological replicates, ± st. dev., n>42 worms per group. H) Automated measure of movement on a continuous lawn of OP50. Each bar represents a mean of 3 biological replicates, ± st. dev., n>54 worms per group. For A-H) Two-tailed t-test *p<0.05, **p< 0.001, ***p<0.0001, NS not significant.
Fig 3
Fig 3. SKN-1B::GFP levels respond to nutritional cues and require daf-11.
A-D) Quantitative fluorescence microscopy of SKN-1B::GFP in response to: A) different bacterial strains, B) being switched to PY79 at the L4 stage, C) 24hrs bacterial dilution [12], or C) 16hrs fasting. For D) a combination of daf-11 mutation and fasting was used. Similar results to those in C) had previously been observed using a SKN-1B/C::GFP transgene [12]. A-D) Imaged at 1 day adults, each bar is the mean of 3 biological replicates ± st. dev. Two-tailed t-test *p<0.05, ***p<0.0001, NS not significant.
Fig 4
Fig 4. SKN-1B modulates TGF-β signalling and controls satiety.
A) Time spent in quiescence after fasting and re-feeding. Each bar represents a mean of 3 biological replicates, ± SEM, n>9 worms per group. B and C) Fluorescence expression pattern, 20x magnification (B), and levels (C), of Pdaf-7::GFP in ASIs responds to skn-1b mutation and food cues. In (C) each bar represents a mean of 3 biological replicates ± st. dev., n>230 worms per group. NS difference was found between WT samples in fasted vs re-fed conditions and NS difference was found between skn-1b samples at any point. This regulation of daf-7 is unlikely to be direct as there is no SKN-1 binding site within 3Kb of its transcriptional start site. D) Quantification of exploration. Each bar is a mean of 5 biological replicates, n>44 worms per group ± st. dev. All trials shown in S8A–S8F Fig. E) Time spent in quiescence after fasting and re-feeding. Each bar represents a mean of 3 biological replicates, ± SEM, n>10 worms per group. For A, C, D and E: Two-tailed t-test *p<0.05, **p< 0.001, ***p<0.0001, NS not significant.
Fig 5
Fig 5. SKN-1B regulates IIS to control behaviour.
A) Quantification of nuclear localisation, WT and skn-1b worms expressing ges-1p::GFP::daf-16 [62], average grading shown. Grading system and total % of worms in each grade (S9 Fig). Combined data from 3 biological replicates shown ± SEM, n>48 worms per group. B) Quantification of exploration. One representative of 3 biological replicates shown ± st. dev., n>10 worms per group. C) Quantification of exploration in fed vs fasted and re-fed conditions. Worms fasted for 1hr. One representative of 3 biological replicates shown ± st. dev., n>35 worms per group. B and C) Similar findings were obtained using daf-2(e1368) (S11A and S11B Fig). D and E) Time spent in quiescence after fasting and re-feeding. Each bar represents a mean of 3 biological replicates ± SEM, total of n>36 worms per group. For C-E) Similar numbers of worms from each group were observed in quiescence (S6D–S6F Fig). For A-E: Two-tailed t-test *p<0.05, **p< 0.001, ***p<0.0001, NS = not significant.
Fig 6
Fig 6. skn-1b contributes to mitochondrial network integrity.
A-C) Expression and quantification of WT and skn-1b mutant worms expressing myo-3::GFP(mit). This muscle specific reporter expresses an outer mitochondrial membrane protein and hence marks all mitochondria, delineating their shape. In B and C) Each bar represents a mean of 3 biological replicates ± SEM, n>62 day 1 adults worms per group. The qualitative scoring system used in C) is shown in S12C Fig. D) Longitudinal sections imaged by Transmission Electron Microscopy (TEM). M = mitochondria, S = sarcomere. Scale bar = 500nm. E) Quantification of TEM: Mitochondrial area compared to WT control. Each bar represents a mean of 2 biological replicates, n>47 images per group ± SEM. F-G) Effect of mitochondrial fission and fusion on mitochondrial networks and behaviour in WT and skn-1b mutants. Controls for effectiveness of RNAi (S14A and S14B Fig). For all graphs: Two-tailed t-tests *p<0.05, **p< 0.001, ***p<0.0001, NS not significant.
Fig 7
Fig 7. SKN-1B integrates with key nutritional signalling pathways, and regulates mitochondrial networks to control satiety-related behaviour.
Food-related behaviour is controlled by interactions between food cues, SKN-1B, downstream signalling pathways (cGMP, TGF-β and IIS), and mitochondria. SKN-1B receives food cues via cGMP signalling (DAF-11). In response to fasting and re-feeding SKN-1B controls satiety quiescence: SKN-1B suppresses daf-7 expression in the ASIs, downregulating TGF-β signalling and suppressing quiescence (Fig 4A–4C). Fasting also induces DAF-16 nuclear localisation which is maintained after re-feeding to promote quiescence: SKN-1B is required for this response, possibly by acting upstream of both pathways (Fig 5A–5E) [6,7]. In parallel, SKN-1B is also acts to control food-related behaviour by maintaining mitochondrial networks. Overall, this study identifies neuronal SKN-1B as a novel factor in controlling satiety behaviour in response to dietary signals.

References

    1. McFarland DJ. Decision making by animals. Nature. 1977. citeulike-article-id:3179069
    1. Bouret SG. Development of hypothalamic circuits that control food intake and energy balance. Appetite and Food Intake: Central Control, Second Edition. 2017. 10.1201/9781315120171-7 - DOI - PubMed
    1. Bargmann C. Chemosensation in C. elegans. WormBook. 2006. 10.1895/wormbook.1.123.1 - DOI - PMC - PubMed
    1. Ben Arous J, Laffont S, Chatenay D. Molecular and sensory basis of a food related two-state behavior in C. elegans. PLoS One. 2009. 10.1371/journal.pone.0007584 - DOI - PMC - PubMed
    1. You Y jai, Kim J, Raizen DM, Avery L. Insulin, cGMP, and TGF-β Signals Regulate Food Intake and Quiescence in C. elegans: A Model for Satiety. Cell Metab. 2008. 10.1016/j.cmet.2008.01.005 - DOI - PMC - PubMed

Publication types

MeSH terms

Substances

LinkOut - more resources