. 2021 Mar 4;18(3):e1003542.
doi: 10.1371/journal.pmed.1003542. eCollection 2021 Mar.

Probabilistic seasonal dengue forecasting in Vietnam: A modelling study using superensembles

Affiliations

Probabilistic seasonal dengue forecasting in Vietnam: A modelling study using superensembles

Felipe J Colón-González et al. PLoS Med. .

Abstract

Background: With enough advanced notice, dengue outbreaks can be mitigated. As a climate-sensitive disease, environmental conditions and past patterns of dengue can be used to make predictions about future outbreak risk. These predictions improve public health planning and decision-making to ultimately reduce the burden of disease. Past approaches to dengue forecasting have used seasonal climate forecasts, but the predictive ability of a system using different lead times in a year-round prediction system has been seldom explored. Moreover, the transition from theoretical to operational systems integrated with disease control activities is rare.

Methods and findings: We introduce an operational seasonal dengue forecasting system for Vietnam where Earth observations, seasonal climate forecasts, and lagged dengue cases are used to drive a superensemble of probabilistic dengue models to predict dengue risk up to 6 months ahead. Bayesian spatiotemporal models were fit to 19 years (2002-2020) of dengue data at the province level across Vietnam. A superensemble of these models then makes probabilistic predictions of dengue incidence at various future time points aligned with key Vietnamese decision and planning deadlines. We demonstrate that the superensemble generates more accurate predictions of dengue incidence than the individual models it incorporates across a suite of time horizons and transmission settings. Using historical data, the superensemble made slightly more accurate predictions (continuous rank probability score [CRPS] = 66.8, 95% CI 60.6-148.0) than a baseline model which forecasts the same incidence rate every month (CRPS = 79.4, 95% CI 78.5-80.5) at lead times of 1 to 3 months, albeit with larger uncertainty. The outbreak detection capability of the superensemble was considerably larger (69%) than that of the baseline model (54.5%). Predictions were most accurate in southern Vietnam, an area that experiences semi-regular seasonal dengue transmission. The system also demonstrated added value across multiple areas compared to previous practice of not using a forecast. We use the system to make a prospective prediction for dengue incidence in Vietnam for the period May to October 2020. Prospective predictions made with the superensemble were slightly more accurate (CRPS = 110, 95% CI 102-575) than those made with the baseline model (CRPS = 125, 95% CI 120-168) but had larger uncertainty. Finally, we propose a framework for the evaluation of probabilistic predictions. Despite the demonstrated value of our forecasting system, the approach is limited by the consistency of the dengue case data, as well as the lack of publicly available, continuous, and long-term data sets on mosquito control efforts and serotype-specific case data.

Conclusions: This study shows that by combining detailed Earth observation data, seasonal climate forecasts, and state-of-the-art models, dengue outbreaks can be predicted across a broad range of settings, with enough lead time to meaningfully inform dengue control. While our system omits some important variables not currently available at a subnational scale, the majority of past outbreaks could be predicted up to 3 months ahead. Over the next 2 years, the system will be prospectively evaluated and, if successful, potentially extended to other areas and other climate-sensitive disease systems.


Conflict of interest statement

The authors have declared that no competing interests exist.

Figures

Fig 1
Fig 1. Verification metrics by lead time.
Variation across all lead times averaged across the whole of Vietnam for (A) the CRPS, (B) the CRPSS, (C) the bias of the forecasts, and (D) the sharpness of the forecasts. Red lines indicate the performance of the model superensemble; blue lines depict the metrics for each of the 5 competing models; and grey lines indicate the behaviour of the baseline model. CRPS and sharpness assume values between 0 and infinity, with 0 representing a perfect forecast. Bias assumes values between −1 and 1, with 0 representing unbiased forecasts. CRPS, continuous rank probability score; CRPSS, continuous rank probability skill score.
Fig 2
Fig 2. Verification metrics by month of the year.
Variation across the months of the year averaged across the whole of Vietnam for (A) the CRPS, (B) the CRPSS, (C) the bias of the forecasts, and (D) the sharpness of the forecasts. Red lines indicate the performance of the model superensemble; blue lines depict the metrics for each of the 5 competing models; and grey lines indicate the behaviour of the baseline model. CRPS and sharpness assume values between 0 and infinity with an ideal value of 0. Bias assumes values between −1 and 1, with 0 as ideal. CRPS, continuous rank probability score; CRPSS, continuous rank probability skill score.
Fig 3
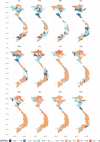
Fig 3. Predictive ability across time and space.
Spatiotemporal variation of the CRPSS of the model superensemble. Orange shaded areas indicate a better performance of the superensemble compared to a baseline model. Blue areas indicate a lower performance of the superensemble compared to a baseline model. The shapefile used to create this figure was obtained from DIVA-gis (https://www.diva-gis.org). CRPSS, continuous rank probability skill score.
Fig 4
Fig 4. Temporal variation of the Brier score.
Temporal variation of the Brier score averaged across all 63 Vietnamese provinces stratified by (A) lead time and (B) month of the year. The red lines indicate variation in the Brier score using percentile-related moving outbreak thresholds. The blue lines indicate variation in the Brier score using the endemic channel–related thresholds. The Brier scores assume values between 0 and 1, with 0 as ideal.
Fig 5
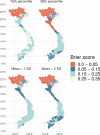
Fig 5. Spatial variation in the Brier score.
Spatial variation of the mean Brier score averaged across all lead times calculated for 4 different moving outbreak thresholds over the period January 2007 to December 2016 and for each of the 63 Vietnamese provinces. Lower Brier scores (in orange) indicate a greater accuracy for detecting outbreaks. The Brier scores assume values between 0 and 1, with 0 as ideal. The shapefile used to create this figure was obtained from DIVA-gis (https://www.diva-gis.org).
Fig 6
Fig 6. Signal detection analysis.
Proportion of hits (dark orange), correct rejections (light orange), false alarms (light blue), and missed outbreaks (dark blue) for the baseline model and the model superensemble. Similar results were obtained at all lead times.
Fig 7
Fig 7. Portraying prospective predictions.
Predicted dengue incidence rate for the period May to October 2020 for the Vietnamese province of Dong Nai using a model superensemble. The forecast was issued on May 10, 2020. The x axis indicates the time lead of the predictions. The y axis indicates the predicted dengue incidence rate. Solid black lines indicate the posterior mean estimate for each of the 42 forecast ensemble members. Red lines indicate the observed dengue incidence rate which was not known by the model at the time of the computation. The black dashed lines indicate the upper and lower bounds of the 95% credible intervals for each of the 42 ensemble members. The upper bound of the shaded areas indicate the month-specific risk based on the endemic channel plus 2 standard deviations calculated with historical data from the previous 5 years.
Fig 8
Fig 8. Risk maps.
(A) Spatial distribution of the posterior mean of the predicted number of dengue cases 1 month ahead for a forecast initialised on May 10, 2020. (B) Spatial distribution of the probability of exceeding an outbreak threshold based on the 95th percentile. The shapefile used to create this figure was obtained from DIVA-gis (https://www.diva-gis.org).
Fig 9
Fig 9. Spatial variation of the relative value of the forecasts.
Spatial variation of the relative value of the forecasts generated by the model superensemble 1 to 6 months ahead. Orange shaded areas indicate provinces where there is relative value (based on a range of theoretical cost–loss ratios and outbreak thresholds). Blue shaded areas indicate provinces where the superensemble had no relative value. The shapefile used to create this figure was obtained from DIVA-gis (https://www.diva-gis.org).

References

    1. Powell J, Tabachnick W. History of domestication and spread of Aedes aegypti—a review. Mem Inst Oswaldo Cruz. 2013;108:11–7. 10.1590/0074-0276130395 - DOI - PMC - PubMed
    1. Li Y, Kamara F, Zhou G, Puthiyakunnon S, Li C, Zhoi Y, et al.. Urbanization increases Aedes albopictus larval habitats and accelerates mosquito development and survivorship. PLoS Negl Trop Dis. 2014;8:e3301. 10.1371/journal.pntd.0003301 - DOI - PMC - PubMed
    1. Kraemer MU, Sinka ME, Duda KA, Mylne AQ, Shearer FM, Barker CM, et al.. The global distribution of the arbovirus vectors Aedes aegypti and Ae. albopictus. Elife. 2015;4:e08347. 10.7554/eLife.08347 - DOI - PMC - PubMed
    1. Brady O, Gething P, Bhatt S, Messina J, Brownstein J, Hoen A, et al.. Refining the Global Spatial Limits of Dengue Virus Transmission by Evidence-Based Consensus. PLoS Negl Trop Dis. 2012;6(8):e1760. 10.1371/journal.pntd.0001760 - DOI - PMC - PubMed
    1. Bhatt S, Gething P, Brady O, Messina J, Farlow A, Moyes C, et al.. The global distribution and burden of dengue. Nature. 2013;496(7446):504–7. 10.1038/nature12060 - DOI - PMC - PubMed

Publication types