. 2021 Mar 4;16(3):e0247372.
doi: 10.1371/journal.pone.0247372. eCollection 2021.

Mast cells contribute to alveolar bone loss in Spontaneously Hypertensive Rats with periodontal disease regulating cytokines production

Affiliations

Mast cells contribute to alveolar bone loss in Spontaneously Hypertensive Rats with periodontal disease regulating cytokines production

Victor Gustavo Balera Brito et al. PLoS One. .

Abstract

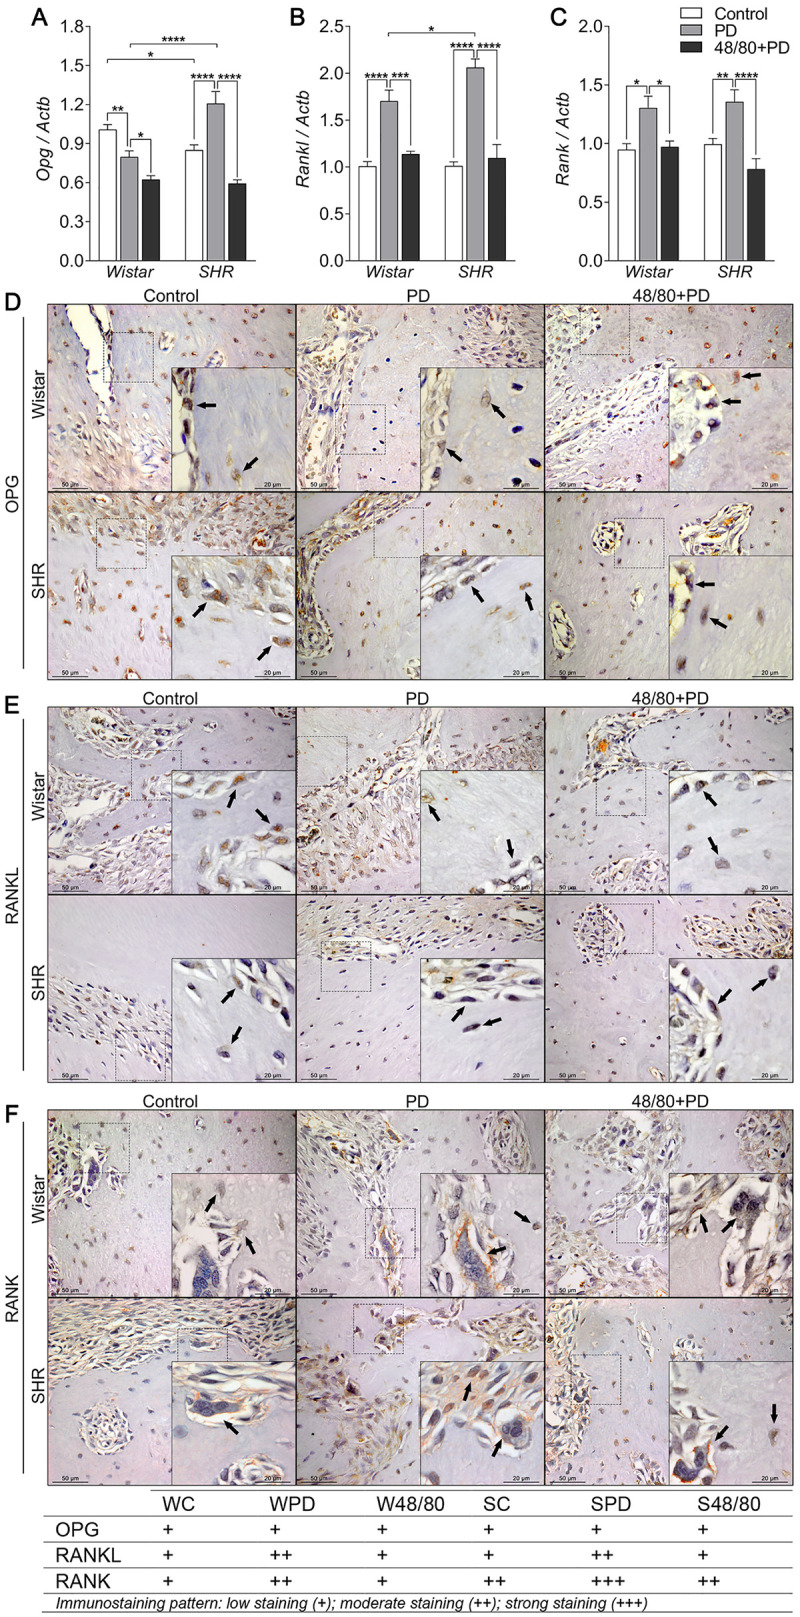
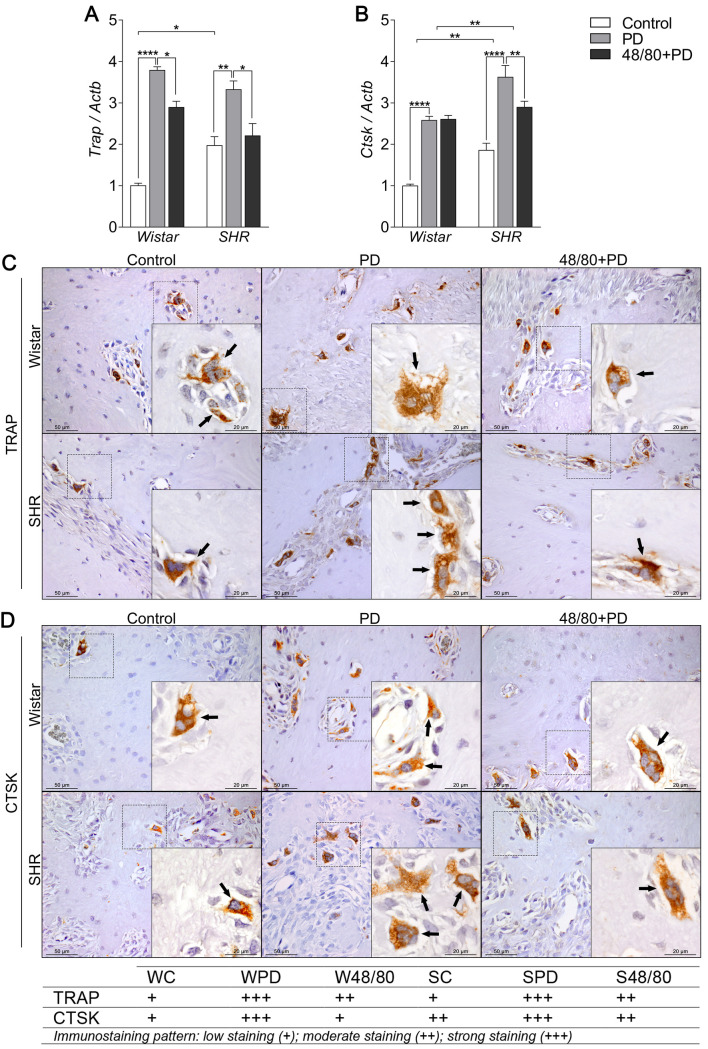
Mast cells (MCs) play a pivotal role in inflammatory responses and had been studied in inflammatory bone disorders, however, their role in alveolar bone loss induced by periodontal disease (PD) is not yet fully understood. We, therefore, aimed to evaluate the effects of MCs depletion in the PD-induced alveolar bone loss in Wistar (W) and Spontaneously Hypertensive Rats (SHRs). PD was induced by ligating the lower first molars with silk thread one day after the MCs depletion, by the pre-treatment with compound 48/80 for 4 days. After 15 days of PD induction, the hemi-mandibles were surgically collected for qRT-PCR, histological analyses, immunostaining, and ELISA. Systolic blood pressure (SBP) was verified by tail plethysmography to confirm the hypertensive status, and SHR presented SBP >150 mmHg, and previous MC depletion alone or associated with PD did not alter this parameter. SHRs showed a more severe alveolar bone loss compared to W, and MC depletion significantly inhibited this response in both strains, with a more significant response in SHRs. MCs were less abundant in 48/80+PD groups, thus validating the previous MCs depletion in our model. PD increased the number of MC in the gingival tissue of SHR. Cytokine production (TNF-α, IL-6, IL-1β, and CXCL3) was constitutively higher in SHR and increased further after PD, which was also significantly reduced in the MCs-depleted animals. PD led to an increased expression of Opn, Rankl, Rank, Vtn, Itga5, Itgb5, Trap, and Ctsk in the mandible of W and SHRs, which was reversed in MCs-depleted animals. These results suggest that MCs significantly contributes to the PD-induced alveolar bone resorption, especially in the SHR, which is associated with a more severe PD progression compared to Wistar, partly explained by these cells contribution to the inflammatory status and mediator production, stimulating osteoclast-related response markers, which were reduced after MC depletion in our experimental model.


Conflict of interest statement

The authors have declared that no competing interests exist.

Figures

Fig 1
Fig 1. Mast cell count in the gingival tissue of Wistar and SHR with PD, depleted from mast cells (48/80+PD).
(A) Representative images of toluidine blue stained gingival section. The black arrows indicate mast cells (purple-stained cells). (B) Graph shows mean ± SEM (n = 5) of mast cell count per mm2, and statistical differences are represented by brackets labeled by *p<0.05, **p<0.01, ***p<0.001, and ****p<0.0001. Microtomography analysis of mandible of Wistar and SHR with PD, depleted from mast cells (48/80+PD). (C) Mandible three-dimensional reconstruction in lingual view with sagittal cut detail, (D) Volume rendering of the analyzed region (first molar teeth in white and surrounding alveolar bone in brown), and graphs showing (E) %BV/TV, (F) Tb.Nb, (G) Tb.Th, and (H) Tb.Sp as mean ± SEM (n = 5). Statistical differences are represented by brackets labeled by * p<0.05, ** p<0.01, *** p<0.001, and **** p<0.0001.
Fig 2
Fig 2. Inflammatory status in mandibles of Wistar and SHR with PD 15d, depleted of mast cells (48/80+PD).
qRT-PCR for (A) Tnfa, (B) Il6, and (C) Il1b, and ELISA for (D) TNF-α, (E) IL-6, (F) IL-1β, (G) CXCL3 and (H) CCL20. Graphs shown mean ± SEM (n = 6), and statistical difference are represented by brackets labeled by * p<0.05, ** p<0.01, *** p<0.001, and **** p<0.0001. (I-N) H&E staining of the first mandibular molar, in the furcation region, image board shows representative images from each experimental group (n = 5).
Fig 3
Fig 3. Transcription factors expression in mandibles of Wistar and SHR with PD, depleted of mast cells (48/80+PD).
qRT-PCR for (A) Runx2, (B) Osterix, (C) Catnb, (D) immunostaining for (D) RUNX2, (E) OSTERIX, and (F) CTNNB. Graphs shown mean ± SEM (n = 6), and statistical difference are represented by brackets labeled by * p<0.05, ** p<0.01, *** p<0.001, and **** p<0.0001. The image boards show representative images from each experimental group (n = 5), and tables describe the average immunostained pattern of each target.
Fig 4
Fig 4. Bone formation markers expression in mandibles of Wistar and SHR with PD, depleted of mast cells (48/80+PD).
qRT-PCR for (A) Alp, (B) Bmp2, (C) Col1a1, (D) Opn, (E) Ocn, and (F) Bsp, and immunostaining for (G) COL1A1, and (H) OPN. Graphs shown mean ± SEM (n = 6), and statistical difference are represented by brackets labeled by * p<0.05, ** p<0.01, *** p<0.001, and **** p<0.0001. The image boards show representative images from each experimental group (n = 5), and tables describe the average immunostained pattern of each target.
Fig 5
Fig 5. Opg, Rankl and Rank axis in mandibles of Wistar and SHR with PD, depleted of mast cells (48/80+PD).
qRT-PCR for (A) Opg, (B) Rankl, (C) Rank, and immunostaining for (D) OPG, (E) RANKL, and (F) RANK. Graphs shown mean ± SEM (n = 6), and statistical difference are represented by brackets labeled by * p<0.05, ** p<0.01, *** p<0.001, and **** p<0.0001. The image boards show representative images from each experimental group (n = 5), and tables describe the average immunostained pattern of each target.
Fig 6
Fig 6. Osteoclast recruitment and activation markers expression in mandibles of Wistar and SHR with PD, depleted of mast cells (48/80+PD).
qRT-PCR for (A) Oscar, (B) Vtn, (C) Itga5, (D) Itgb5, and immunostaining for (E) VTN, and (F) ITGαVβ3. Graphs shown mean ± SEM (n = 6), and statistical difference are represented by brackets labeled by * p<0.05, ** p<0.01, *** p<0.001, and **** p<0.0001. The image boards show representative images from each experimental group (n = 5), and tables describe the average immunostained pattern of each target.
Fig 7
Fig 7. Organic matrix degradation markers expression in mandibles of Wistar and SHR with PD, depleted of mast cells (48/80+PD).
qRT-PCR for (A) Mmp2 and (B) Mmp9, and immunostaining for (C) MMP2, and (D) MMP9. Graphs shown mean ± SEM (n = 6), and statistical difference are represented by brackets labeled by * p<0.05, ** p<0.01, *** p<0.001, and **** p<0.0001. The image boards show representative images from each experimental group (n = 5), and tables describe the average immunostained pattern of each target.
Fig 8
Fig 8. Osteoclast function markers expression in mandibles of Wistar and SHR with PD, depleted of mast cells (48/80+PD).
qRT-PCR for (A) Trap and (B) Ctsk, and immunostaining for (C) TRAP, and (D) CTSK. Graphs shown mean ± SEM (n = 6), and statistical difference are represented by brackets labeled by * p<0.05, ** p<0.01, *** p<0.001, and **** p<0.0001. The image boards show representative images from each experimental group (n = 5), and tables describe the average immunostained pattern of each target.

References

    1. Kinane DF, Stathopoulou PG, Papapanou PN. Periodontal diseases. Nat Rev Dis Primers. 2017;3:17038. Epub 2017/08/15. 10.1038/nrdp.2017.38 . - DOI - PubMed
    1. Pihlstrom BL, Michalowicz BS, Johnson NW. Periodontal diseases. Lancet. 2005;366(9499):1809–20. 10.1016/S0140-6736(05)67728-8 . - DOI - PubMed
    1. Kulkarni C, Kinane DF. Host response in aggressive periodontitis. Periodontology 2000. 2014;65(1):79–91. 10.1111/prd.12017 . - DOI - PubMed
    1. Cekici A, Kantarci A, Hasturk H, Van Dyke TE. Inflammatory and immune pathways in the pathogenesis of periodontal disease. Periodontology 2000. 2014;64(1):57–80. 10.1111/prd.12002 - DOI - PMC - PubMed
    1. Tsioufis C, Kasiakogias A, Thomopoulos C, Stefanadis C. Periodontitis and blood pressure: the concept of dental hypertension. Atherosclerosis. 2011;219(1):1–9. Epub 2011/06/07. 10.1016/j.atherosclerosis.2011.04.030 . - DOI - PubMed

Publication types