. 2021 Mar 4;17(3):e1009411.
doi: 10.1371/journal.pgen.1009411. eCollection 2021 Mar.

Deleterious mutation accumulation and the long-term fate of chromosomal inversions

Affiliations

Deleterious mutation accumulation and the long-term fate of chromosomal inversions

Emma L Berdan et al. PLoS Genet. .

Abstract

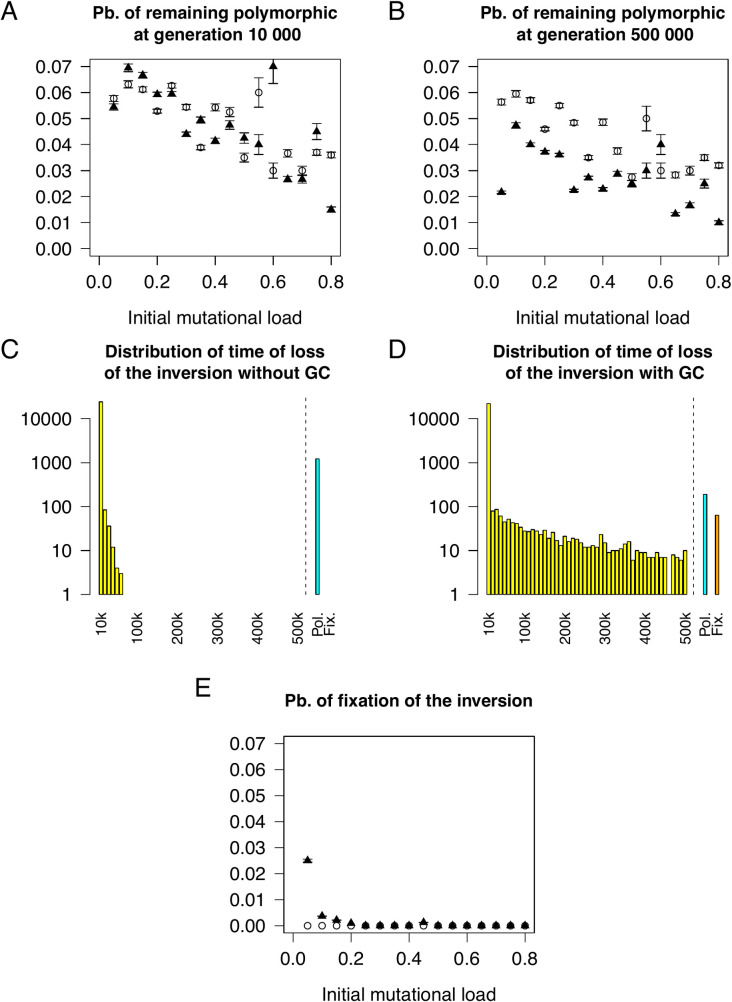
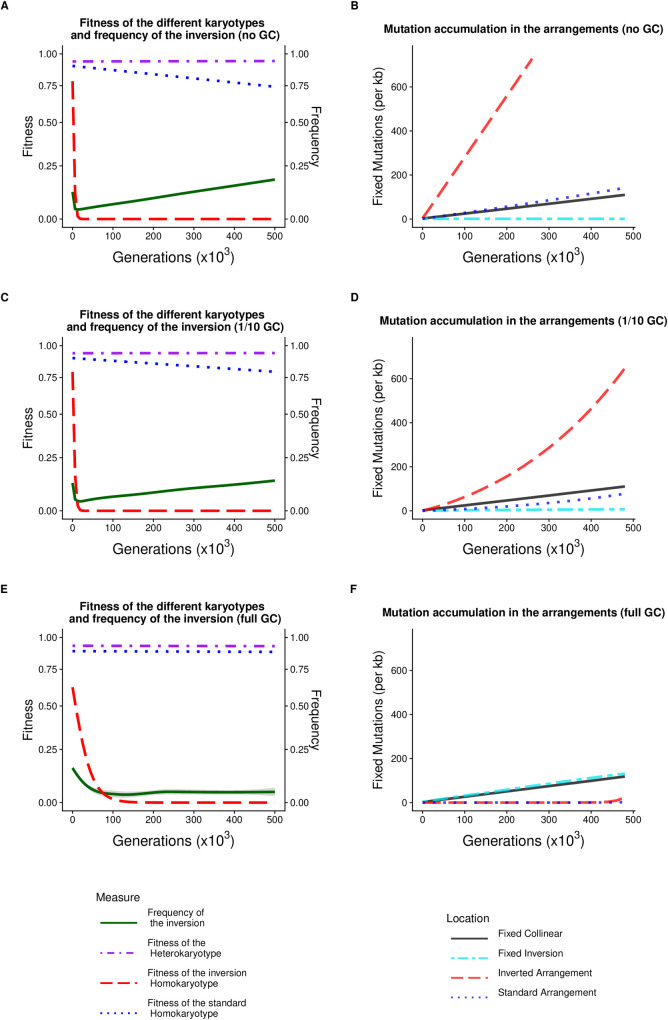
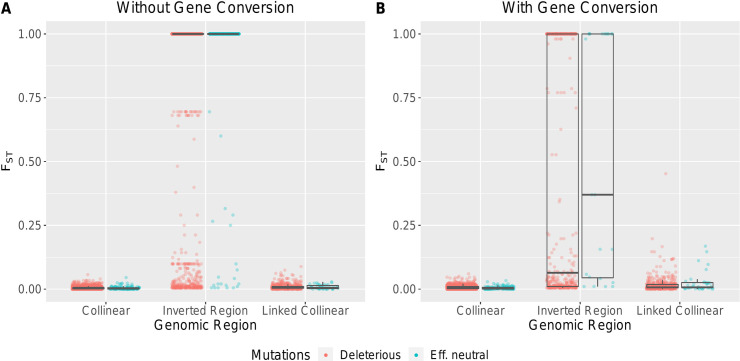
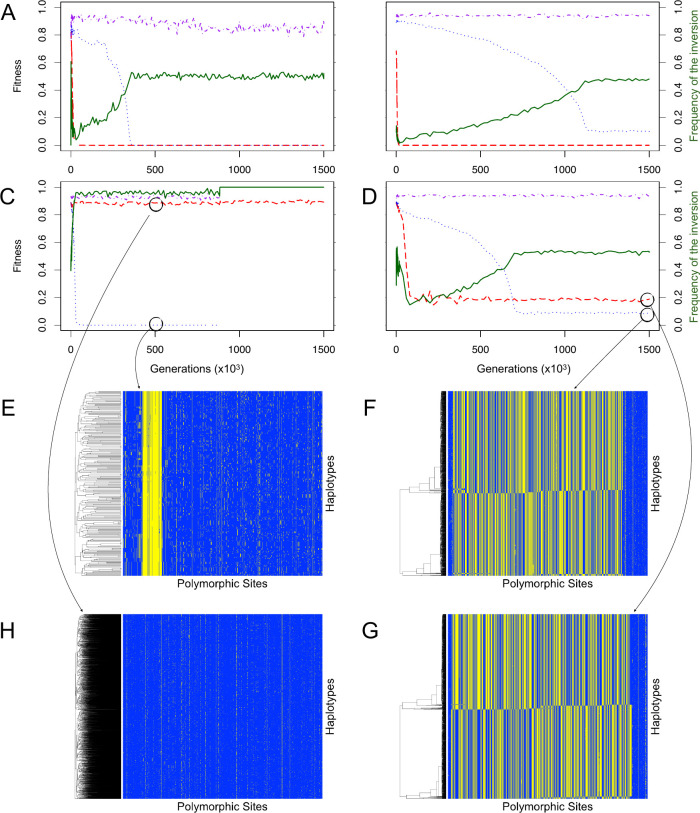
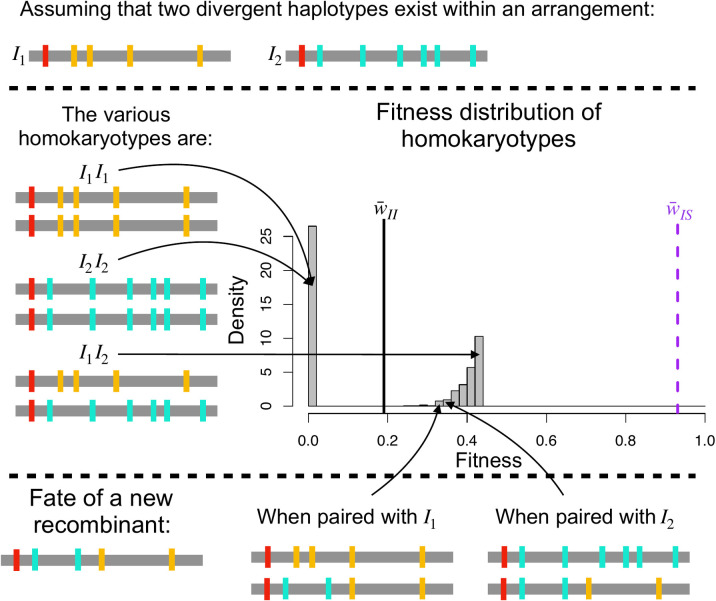
Chromosomal inversions contribute widely to adaptation and speciation, yet they present a unique evolutionary puzzle as both their allelic content and frequency evolve in a feedback loop. In this simulation study, we quantified the role of the allelic content in determining the long-term fate of the inversion. Recessive deleterious mutations accumulated on both arrangements with most of them being private to a given arrangement. This led to increasing overdominance, allowing for the maintenance of the inversion polymorphism and generating strong non-adaptive divergence between arrangements. The accumulation of mutations was mitigated by gene conversion but nevertheless led to the fitness decline of at least one homokaryotype under all considered conditions. Surprisingly, this fitness degradation could be permanently halted by the branching of an arrangement into multiple highly divergent haplotypes. Our results highlight the dynamic features of inversions by showing how the non-adaptive evolution of allelic content can play a major role in the fate of the inversion.


Conflict of interest statement

The authors have declared that no competing interests exist.

Figures

Fig 1
Fig 1. Gene conversion increases the probability that an inversion is fixed or lost.
(A) Probability of the inversion being polymorphic at generation 10,000 as a function of the mutational load in the presence (filled) and absence of GC (empty). (B) Probability of the inversion remaining polymorphic at generation 500,000 as a function of the mutational load in the presence (filled) and absence of GC (empty). (C) Distribution of the time of loss of the inversion in the presence of GC. Simulations where the inversion remained polymorphic (cyan) or fixed (orange) are indicated specifically. (D) Distribution of the time of loss of the inversion in the absence of GC. Simulations where the inversion remained polymorphic (cyan) or fixed (orange) are indicated specifically. (E) Probability of fixation of the inversion as a function of the mutational load in the presence (filled) and absence of GC (empty).
Fig 2
Fig 2
Fitness decay of the homokaryotypes and accumulation of mutations in the different arrangements (A,C,E). Fitness of the different karyotypes for the inversion and frequency (green) of the inversion over 500,000 generations (starting at generation 200 after introduction) following the introduction of the inversion under (A) a scenario with no gene conversion, (C) a scenario with 1/10 of the D. melanogaster gene conversion rate, and (E) a scenario with the D. melanogaster gene conversion rate. (B,D,F) Corresponding cumulative distribution of fixed mutations per kb in the inverted arrangement (red), the standard arrangement (blue), the inverted region (turquoise), and in the collinear region (black) depending on the generation when the mutation appears. Results were obtained from 1,000 replicates where we only display successful maintenance of the inversion polymorphism (5 cases with a high rate of GC, 60 cases with 1/10 of the previously used GC rate GC, and 61 cases without GC).
Fig 3
Fig 3. Divergence between karyotypes in the collinear, inverted, and linked regions.
Linked regions are on the same chromosome as the inverted region but not within it. Each dot represents a single SNP and the color represents whether (blue) or not (red) it is effectively neutral. Boxplots are overlain in gray. (A). FST without gene conversion, (B). FST with gene conversion. Data for A and B was obtained from a single run of an average fitness haplotype (with and without gene conversion) subsampled to 100 random haplotypes per arrangement.
Fig 4
Fig 4
Different evolutionary outcomes (A-D) and allelic content of the arrangements (E-H). (A-D) represent the fitness of the different karyotypes as well as the frequency of the inversion for all 4 outcomes. Fitness of the standard homokaryotype is given by the dotted blue line, of the inverted homokaryotype by the red dashed line and of the heterokaryotype by the dash-dotted purple line. The frequency of the inversion is given by the solid green line. A) Balanced lethals, B) inverted homokaryotypic is inviable, standard homokaryotype remains viable through haplotype structuring: C) inverted homokaryotype is viable, standard homokaryotype is inviable until the inversion fixes, D) haplotype structuring in both the inverted and standard arrangements. (E-H) Allelic content of the inversion, each horizontal line represents a haplotype in the population and each vertical line represents a genomic locus. Yellow denotes that an individual possesses the derived allele and blue the ancestral one. The black circle indicates where the haplotypes were taken from. E) Mutation accumulation in the minor arrangement, F) haplotype structuring in the standard arrangement, G) purifying selection in the majority arrangement, H) haplotype structuring in the inverted arrangement.
Fig 5
Fig 5. Schematic representation of the consequences of haplotype structuring on the fitness distribution of the homokaryotypes.
Red, cyan, and mustard represent deleterious mutations. Homokaryotypic homozygotes have a fitness near 0 while homokaryotypic heterozygotes have a positive fitness, as only the mutations that are fixed in the arrangements (in red) are expressed, while the mutations unique to each haplotype (in mustard and cyan) are masked. This leads to the bimodal distribution of fitness illustrated here. For reference the vertical lines correspond to the mean fitness of heterokaryotypes (dashed purple) and homokaryotypes (black line). Haplotype structuring is stable against recombination as the new recombinant will express both mustard and cyan mutations, leading to a lower fitness, whenever it is associated with either of the two major haplotypes.

References

    1. Dobigny G, Britton-Davidian J, Robinson TJ. Chromosomal polymorphism in mammals: An evolutionary perspective. Biol Rev. 2015;92(1):1–21. 10.1111/brv.12213 WOS:000391937700001. - DOI - PubMed
    1. Feuk L, MacDonald JR, Tang T, Carson AR, Li M, Rao G, et al.. Discovery of human inversion polymorphisms by comparative analysis of human and chimpanzee DNA sequence assemblies. Plos Genet. 2005;1(4):489–98. 10.1371/journal.pgen.0010056 WOS:000234714800009. - DOI - PMC - PubMed
    1. Kirkpatrick M. How and why chromosome inversions evolve. Plos Biol. 2010;8(9). 10.1371/journal.pbio.1000501 - DOI - PMC - PubMed
    1. Ayala D, Guerrero RF, Kirkpatrick M. Reproductive isolation and local adaptation quantified for a chromosome inversion in a malaria mosquito. Evolution. 2013;67(4):946–58. 10.1111/j.1558-5646.2012.01836.x - DOI - PubMed
    1. Lowry DB, Willis JH. A widespread chromosomal inversion polymorphism contributes to a major life-history transition, local adaptation, and reproductive isolation. Plos Biol. 2010;8(9). 10.1371/journal.pbio.1000500 WOS:000282279200019. - DOI - PMC - PubMed

Publication types