. 2021 Jun 17;28(6):835-847.e5.
doi: 10.1016/j.chembiol.2021.02.006. Epub 2021 Mar 3.

A small-molecule inhibitor of the BRCA2-RAD51 interaction modulates RAD51 assembly and potentiates DNA damage-induced cell death

Affiliations

A small-molecule inhibitor of the BRCA2-RAD51 interaction modulates RAD51 assembly and potentiates DNA damage-induced cell death

Duncan E Scott et al. Cell Chem Biol. .

Abstract

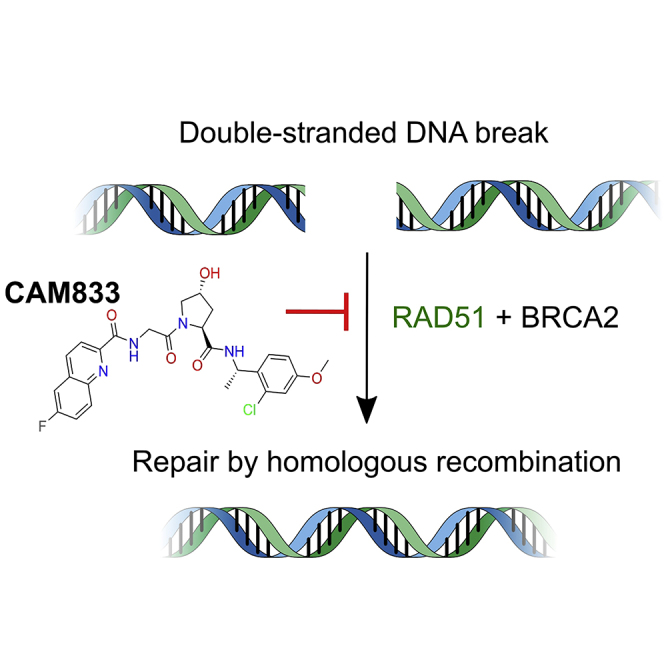
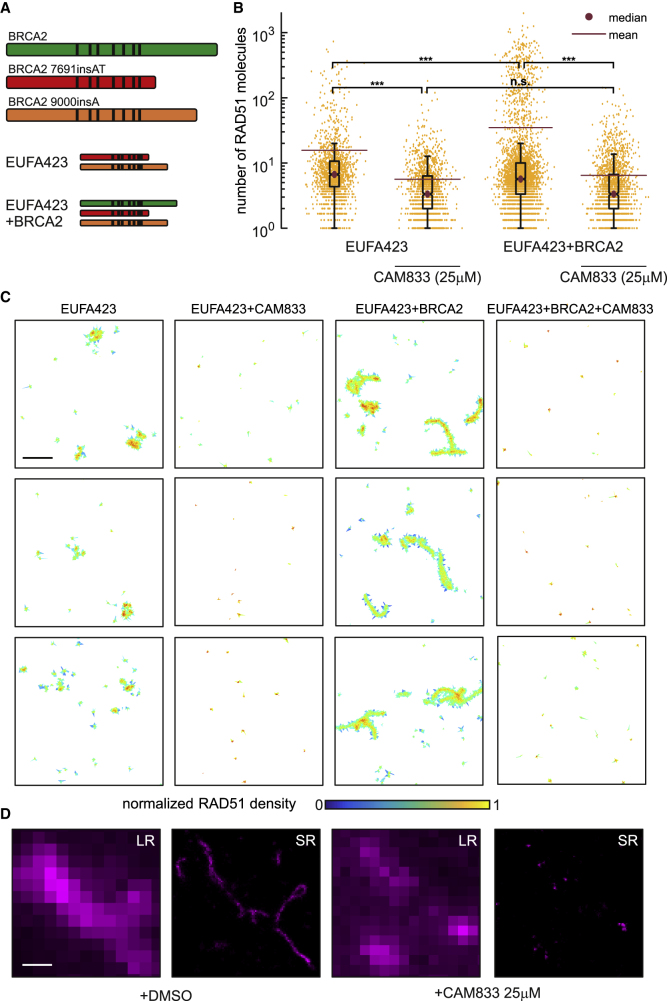
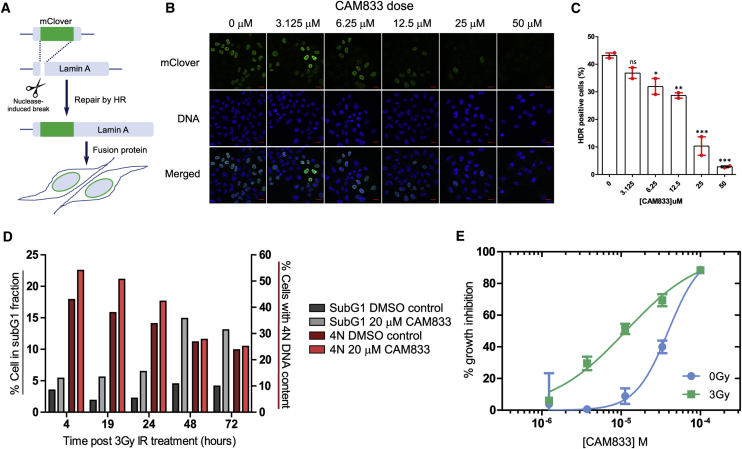
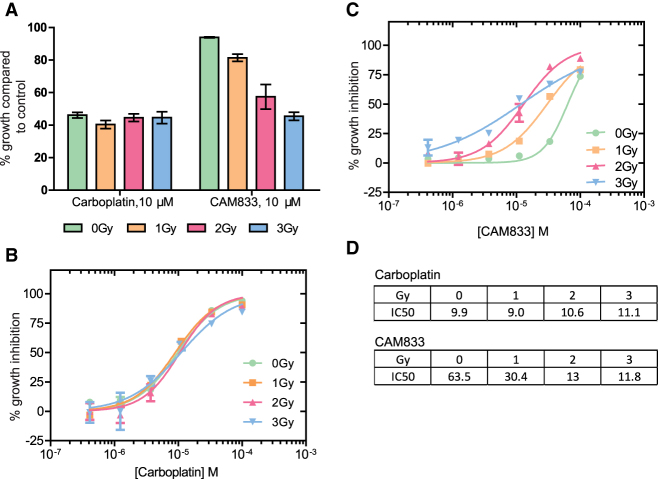
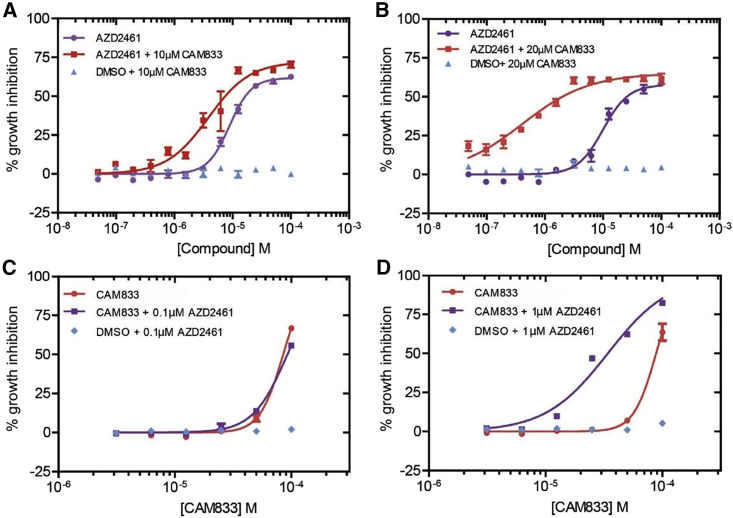
BRCA2 controls RAD51 recombinase during homologous DNA recombination (HDR) through eight evolutionarily conserved BRC repeats, which individually engage RAD51 via the motif Phe-x-x-Ala. Using structure-guided molecular design, templated on a monomeric thermostable chimera between human RAD51 and archaeal RadA, we identify CAM833, a 529 Da orthosteric inhibitor of RAD51:BRC with a Kd of 366 nM. The quinoline of CAM833 occupies a hotspot, the Phe-binding pocket on RAD51 and the methyl of the substituted α-methylbenzyl group occupies the Ala-binding pocket. In cells, CAM833 diminishes formation of damage-induced RAD51 nuclear foci; inhibits RAD51 molecular clustering, suppressing extended RAD51 filament assembly; potentiates cytotoxicity by ionizing radiation, augmenting 4N cell-cycle arrest and apoptotic cell death and works with poly-ADP ribose polymerase (PARP)1 inhibitors to suppress growth in BRCA2-wildtype cells. Thus, chemical inhibition of the protein-protein interaction between BRCA2 and RAD51 disrupts HDR and potentiates DNA damage-induced cell death, with implications for cancer therapy.

Keywords: BRCA2; DNA repair; RAD51; RAD51 inhibitor; cancer therapy; homologous recombination; protein-protein interaction inhibition; radiosensitizer; structure-guided drug discovery.


Conflict of interest statement

Declaration of interests Venkitaraman, Pellegrini, Blundell et al., WO2004035621 - Use of crystal structure of human RAD51-BRCA2 repeat complex in screening for anti tumor agents.

Figures

None
Graphical abstract
Figure 1
Figure 1
RAD51 interaction with BRC4 (A) Structure of RAD51 ATPase domain (surface) with BRC4 repeat of BRCA2 with FxxA binding motif colored green and the LFDE-motif in blue (PDB: 1n0w). (B) Structure of oligomeric RAD51 with oligomerization epitope (orange) of one protomer binding the next molecule in the filament (surface) (PDB: 5nwl). (C) Sequences of BRC4 repeat, and its FxxA and LFDE epitopes containing half peptides and the isolated RAD51 oligomerization peptide (OP). (D) Competitive FP assay with labeled BRC4 repeat as probe which shows competitive binding to ChimRAD51 protein with the two BRC4 half-peptides (FxxA and LFDE, green and blue) and RAD51 oligomerization peptide (OP, orange). The dissociation constants measured for the FxxA half-peptide and for the oligomerization peptides were 36 ± 7 μM and 18 ± 3 μM, respectively.
Figure 2
Figure 2
Development of CAM833 (A) Merging of 3-amino-2-naphthoic acid (3) with FHPA tetrapeptide to yield 4. Trimming of the naphthyl and histidine group and replacement of terminal amide with phenyl group yields 5. Increase of polarity by replacing naphthyl with quinoline and adding methoxy group the phenyl ring results in 6. Further optimization leads to CAM833. (B) Overlaid crystal structures of HumRadA1 in complex with 2-naphthol (2, PDB: 4B32, pink), 3-amino-2-naphthoic acid (3, PDB: 6TV3, dark red) and FHTA tetrapeptide (1, PDB: 4B3B, yellow). (C) Structure of 4 (PDB: 6TWR, deep purple) in complex with HumRadA1 overlaid with FHTA peptide (PDB: 4B3B, yellow). (D) Structure of CAM833 (orange, PDB: 6TW9) in complex with HumRadA22F. Side view of CAM833 complex with HumRadA22F showing partially cut surface of the protein and interaction of the fluoroquinoline ring with the Phe-pocket and the chloro-phenyl group binding into the oligomerization groove. (E) Competition of BRC4 peptide binding to ChimRAD51 using FP assay with CAM833. Three independent measurements (triplicate technical repeats) of the same binding are shown in three different colors. (F) Isothermal titration calorimetric measurement of direct binding of CAM833 to ChimRAD51. The baseline corrected thermogram is shown above with x and y axes above and left of the graph. The solid squares depict integrated heats for each titration point and solid line the fit to single-site binding mode with corresponding x and y axes below and to left of the graph. (G) Refined 2FoFc electron density is shown for the ligand, contoured at 1σ.
Figure 3
Figure 3
CAM833 causes a concentration-dependent decrease in RAD51 foci and subsequent increase in DNA damage (A) Images from the Cellomics Arrayscan HCS microscope depicting A549 cells treated with CAM833 (50 μM) or DMSO controls with or without ionizing radiation (3 Gy). Briefly, cells were co-stained with Hoechst-33342 to identify nuclei and anti-RAD51 antibody to detect RAD51 foci. The final column shows the Hoechst-stained cells with computationally identified nuclei outlined with green, and RAD51 foci with red, respectively. Scale bar, 20 μm (estimated). (B) An IC50 curve calculated from the images collected using the Cellomics HCS microscope as shown in (A). A549 cells were treated with CAM833, exposed to 3 Gy ionizing radiation (IR) and fixed after 6 h of incubation. CAM833 inhibits the formation of IR-induced RAD51 foci in A549 cells with an IC50 of 6 μM. Percent inhibition on the y axis was plotted against CAM833 concentration (as molar) on the x. Plots show mean ± SEM. (C) Cells treated by the same method were stained and counted for γ-H2AX foci 24 h after exposure. Each pair of bars corresponds to cells exposed to one of five different concentrations (lowest, 3.125 μM on the right, to highest, 50 μM, on the left) of CAM833 alone (0 Gy), or CAM833 plus 3 Gy IR (3 Gy). Bars depict the mean values of the fold change in γ-H2AX foci number over control cells treated with DMSO alone, ±SEM. CAM833 causes a concentration-dependent increase in unresolved DNA damage after 24 h. Results are representative of three independent repeats.
Figure 4
Figure 4
CAM833 inhibits RAD51 molecular clustering at DNA damage sites visualized by SMLM (A) Diagrammatic representation of the biallelic truncating mutations (red and orange) affecting BRCA2 in the patient-derived cell line EUFA423, and their functional complementation by full-length BRCA2 (green) in EUFA423 + BRCA2 cells. Black vertical lines depict the approximate positions of the BRC repeats. (B) Distribution of the number of RAD51 molecules contained within damage-induced clusters in EUFA423 or EUFA423 + BRCA2 cells, without or with exposure to 25 μM CAM833, 3 h after exposure to 3 Gy ionizing radiation. The box plot was generated using the Matlab boxplot function. The central mark indicates the median (purple dot). The bottom and top edges of the box indicate the 25th and 75th percentiles, respectively. The whiskers extend to the most extreme data points not considered outliers. The mean is marked by a purple line. ∗∗∗ and n.s. indicates p values lower than 10−5 and not significant differences, respectively. (C) Representative SMLM images of RAD51, represented as 2D Voronoi polygons. The color of the polygons shows molecular densities normalized to the maximum value. Scale bar, 500 nm. (D) High-magnification SMLM images of damage-induced RAD51 filaments in EUFA423 + BRCA2 cells (DMSO-control left-hand panels), and their suppression by CAM833 (right-hand panels), under the same experimental conditions, at higher magnification. Scale bar, 200 nm. Images are shown either at low-resolution (LR) or super-resolved (SR). Results are representative of two independent repeats.
Figure 5
Figure 5
CAM833 inhibits homologous recombination and potentiates cell-cycle arrest (A) Schematic depiction of the mClover-Lamin assay for DNA repair by homologous DNA recombination (HDR). HeLa Kyoto cells were transfected with the assay plasmids (Lamin A-targeting sgRNA and mClover Lamin A donor constructs) and analyzed for mClover Lamin A-positive (HDR-positive) cells after 3 days. CAM833 was added to the cells 1 h before transfection and maintained until analysis by microscopy. (B) Representative microscopic fields showing fluorescence of the mClover-Lamin A fusion protein, DNA (DAPI staining) and merged images after exposure to increasing doses of CAM833. Scale bar, 20 μm. (C) Histogram showing the mean of HDR positive cells (%) ± SE from two independent repeats. More than 200 cells per sample were analyzed in each repeat. Statistical significance was tested by a 1-way ANOVA test, followed by Dunnett's multiple comparison test: ns, p value > 0.05; ∗p value ≤ 0.05; ∗∗p value ≤ 0.01; ∗∗∗p value ≤ 0.001. (D) Cell cycle analysis of HCT116 cells over a 72-h time course after treatment with 20 μM CAM833 or DMSO control, combined with exposure to 3 Gy ionizing radiation. (E) Dose-response curves for growth inhibition of HCT-116 cells combining 0 (blue circles) or 3 Gy (green squares) of IR at different doses of CAM833. Cell growth was measured after 96 h using the sulforhodamine B cell proliferation assay. Each plotted value represents the mean percent growth inhibition ±SEM compared with control cells exposed to DMSO plus the indicated IR dose.
Figure 6
Figure 6
Low-dose ionizing radiation potentiates the effects of CAM833 but not carboplatin (A) Cell growth after exposure to increasing levels of ionizing radiation in the presence of a fixed dose (10 μM) of either Carboplatin or CAM833. Bars depict percent growth compared with control cells exposed to DMSO plus the indicated IR dose, represented as the mean ± SEM. Values <100 indicate growth inhibition. (B and C) Plot dose-response curves for growth inhibition combining 0 (green circles), 1 Gy (orange squares), 2 Gy (red triangles), or 3 Gy (blue triangles) of IR with different doses of carboplatin (B) or CAM833 (C) shown as molar. In (B) and (C), each plotted value represents the mean percent growth inhibition ±SEM compared with control cells exposed to DMSO plus the indicated IR dose. (D) Observed changes in IC50 (expressed in μM) for growth inhibition derived from the curves in (B) and (C). These data are representative of 3 independent experiments.
Figure 7
Figure 7
CAM833 potentiates the growth suppressive effect of PARP1 inhibition in BRCA2 wild-type cells (A and B) Dose-response curves for growth inhibition in HCT116 cells exposed to different doses of AZD2461 plotted as molar combined with a fixed dose of either 10 μM (A) or 20 μM (B) of CAM833. Control experiments in which vehicle (DMSO) was added in place of AZD2461 are plotted in blue. Growth was measured 96 h after compound exposure using the SRB assay, and is depicted as the mean percent inhibition ±SEM compared with controls. (C and D) Reciprocal dose-response curves for growth inhibition after exposure to different doses of CAM833 plotted as molar combined with a fixed dose of either 0.1 μM (C) or 1 μM (D) of AZD2461. Control experiments in which vehicle (DMSO) was added in place of CAM833 are plotted in blue. Measurements and plots are as in the previous panels. Results are representative of two independent repeats.

References

    1. Adams P.D., Afonine P.V., Bunkóczi G., Chen V.B., Davis I.W., Echols N., Headd J.J., Hung L.-W., Kapral G.J., Grosse-Kunstleve R.W. PHENIX: a comprehensive Python-based system for macromolecular structure solution. Acta Crystallogr. D. Biol. Crystallogr. 2010;66:213–221. - PMC - PubMed
    1. Arnoult N., Correia A., Ma J., Merlo A., Garcia-Gomez S., Maric M., Tognetti M., Benner C.W., Boulton S.J., Saghatelian A. Regulation of DNA repair pathway choice in S and G2 phases by the NHEJ inhibitor CYREN. Nature. 2017;549:548–552. - PMC - PubMed
    1. Bagnolini G., Milano D., Manerba M., Schipani F., Ortega J.A., Gioia D., Falchi F., Balboni A., Farabegoli F., De Franco F. Synthetic lethality in pancreatic cancer: discovery of a new RAD51-BRCA2 small molecule disruptor that inhibits homologous recombination and synergizes with olaparib. J. Med. Chem. 2020;63:2588–2619. - PMC - PubMed
    1. Bignell G., Micklem G., Stratton M.R., Ashworth A., Wooster R. The BRC repeats are conserved in mammalian BRCA2 proteins. Hum. Mol. Genet. 1997;6:53–58. - PubMed
    1. Blundell T.L., Jhoti H., Abell C. High-throughput crystallography for lead discovery in drug design. Nat. Rev. Drug Discov. 2002;1:45–54. - PubMed

Publication types

MeSH terms