. 2021 Apr 14;29(4):564-578.e9.
doi: 10.1016/j.chom.2021.01.016. Epub 2021 Mar 3.

B cell engagement with HIV-1 founder virus envelope predicts development of broadly neutralizing antibodies

Affiliations

B cell engagement with HIV-1 founder virus envelope predicts development of broadly neutralizing antibodies

Samantha M Townsley et al. Cell Host Microbe. .

Abstract

Determining which immunological mechanisms contribute to the development of broad neutralizing antibodies (bNAbs) during HIV-1 infection is a major goal to inform vaccine design. Using samples from a longitudinal HIV-1 acute infection cohort, we found key B cell determinants within the first 14-43 days of viremia that predict the development of bNAbs years later. Individuals who develop neutralization breadth had significantly higher B cell engagement with the autologous founder HIV envelope (Env) within 1 month of initial viremia. A higher frequency of founder-Env-specific naive B cells was associated with increased B cell activation and differentiation and predictive of bNAb development. These data demonstrate that the initial B cell interaction with the founder HIV Env is important for the development of broadly neutralizing antibodies and provide evidence that events within HIV acute infection lead to downstream functional outcomes.

Keywords: B cells; HIV; acute infection; broadly neutralizing antibodies; founder envelope.


Conflict of interest statement

Declaration of interests The authors declare no competing interests.

Figures
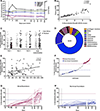
Figure 1.
Figure 1.. Longitudinal development of neutralization breadth starting from acute infection
(A) Median VL (copies/mL, left axis) and cell counts (cells/mm3, right axis) of 73 ART-naïve participants. Days indicate the number of days since the first positive test for HIV-1 RNA. Day - 30 represents all pre-infection samples. (B) Spearman correlation of each donor’s peak neutralization potency and breadth against the 34-virus panel, with rho and p-values indicated. (C) Comparison of neutralization breadth of individuals from Thailand and East Africa at indicated time points. Peak neutralization represents each donor’s time point when the highest neutralization breadth was achieved. (D) Neutralization fingerprinting was performed to delineate epitope specificity at the peak of neutralization breadth. Expanded slices contain multiple predicted epitopes. (E) Spearman correlation of days post-viremia and neutralization breadth of each individual’s final available time point, with rho and p-values indicated. (F) Individual plasma samples (single dots) ranked by increasing peak neutralization breadth against the 34-virus panel. Individuals who developed broad and non-broad neutralizing antibodies are represented by red and blue dots, respectively. Donors with 35–70% neutralization breadth or who had <35% breadth but were in the study for fewer than 3 years are shown in grey. 70% neutralization breadth (red) and 35% neutralization breadth (blue) are marked by dotted lines. (G and H) Individual (thin lines) and median (thick line) longitudinal neutralization breadth of (G) broad and (H) non-broad neutralizers at specified days post-viremia. Vertical dotted black lines indicate the day of the first positive nucleic acid test. See also Figures S1–2 and Tables S1–3.
Figure 2.
Figure 2.. Neutralization profile of broad and non-broad neutralizers against a 34-virus panel
aColumn subheadings specify the pseudoviruses within their respective subtypes. Values are ID50 plasma neutralization titers; the dilution that resulted in 50% reduction of infectivity as measured by RLU in a TZM-bl neutralization assay. Titer was color-coded as follows: (yellow) 1:20–1:99, (orange) 1:100–1:499, (dark orange) 1:500–1:999, (red) 1:1000–1:5000, (bright red) >1:5000 bNeutralization breadth was defined as the percent of the 34-virus panel with a neutralization titer (ID50) ≥40 (twice the starting dilution). cPotency was defined as the geometric mean titer (GMT) of a single plasma sample calculated using the ID50 of all 34 viruses. See also Figure S2 and Tables S1–3.
Figure 3.
Figure 3.. Early onset of neutralization in individuals who develop neutralization breadth
(A) Heat map of neutralization between broad and non-broad neutralizers starting at month 1. Plasma was tested at longitudinal time points using the 15-virus panel at months 1–6, and against the 34-virus panel at years 1–3 post-viremia. Day ranges following first detectable HIV-1 RNA are shown in parentheses. Patients (sample ID) who were lost to follow up (LFU) or went on anti-retroviral treatment (On ART) are noted in addition to time points with no available sample (NS) or if background MuLV neutralization was detected (HB). (B) Neutralization breadth and (C) potency of broad (red) and non-broad (blue) neutralizers. Lines indicating 70% and 35% neutralization breadth are shown by red and blue dotted lines, respectively. The limit of detection of the assay at a reciprocal titer of 20 (black dotted line) is shown in (C). The median, range, and upper and lower quartile of values within each group are indicated by the boxplots and p-values were calculated by Mann-Whitney. See also Table S4.
Figure 4.
Figure 4.. The number of peripheral B cells during acute HIV infection predict the development of broadly neutralizing antibodies
(A) Spline models of median (solid lines) absolute B cells counts (cells/mm3) are shown longitudinally for broad (red) and non-broad (blue) neutralizers. Shaded areas denote upper and lower 95% confidence intervals. (B) Evaluation of B cell counts between broad (red) and non-broad (blue) neutralizers starting at day 2 through year 3 post-viremia and at the time point of peak neutralization breadth for each individual (chronic, range: day 376–2115). Dashed line indicates 160 B cells/mm3. The median, range, and upper and lower quartile of values within each group are indicated by the boxplots. Significant p-values by Mann-Whitney t-tests are shown. (C) Forest plot indicating the number of B cells within the lower quantile is predictive of neutralization breadth at month1 post-viremia in broad neutralizers. Odds ratios (OR, solid symbols) and 95% confidence intervals (error bars) are indicated with the dashed line at 1 to indicate the cut-off for significance. (D) Logistic regression of lower B cell quantiles with neutralization breadth. Odds ratios (OR), p-values, upper (U95), and lower (L95) 95% confidence intervals, and likelihood of neutralization breadth are indicated. Shaded boxes indicate p-values <0.05. See also Figure S3.
Figure 5.
Figure 5.. Greater changes in peripheral B cell subsets occur in broad neutralizers throughout acute infection
(A and B) Contraction and expansion of B cell subsets represented by radar plots of median normalized scores of B cell subpopulation frequencies of (A) broad and (B) non-broad neutralizers. Colored lines represent the indicated time points pre- and post-infection, with the subpopulation indicated outside of the radar plot. Scores were calculated by standardizing each subpopulation observation across all time points. (C and D) Heat map of p-values by Wilcoxon signed-rank test analyzing B cell subset frequency changes at post-infection time points compared to pre-infection in (C) broad and (D) non-broad neutralizers. Significant p-values were color-coded as follows: (yellow) p<0.05, p>0.01, and (orange) p<0.01. (E) Comparison of B cell subset frequencies at specified time points between broad (red) and non-broad (blue) neutralizers. The median, range, and upper and lower quartile of values within each group are indicated by the boxplots. Reported p-values were generated by Mann-Whitney t tests. See also Figure S4.
Figure 6.
Figure 6.. Reduction in peripheral naïve B cells associates with B cell migration, activation, and differentiation
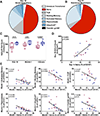
(A and B) Pie charts of absolute B cell subsets at day 14 in (A) broad and (B) non-broad neutralizers. (C) Comparison of peripheral absolute naïve B cells in broad and non-broad neutralizers at indicated longitudinal time points following initial viremia. Chronic represents each donor’s time point when the peak neutralization breadth was achieved. Median B cell counts (cells/mm3) with min to max intervals are shown with p-values calculated by Mann-Whitney t tests. (D) Spearman correlation comparing frequencies of day 14 peripheral naïve B cells to day 14 peripheral absolute B cell counts. (E) Spearman correlations comparing frequencies of naïve B cells at month 1 to frequencies of month 1 activated memory, resting memory, tissue-like memory (TLM), plasmablasts, integrin β7+, and founder gp140+ B cells of broad (red) and non-broad (blue) neutralizers. Rho and p-values are shown for each correlation. See also Figure S5.
Figure 7.
Figure 7.. The initial interaction between founder Env and naive B cells in acute infection is important for the development of neutralization breadth
(A) Cumulative incidence curves indicating the probability of developing neutralization breadth using high, medium, or low frequencies of founder Env-specific B cells 1 month (day 30–43) following initial viremia. Reported p-value by LogRank test. (B) Comparison of frequencies of founder Env-specific B cells between broad (red) and non-broad (blue) neutralizers at month 1. The median, range, and upper and lower quartile of values within each group are indicated by the boxplots and p-values by Mann-Whitney t tests. (C) Biplot of unsupervised Principal Component Analysis (PCA) of founder Env+ B cell phenotypes at month 1. Each dot represents a broad (red) or non-broad (blue) neutralizer plotted in 2 dimensions using their projections on the first 2 principal components (PC). Arrows point in the direction of B cell subsets accounting for the variability observed between groups as projected onto the 2 dimensions of the biplot. (D) Cumulative incidence curves indicating the probability of developing neutralization breadth using high, medium, or low frequencies of founder Env-specific naïve B cells 1 month following initial viremia. Reported p-value by LogRank test. (E) ROC curve using the B cells frequencies of founder Env-specific B cell subsets at month 1 for the prediction of neutralization breadth. Area under the Curve (AUC) for founder Env-specific B cells and founder-Env B cell subsets is shown for those reaching a predictive power over 0.70. (F) IgM binding antibodies against respective autologous founder Env gp140 at indicated longitudinal time points. (G and H) Antibody binding to (G) BG505 or (H) ZM106.9 SOSIP constructs at longitudinal time points. (I) B cell receptor (BCR) IgM and IgG isotype usage of founder-Env specific B cells at month 1 per individual. (J) IgM and IgG heavy chain germline usage of founder Env-specific B cells at month 1. Heavy chains that constitute 50% of heavy chain usage for each isotype are shown. Heavy chains that account for fewer than 2% of the germline usage are grouped together as “other”. See also Figures S6–S7 and Table S5.

Comment in

References

    1. Ananworanich J, Schuetz A, Vandergeeten C, Sereti I, de Souza M, Rerknimitr R, Dewar R, Marovich M, van Griensven F, Sekaly R, et al. (2012). Impact of Multi-Targeted Antiretroviral Treatment on Gut T Cell Depletion and HIV Reservoir Seeding during Acute HIV Infection. PLoS ONE 7. - PMC - PubMed
    1. Bargatze RF, Jutila MA, and Butcher EC (1995). Distinct roles of L-selectin and integrins alpha 4 beta 7 and LFA-1 in lymphocyte homing to Peyer’s patch-HEV in situ: the multistep model confirmed and refined. Immunity 3, 99–108. - PubMed
    1. Berlin C, Bargatze RF, Campbell JJ, von Andrian UH, Szabo MC, Hasslen SR, Nelson RD, Berg EL, Erlandsen SL, and Butcher EC (1995). alpha 4 integrins mediate lymphocyte attachment and rolling under physiologic flow. Cell 80, 413–422. - PubMed
    1. Briney B, Le K, Zhu J, and Burton DR (2016). Clonify: unseeded antibody lineage assignment from next-generation sequencing data. Sci Rep 6, 23901. - PMC - PubMed
    1. Burnett DL, Langley DB, Schofield P, Hermes JR, Chan TD, Jackson J, Bourne K, Reed JH, Patterson K, Porebski BT, et al. (2018). Germinal center antibody mutation trajectories are determined by rapid self/foreign discrimination. Science 360, 223–226. - PMC - PubMed

Substances