Clinical Trial
. 2021 May;147(5):1652-1661.e1.
doi: 10.1016/j.jaci.2021.02.021. Epub 2021 Mar 1.

IL-6-based mortality prediction model for COVID-19: Validation and update in multicenter and second wave cohorts

Affiliations
Clinical Trial

IL-6-based mortality prediction model for COVID-19: Validation and update in multicenter and second wave cohorts

Alberto Utrero-Rico et al. J Allergy Clin Immunol. 2021 May.

Abstract

Background: Coronavirus disease 2019 (COVID-19) is a highly variable condition. Validated tools to assist in the early detection of patients at high risk of mortality can help guide medical decisions.

Objective: We sought to validate externally, as well as in patients from the second pandemic wave in Europe, our previously developed mortality prediction model for hospitalized COVID-19 patients.

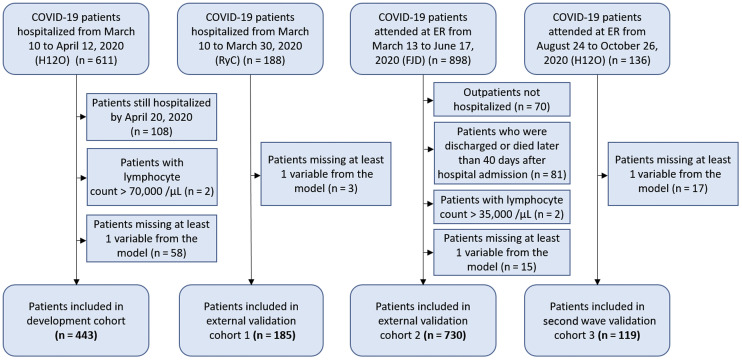
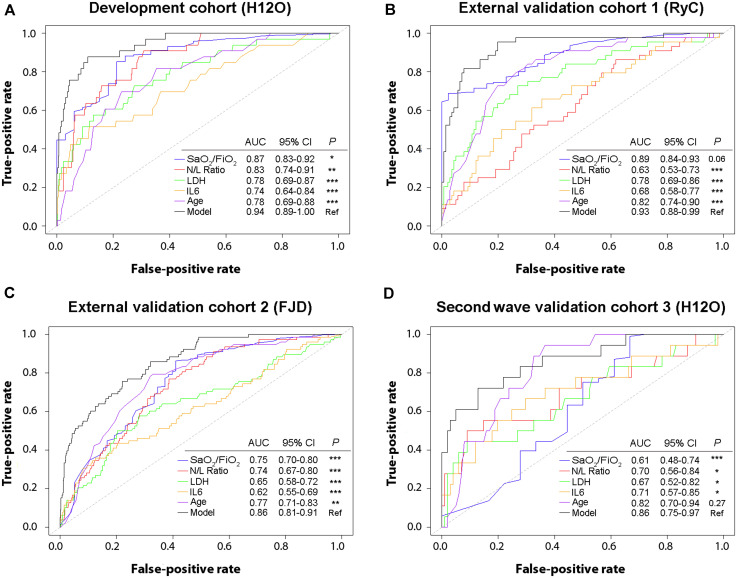
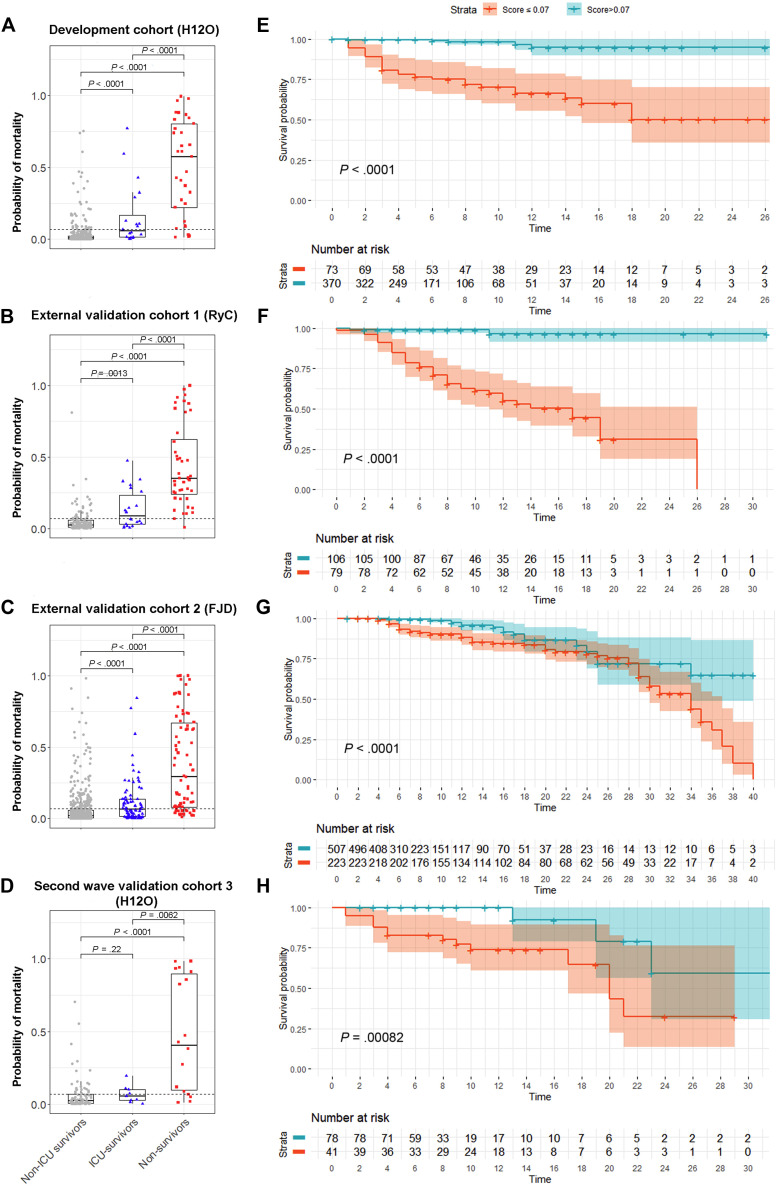
Methods: Three validation cohorts were generated: 2 external with 185 and 730 patients from the first wave and 1 internal with 119 patients from the second wave. The probability of death was calculated for all subjects using our prediction model, which includes peripheral blood oxygen saturation/fraction of inspired oxygen ratio, neutrophil-to-lymphocyte ratio, lactate dehydrogenase, IL-6, and age. Discrimination and calibration were evaluated in the validation cohorts. The prediction model was updated by reestimating individual risk factor effects in the overall cohort (N = 1477).

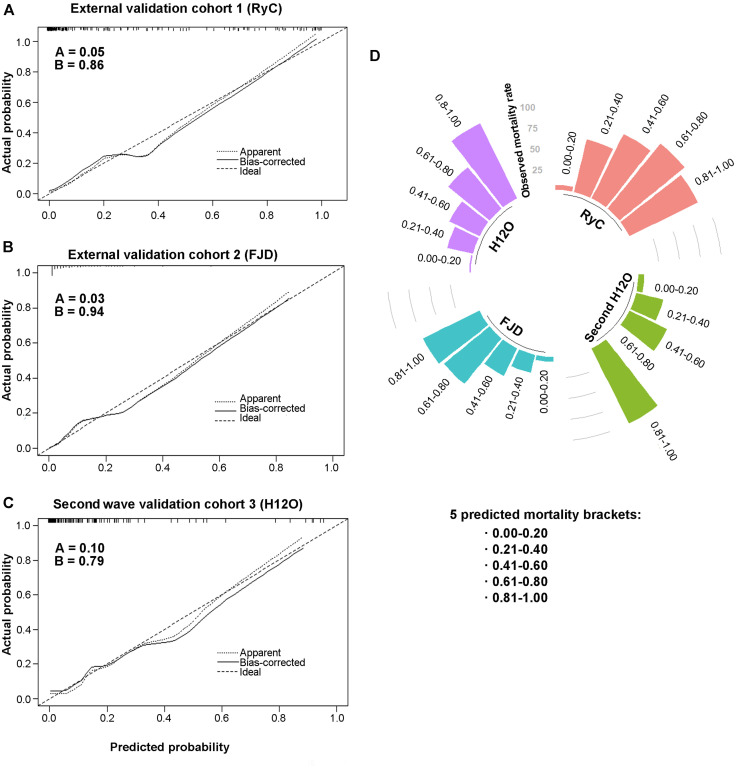
Results: The mortality prediction model showed good performance in the external validation cohorts 1 and 2, and in the second wave validation cohort 3 (area under the receiver-operating characteristic curve, 0.94, 0.86, and 0.86, respectively), with excellent calibration (calibration slope, 0.86, 0.94, and 0.79; intercept, 0.05, 0.03, and 0.10, respectively). The updated model accurately predicted mortality in the overall cohort (area under the receiver-operating characteristic curve, 0.91), which included patients from both the first and second COVID-19 waves. The updated model was also useful to predict fatal outcome in patients without respiratory distress at the time of evaluation.

Conclusions: This is the first COVID-19 mortality prediction model validated in patients from the first and second pandemic waves. The COR+12 online calculator is freely available to facilitate its implementation (https://utrero-rico.shinyapps.io/COR12_Score/).

Keywords: COVID-19; IL-6; external validation; mortality risk; predictive model; second wave.


Figures

Fig 1
Fig 1
Flowchart of patients included in the study. FJD, Hospital Universitario Fundación Jiménez Díaz; H12O, Hospital Universitario 12 de Octubre; RyC, Hospital Universitario Ramon y Cajal.
Fig 2
Fig 2
Comparison of the capacity to predict mortality between the model and the individual risk factors (SpO2/FiO2, N/L ratio, LDH, IL-6, and age) in each patient cohort. A, The classification performance of the model was better than the individual risk factors in the development cohort. B, The classification performance of the model was better than the individual risk factors in the external validation cohort 1, except for SpO2/FiO2. C, The classification performance of the model was better than the individual risk factors in the external validation cohort 2. D, The classification performance of the model was better than the individual risk factors in the second wave validation cohort 3, except for age. Classification performance was compared with De Long test. FJD, Hospital Universitario Fundación Jiménez Díaz; H12O, Hospital Universitario 12 de Octubre; RyC, Hospital Universitario Ramon y Cajal.
Fig 3
Fig 3
The prediction model accurately identified patients at high risk of dying in the validation cohorts. A-D, The probability of dying predicted by the model was significantly higher in nonsurvivors (red), than in survivors who required intensive care (blue) and than in survivors who did not require intensive care (gray), in all cohorts. Dashed lines indicate the model’s optimal cutoff for mortality (0.07). E-H, Using the model’s optimal cutoff, Kaplan-Meier analysis showed a very different survival between the groups with low and high risk of death (P < .001, for all cohorts). FJD, Hospital Universitario Fundación Jiménez Díaz; H12O, Hospital Universitario 12 de Octubre; RyC, Hospital Universitario Ramon y Cajal. Color shades represent the 95% CI. Time is indicated in days.
Fig 4
Fig 4
Calibration analysis depicting the predicted vs observed mortality. A-C, Calibration curves were close to the diagonal dotted line, which represents ideal calibration in which predicted and observed risks are identical. Intercept (Fig 4, A) and slope (Fig 4, B) are shown for each validation cohort. D, Patients were grouped in 5 brackets of increasing probability of death (0%-20%, 21%-40%, 41%-60%, 61%-80%, and 81%-100%). The circular barplot shows how the observed mortality increased steadily as the predicted mortality increased. Of note, in the 2 external validation cohorts, mortality in the highest risk bracket was lower than predicted. Observed mortality rate is represented in concentric circles. FJD, Hospital Universitario Fundación Jiménez Díaz; H12O, Hospital Universitario 12 de Octubre; RyC, Hospital Universitario Ramon y Cajal.
Fig 5
Fig 5
The updated model accurately classified patients at risk of dying. A, The prediction model was revised with the sum of patients from development and validation cohorts (N = 1477). AUC of the updated model was 0.91 (95% CI, 0.87-0.94), with optimal cutoff in 0.107. B, Kaplan-Meier analysis based on Youden index optimal cutoff showed a very different survival between the groups with low and high risk of death (P < .0001). Color shades represent the 95% CI. Time is indicated in days. C, The predicted probability of death in nonsurvivors (red) was significantly higher than in survivors who required intensive care (blue) (P < .0001), and than in survivors who did not require intensive care (gray) (P < .0001). Dashed line indicates optimal cutoff for mortality (0.107).
Fig 6
Fig 6
The updated model-predicted mortality in patients with no respiratory distress at the time of evaluation. A, In the overall cohort, 832 patients had no ARDS in the beginning of their hospitalization. Within these patients, the predicted probability of death in nonsurvivors (red) was significantly higher than in survivors who required intensive care (blue) (P < .0001), and than in survivors who did not require intensive care (gray) (P < .0001). Dashed line indicates optimal cutoff for mortality (0.107). B, Within the patients without ARDS initially, patients classified as high risk by the cutoff survived significantly less than the low-risk patients (P < .0001).
Fig E1
Fig E1
Classification performance of the updated model by sex. The capacity of the updated model to predict mortality was similar in men (AUC, 0.91; 95% CI, 0.87-0.94) than in women (AUC, 0.87; 95% CI, 0.82-0.93), with no statistical difference in accuracy between sex (De Long test, P = .27).

References

    1. Coronavirus Resource Center https://coronavirus.jhu.edu/ Available at:
    1. Cacciapaglia G., Cot C., Sannino F. Second wave COVID-19 pandemics in Europe: a temporal playbook. Sci Rep. 2020;10:15514. - PMC - PubMed
    1. World Health Organization https://who.maps.arcgis.com/apps/opsdashboard/index.html#/ead3c647565448... Available at:
    1. Pastor-Barriuso R., Perez-Gomez B., Hernan M.A., Perez-Olmeda M., Yotti R., Oteo-Iglesias J. Infection fatality risk for SARS-CoV-2 in community dwelling population of Spain: nationwide seroepidemiological study. BMJ. 2020;371:m4509. - PMC - PubMed
    1. Williamson E.J., Walker A.J., Bhaskaran K., Bacon S., Bates C., Morton C.E. Factors associated with COVID-19-related death using OpenSAFELY. Nature. 2020;584:430–436. - PMC - PubMed