. 2021 Jun:147:115906.
doi: 10.1016/j.bone.2021.115906. Epub 2021 Mar 2.

Type 1 diabetic Akita mice have low bone mass and impaired fracture healing

Affiliations

Type 1 diabetic Akita mice have low bone mass and impaired fracture healing

Pei Hu et al. Bone. 2021 Jun.

Abstract

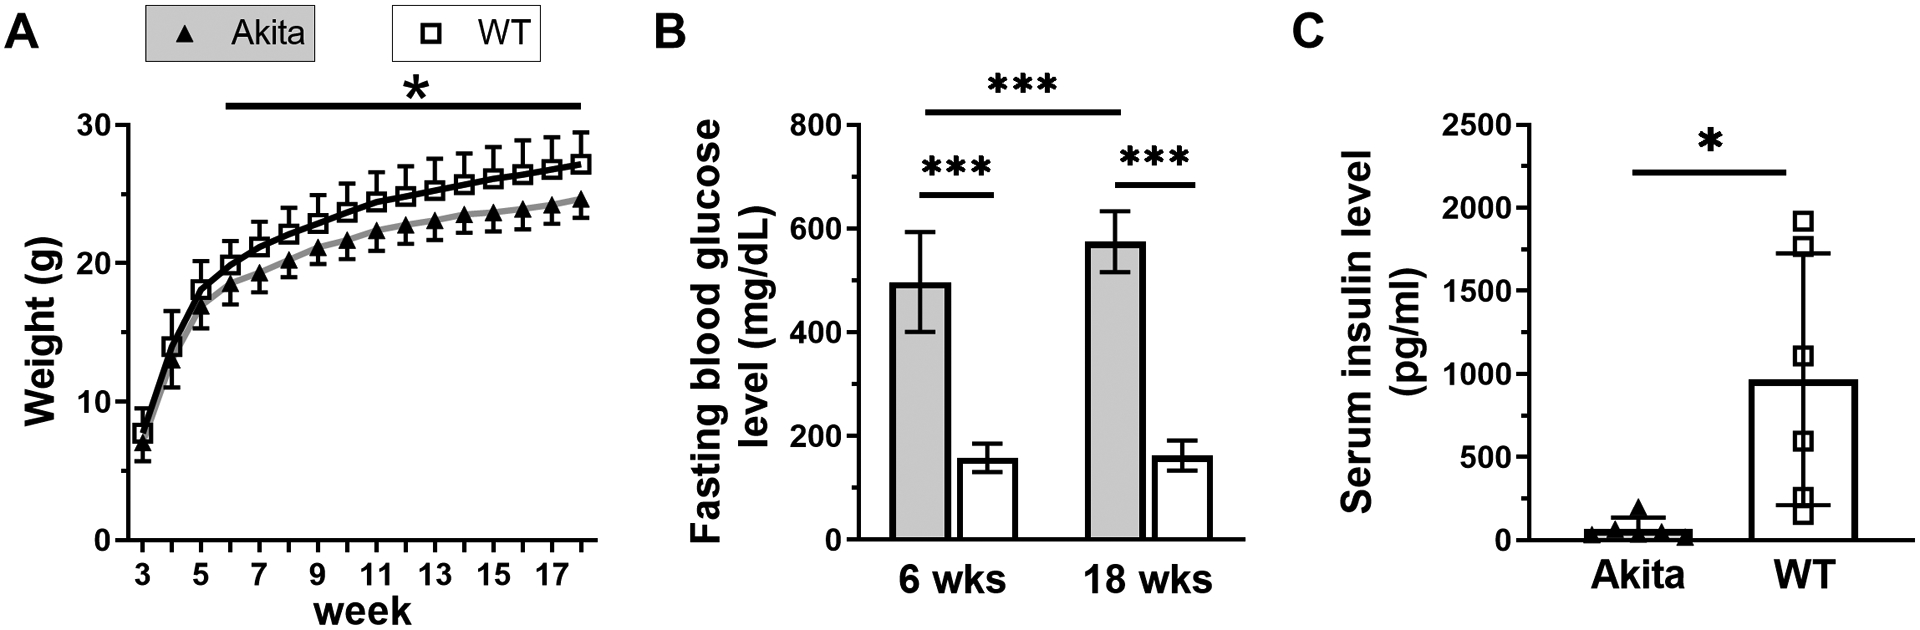
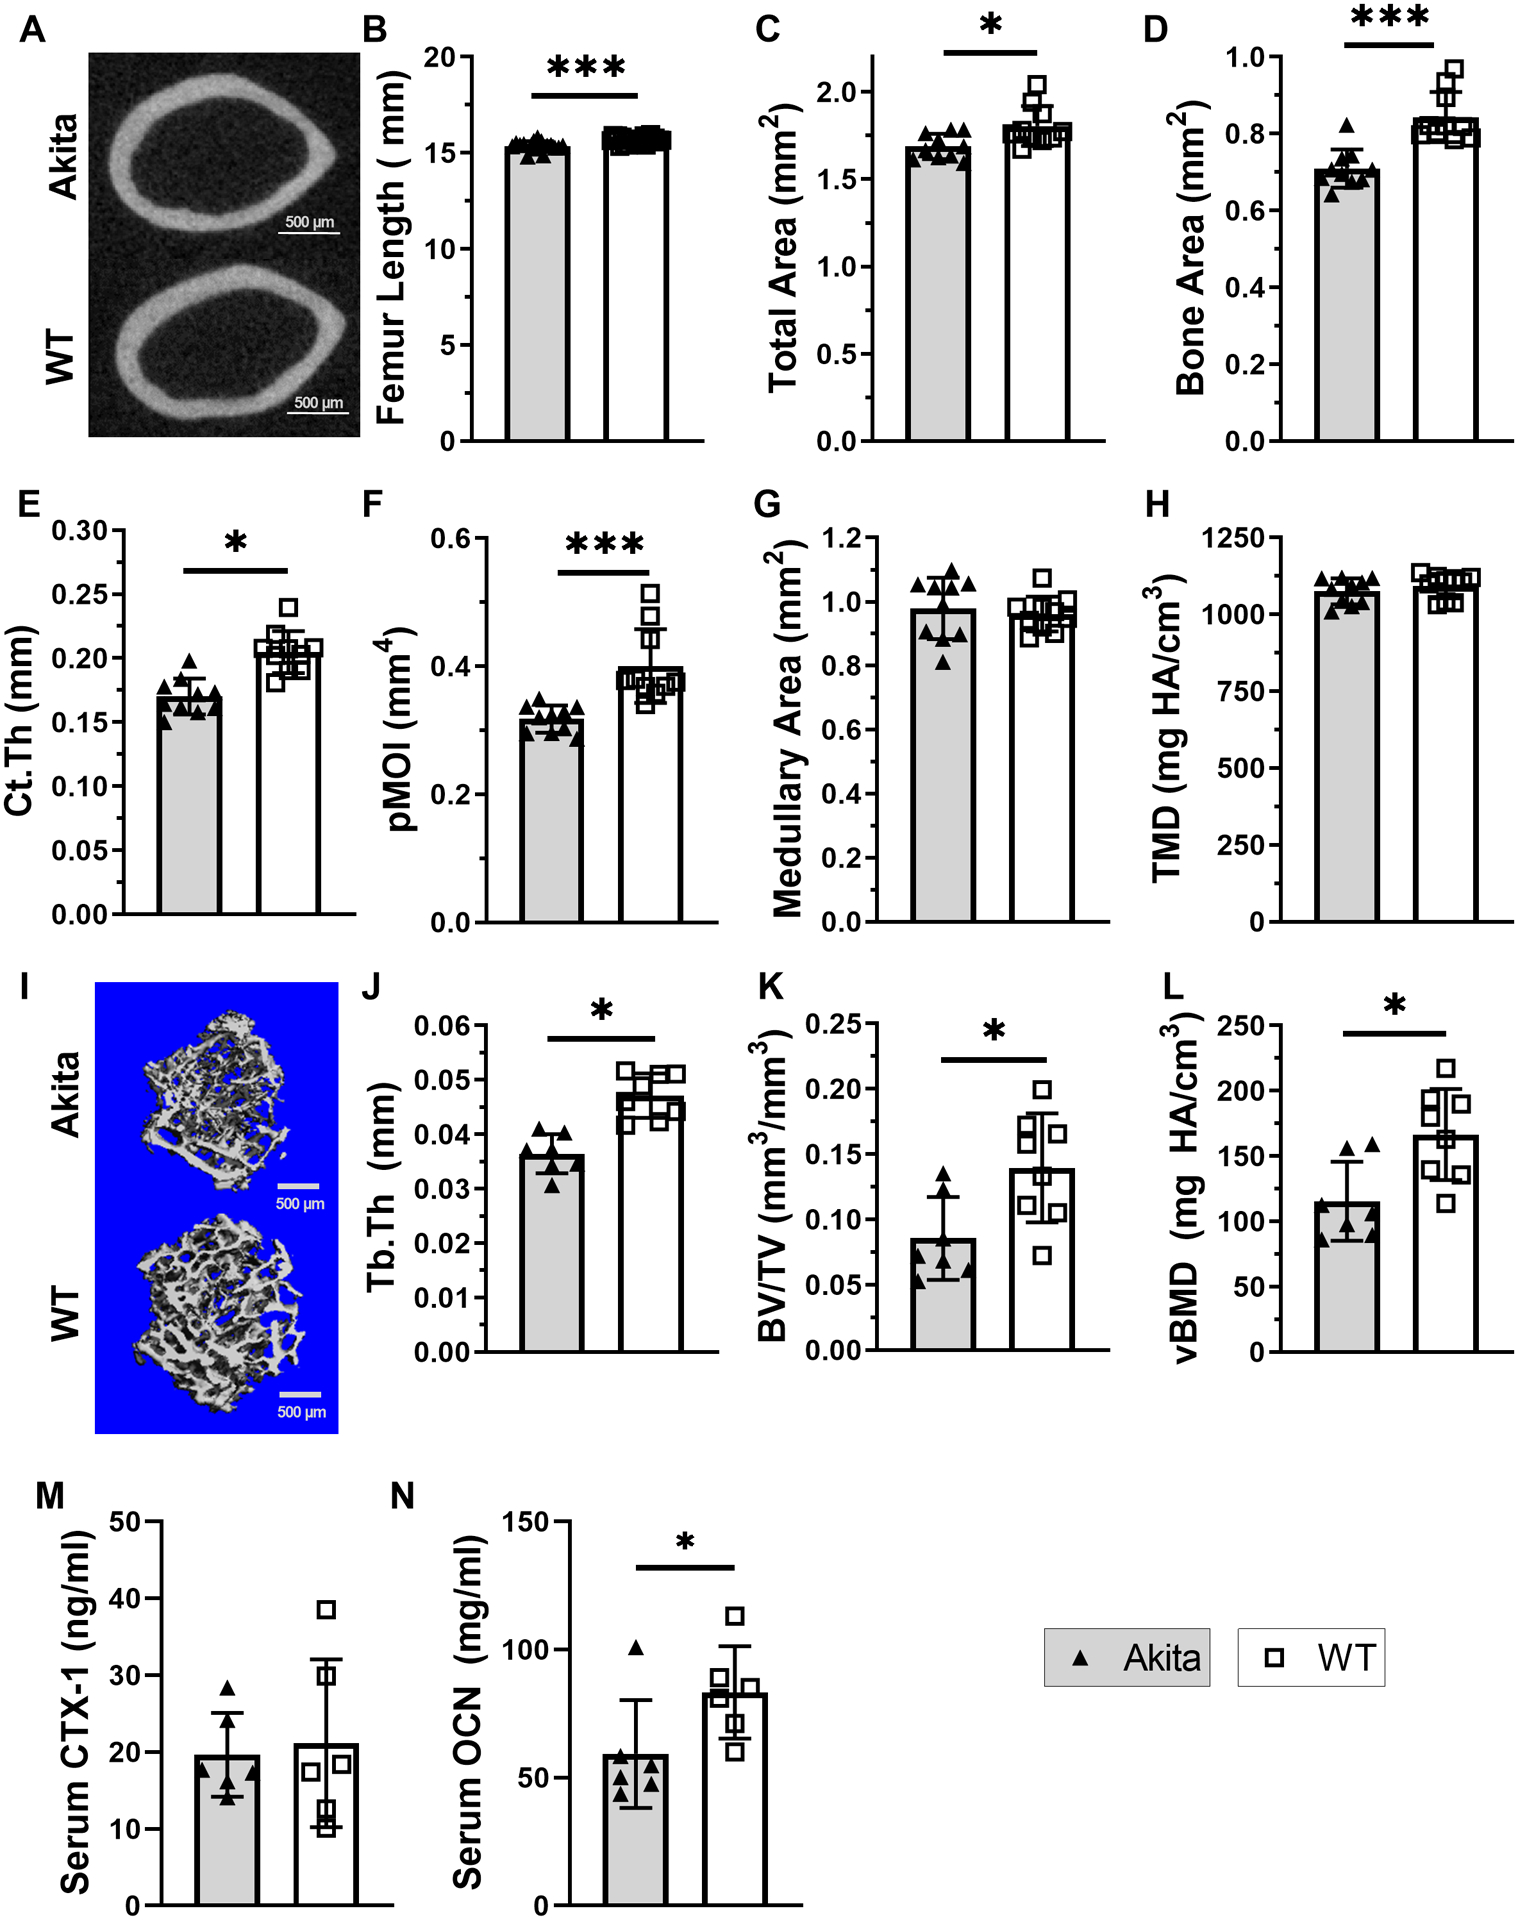
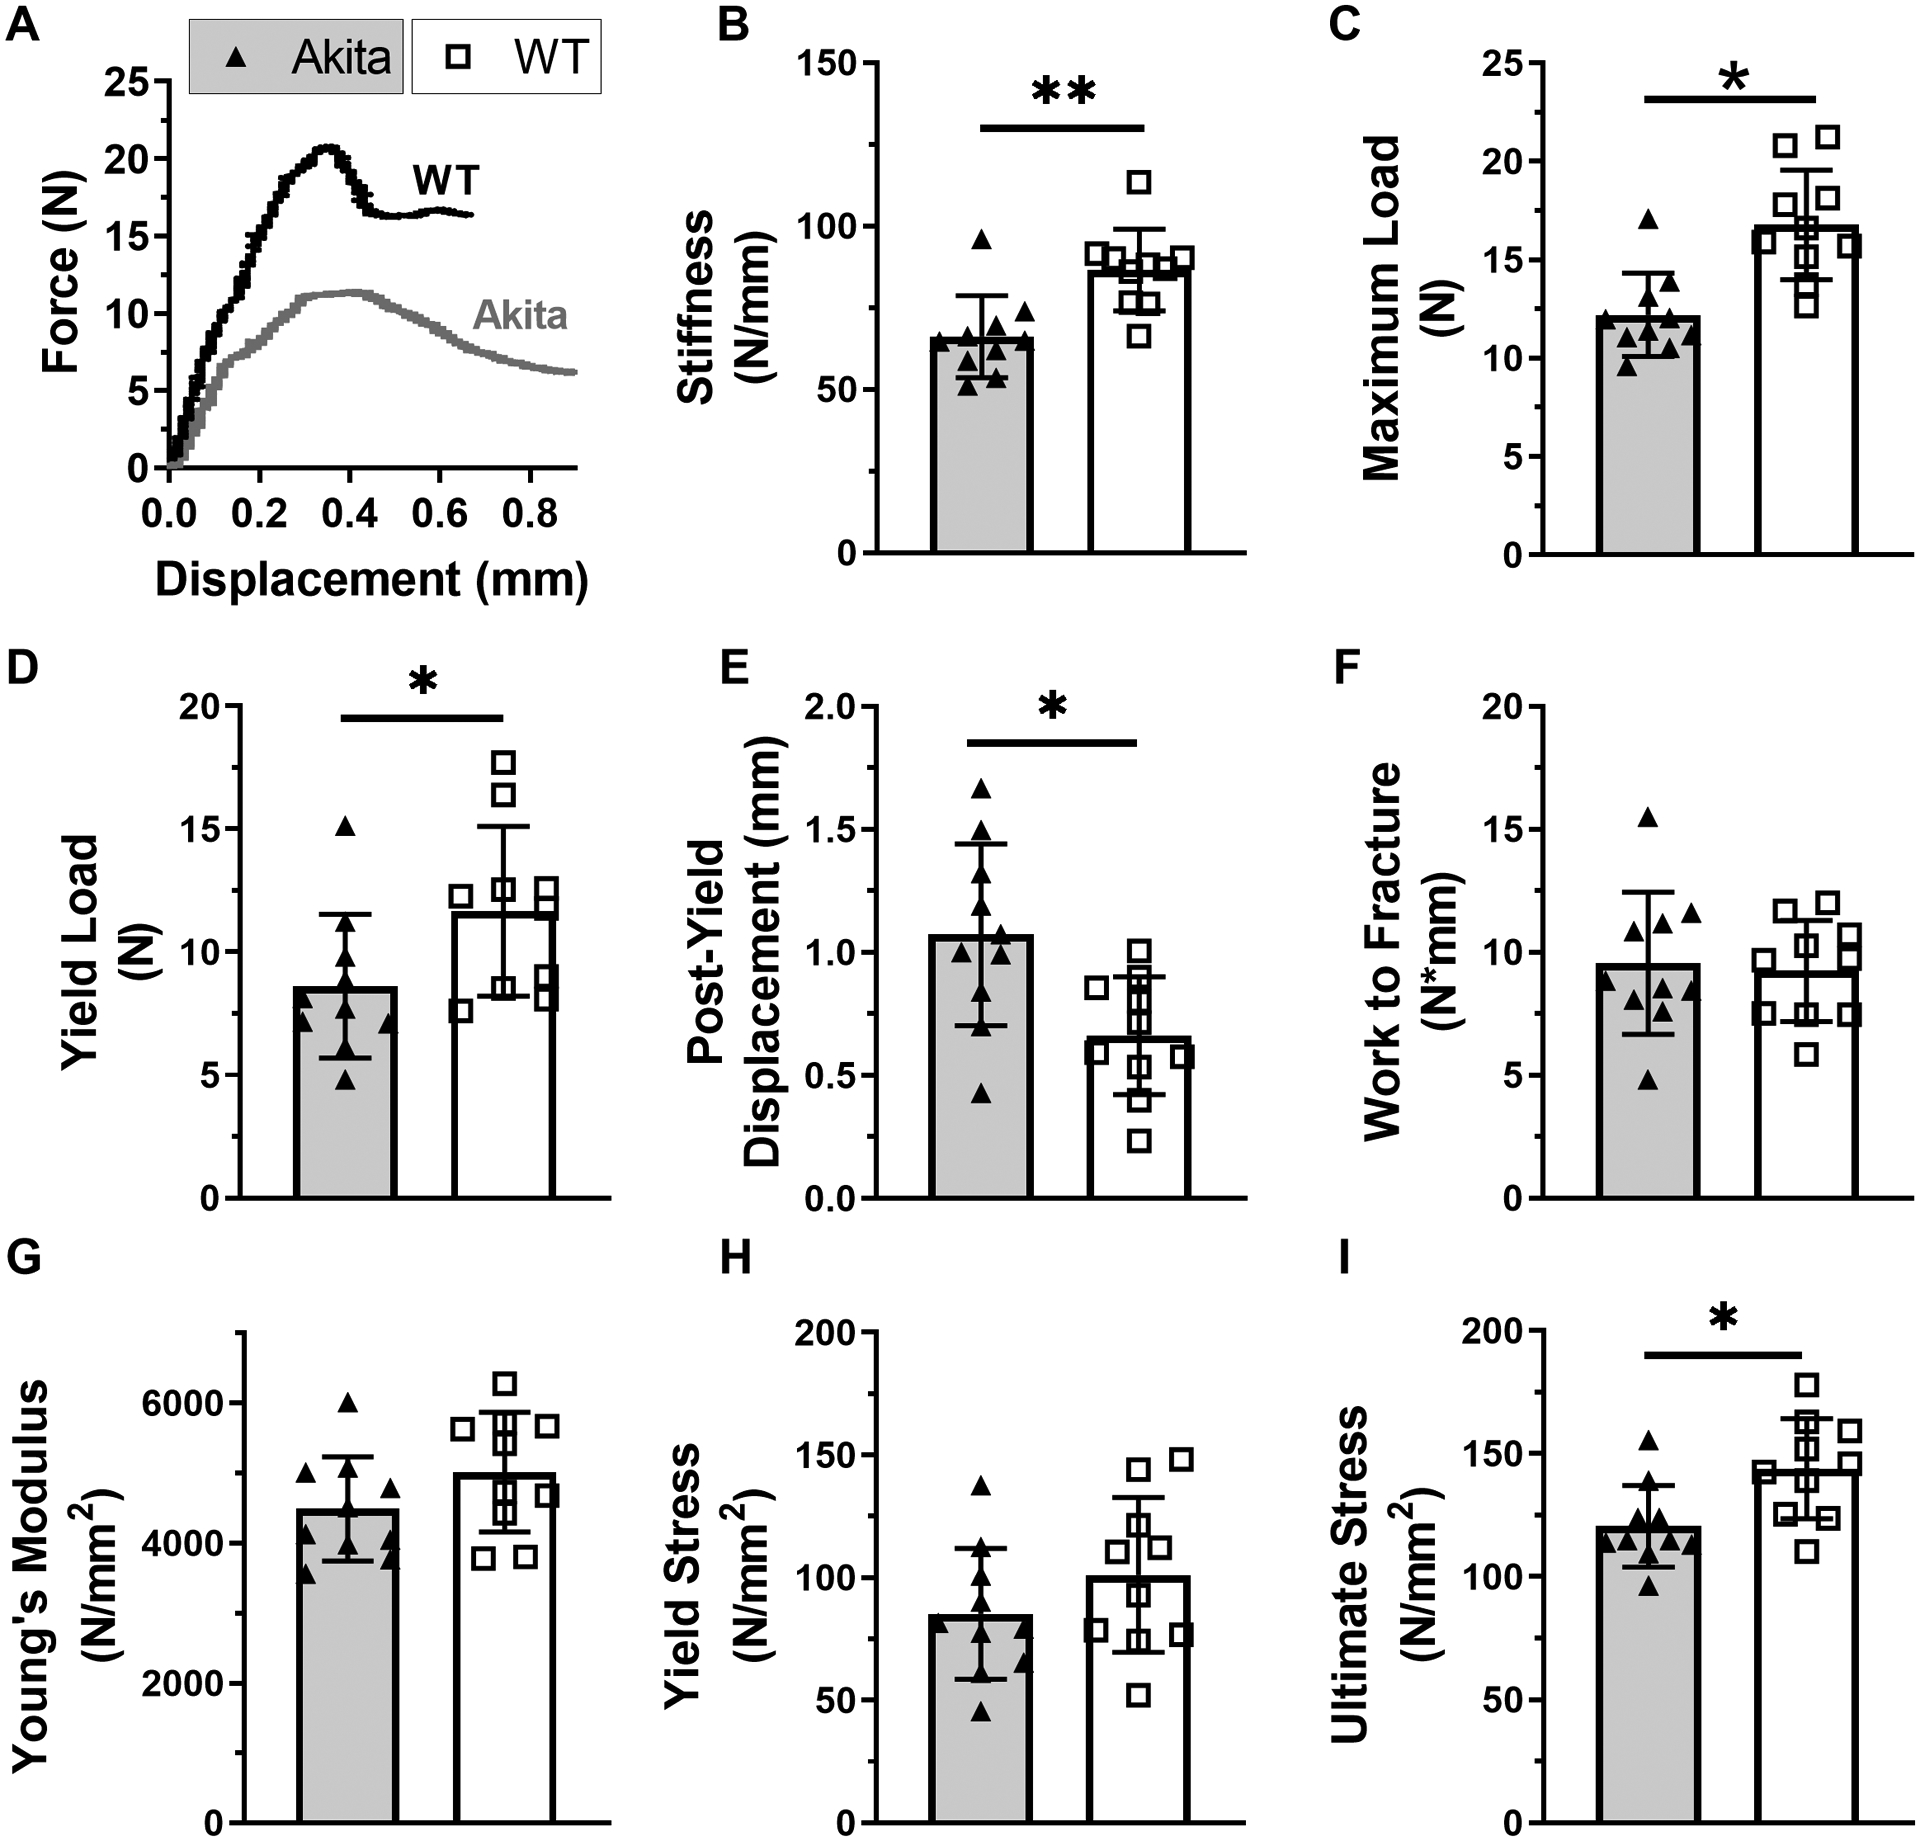
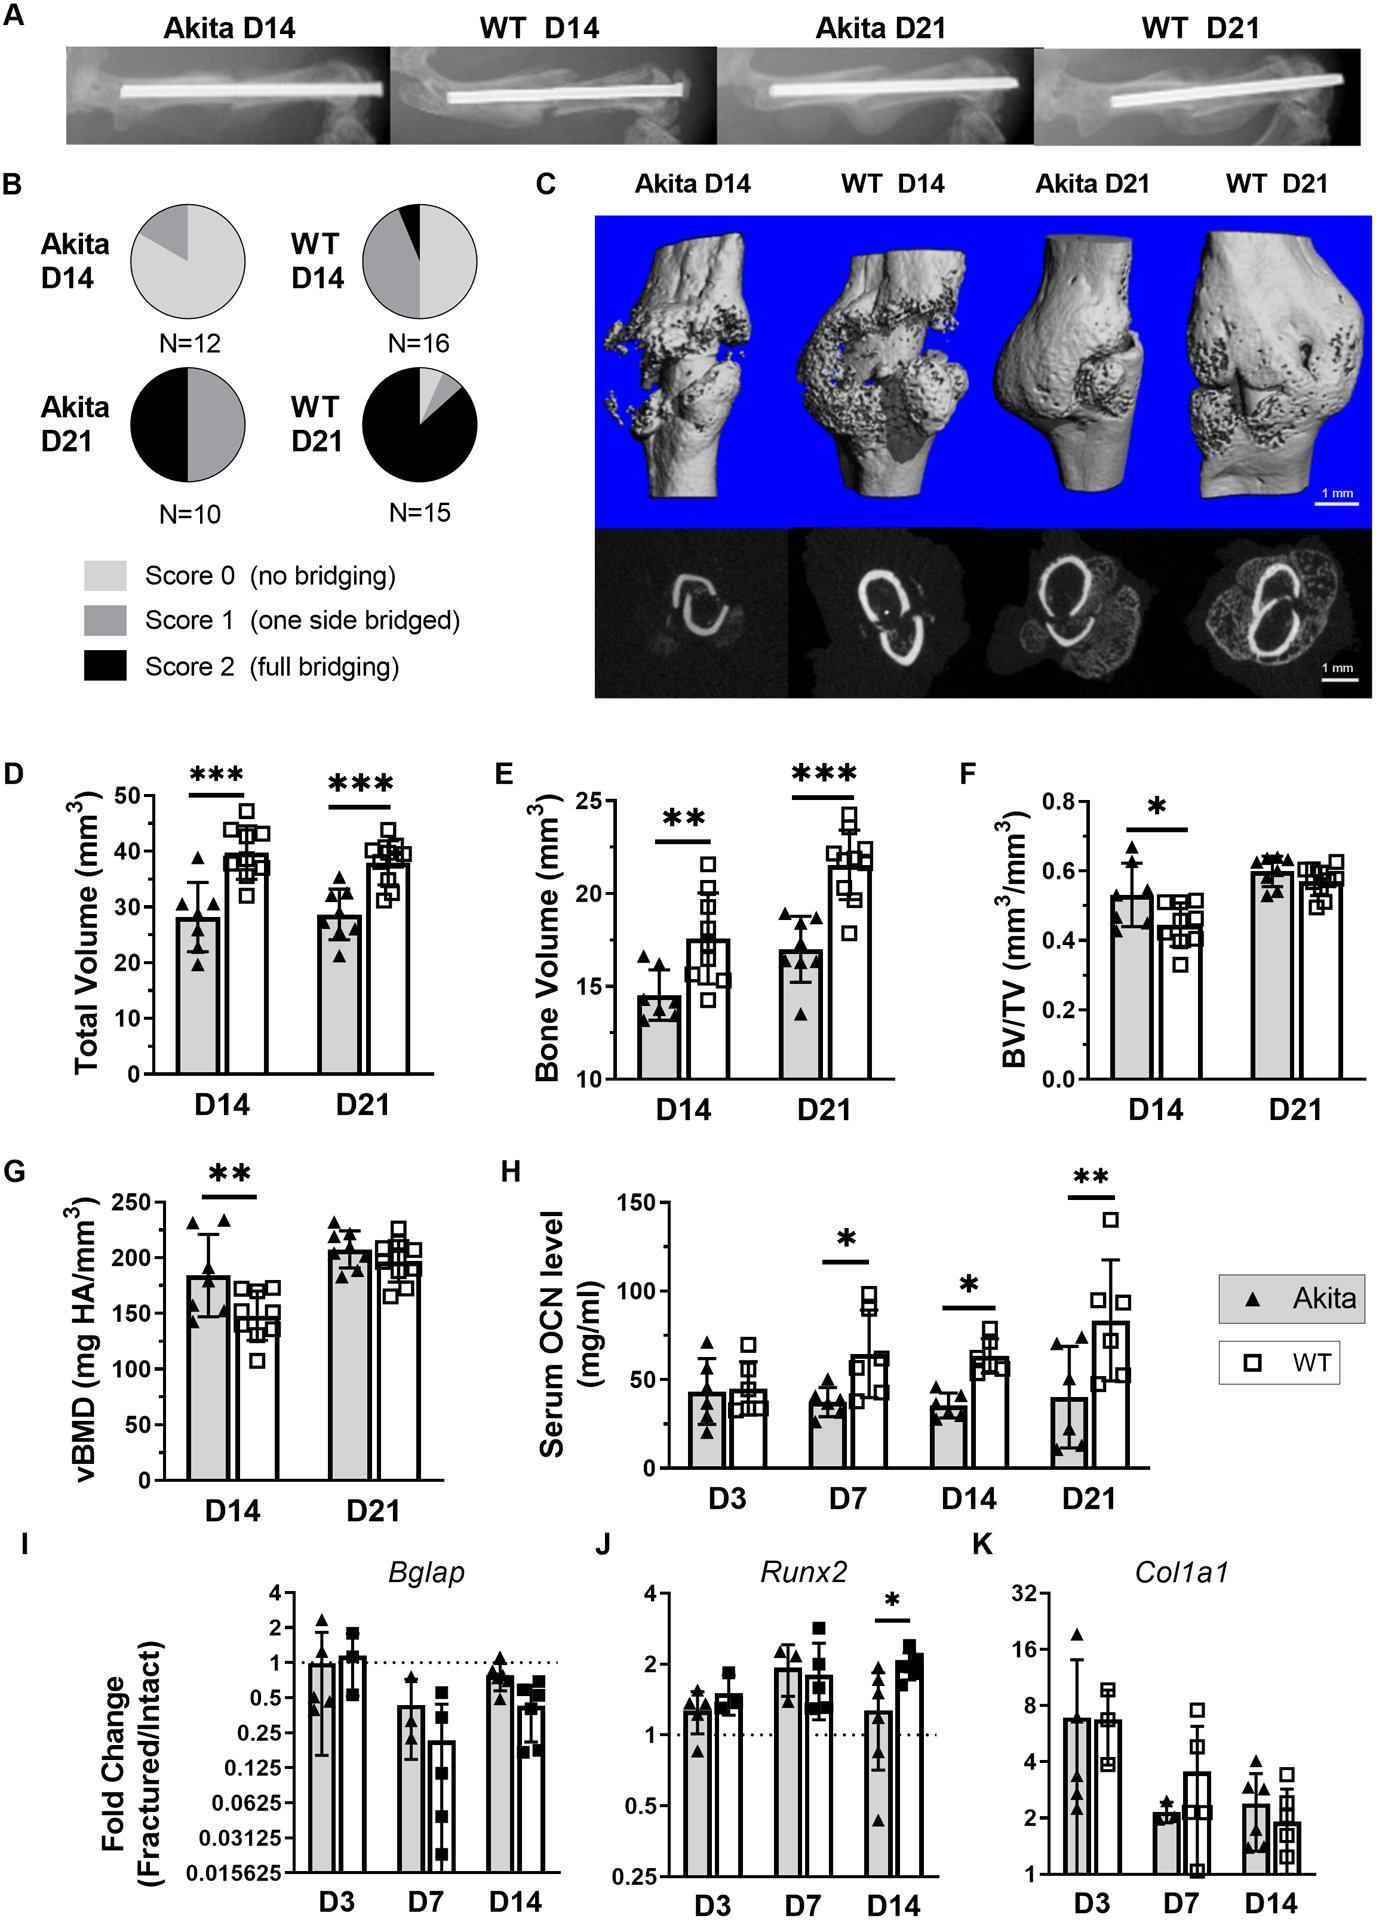
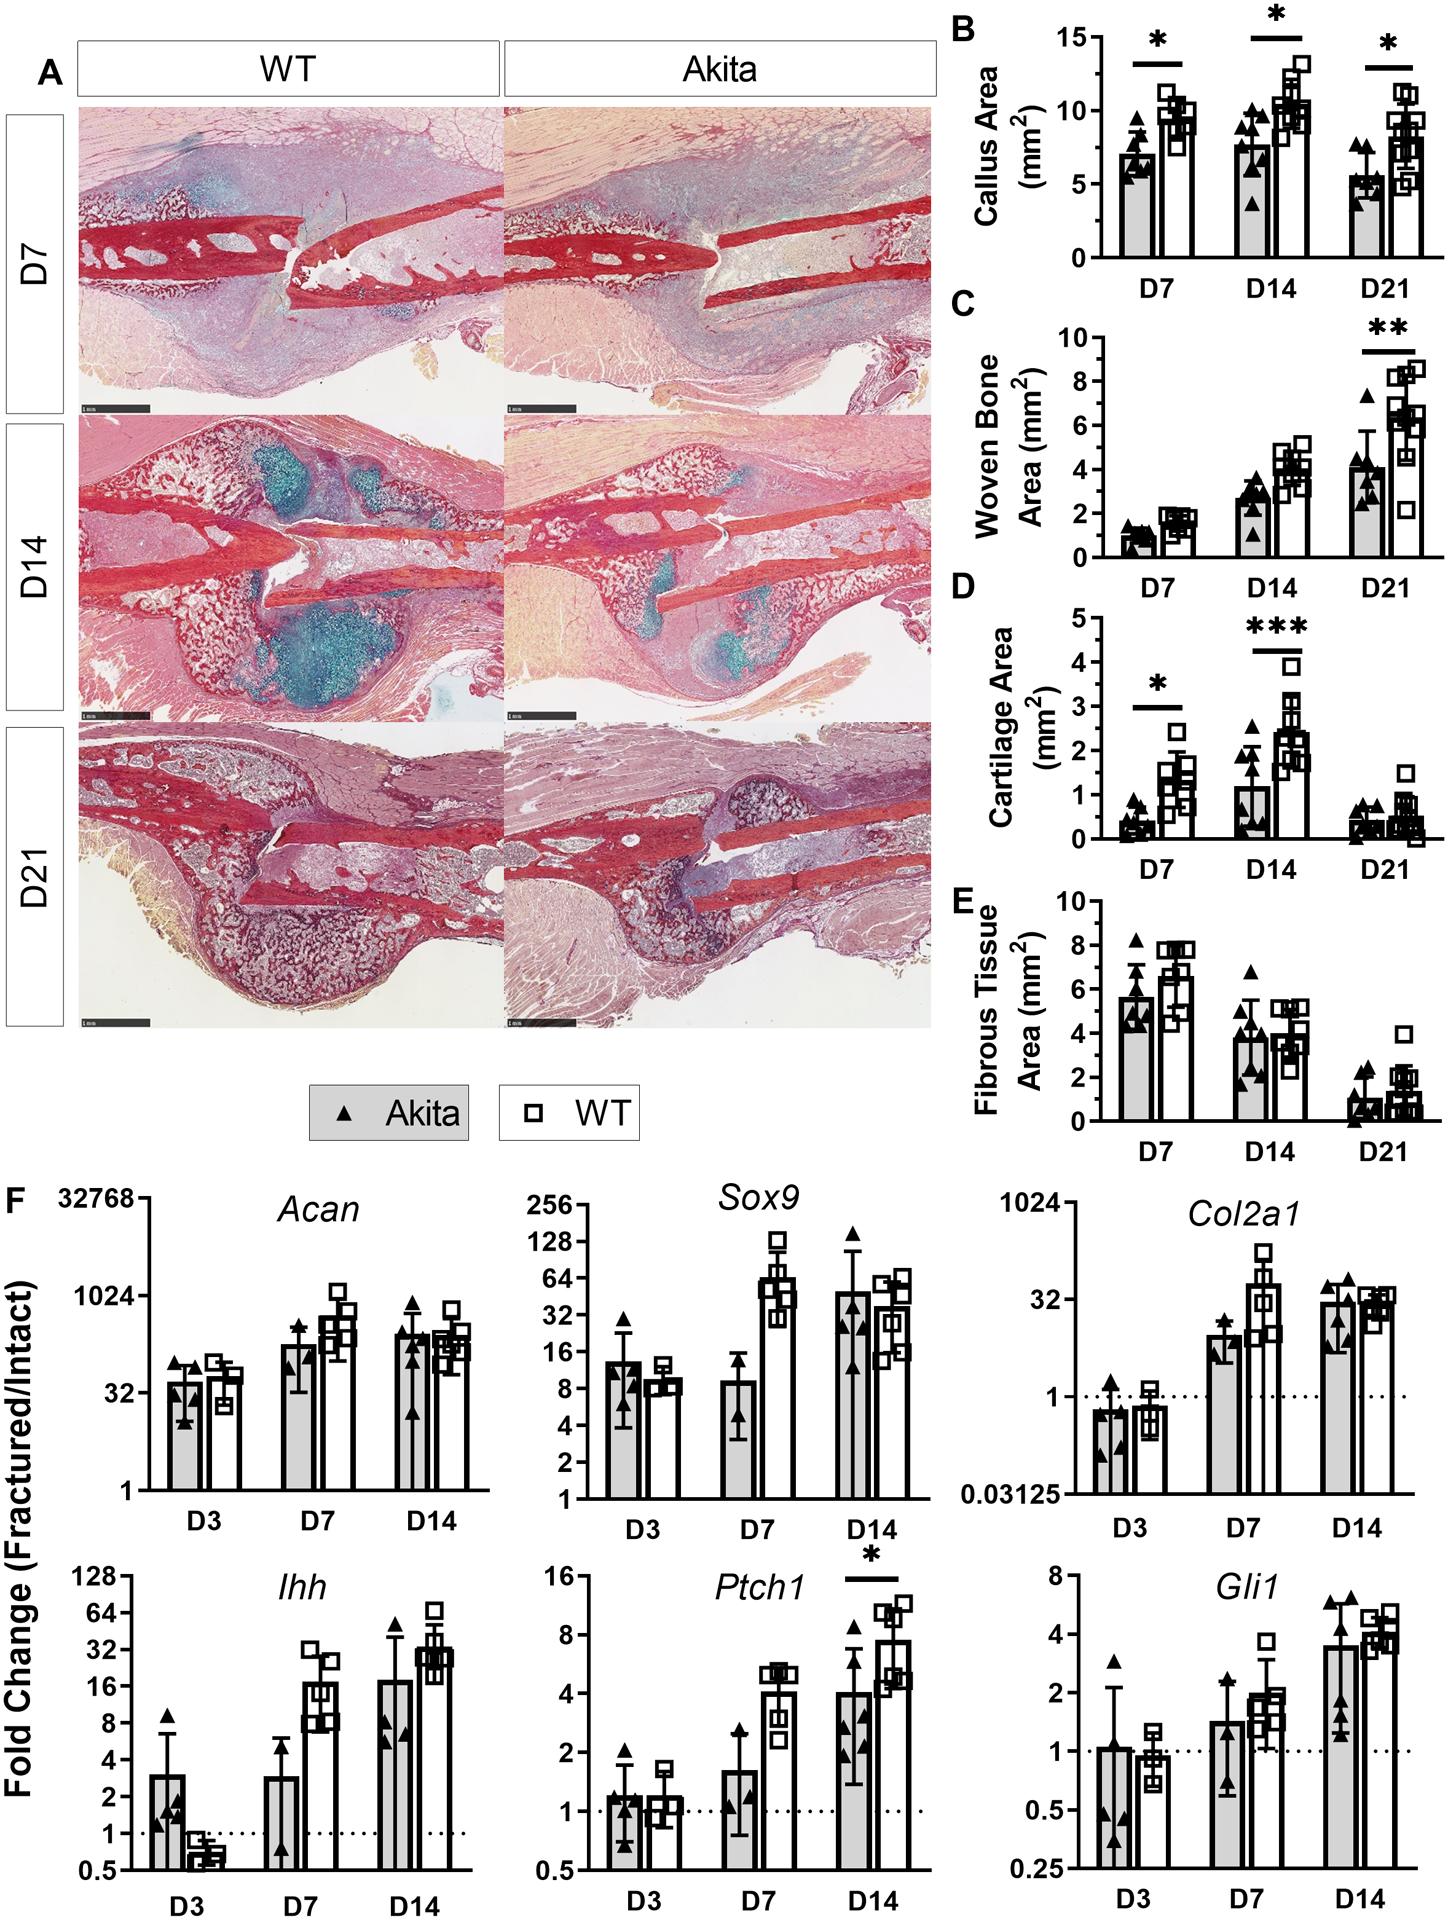
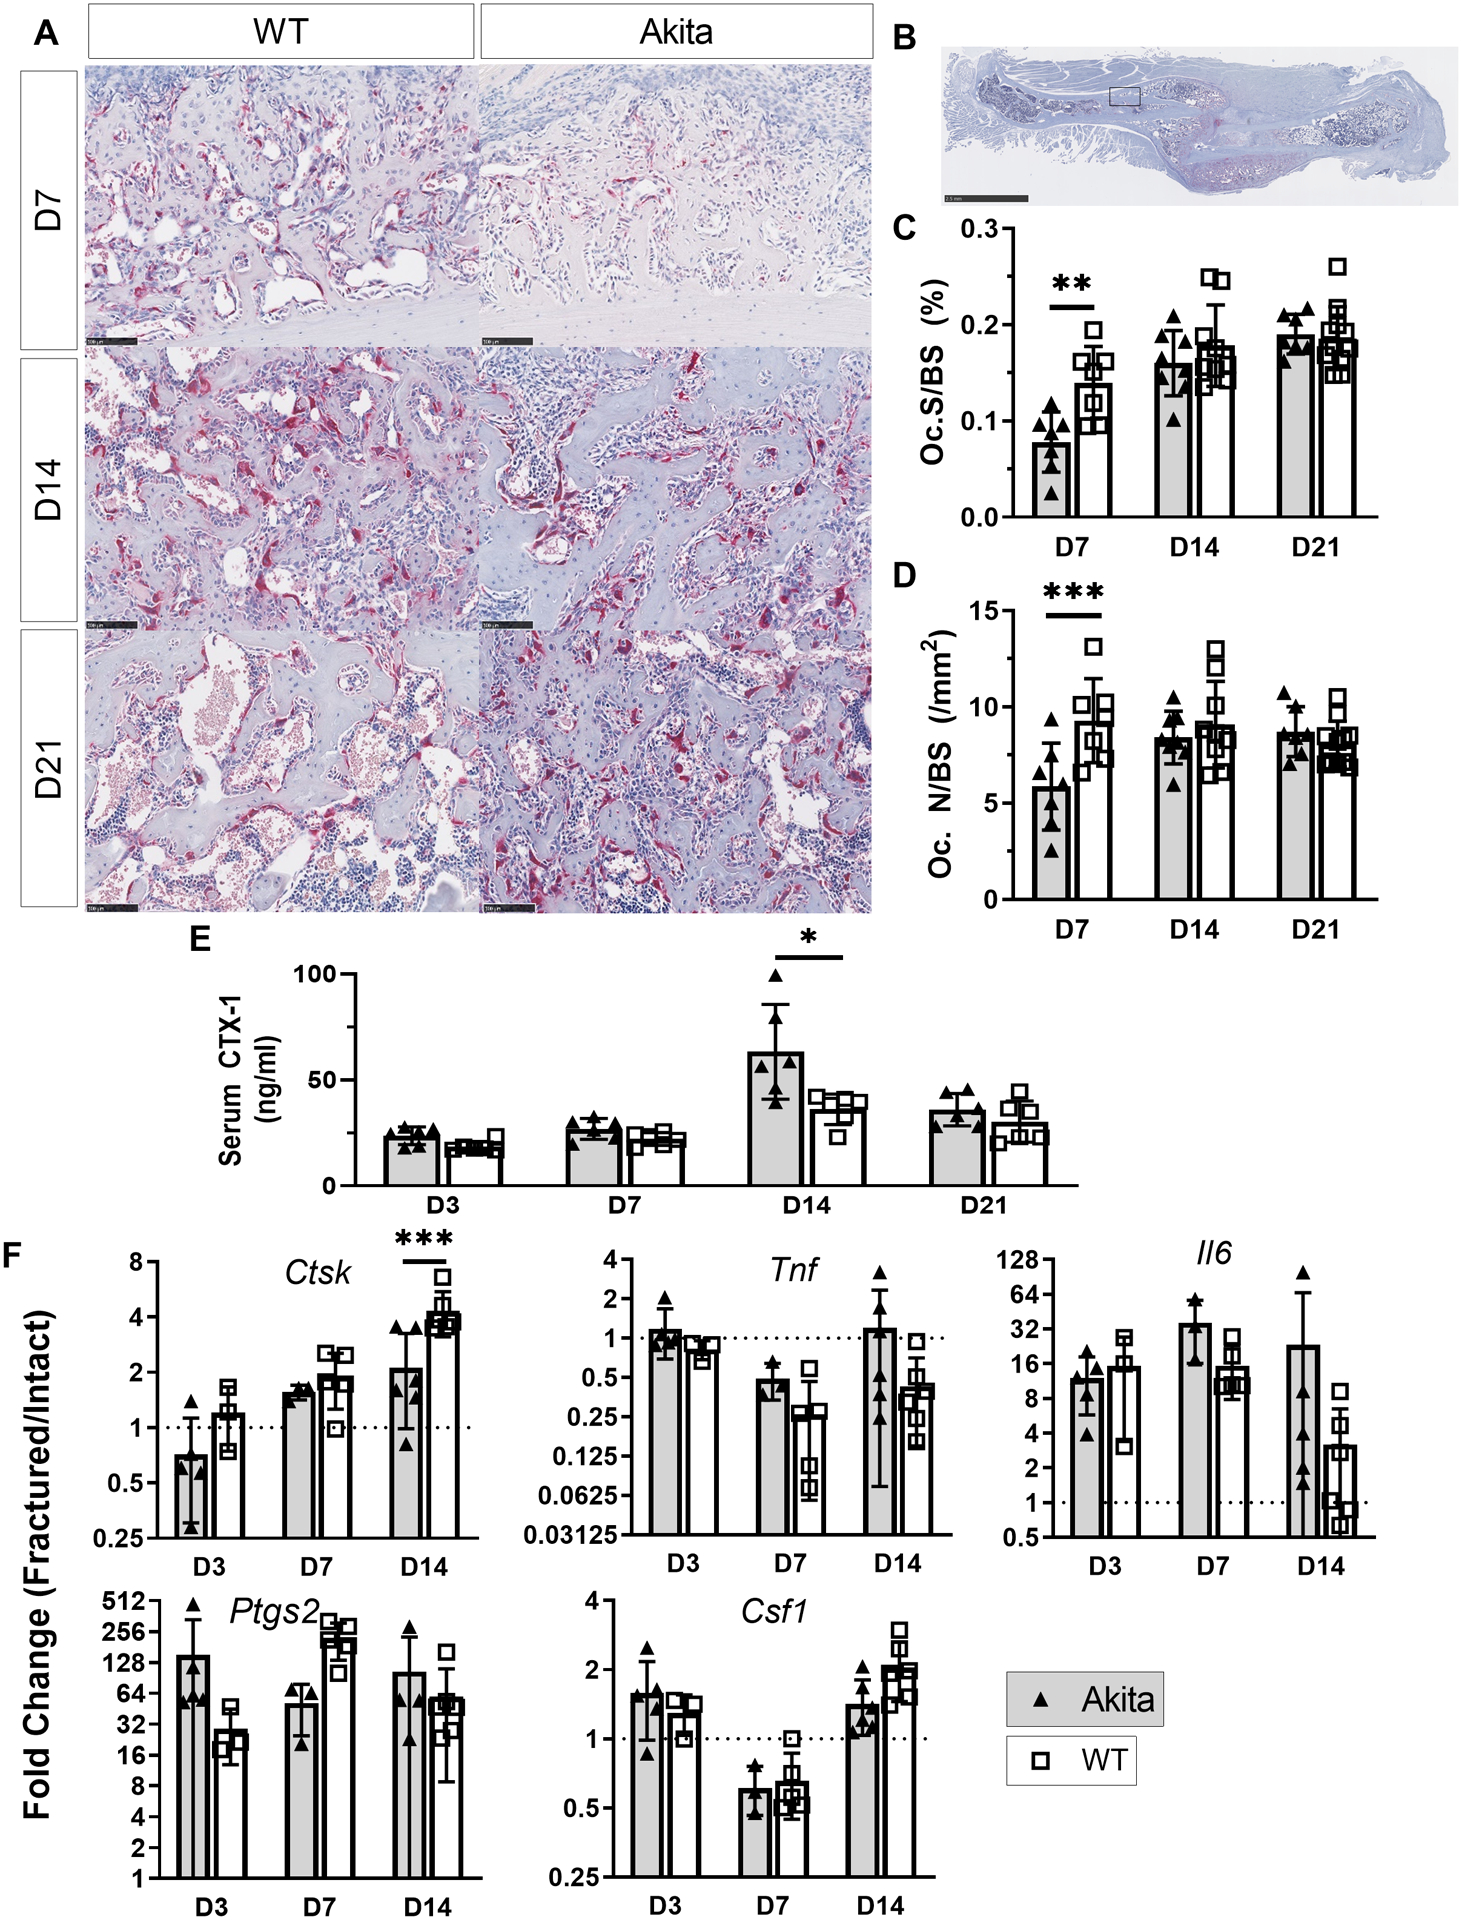
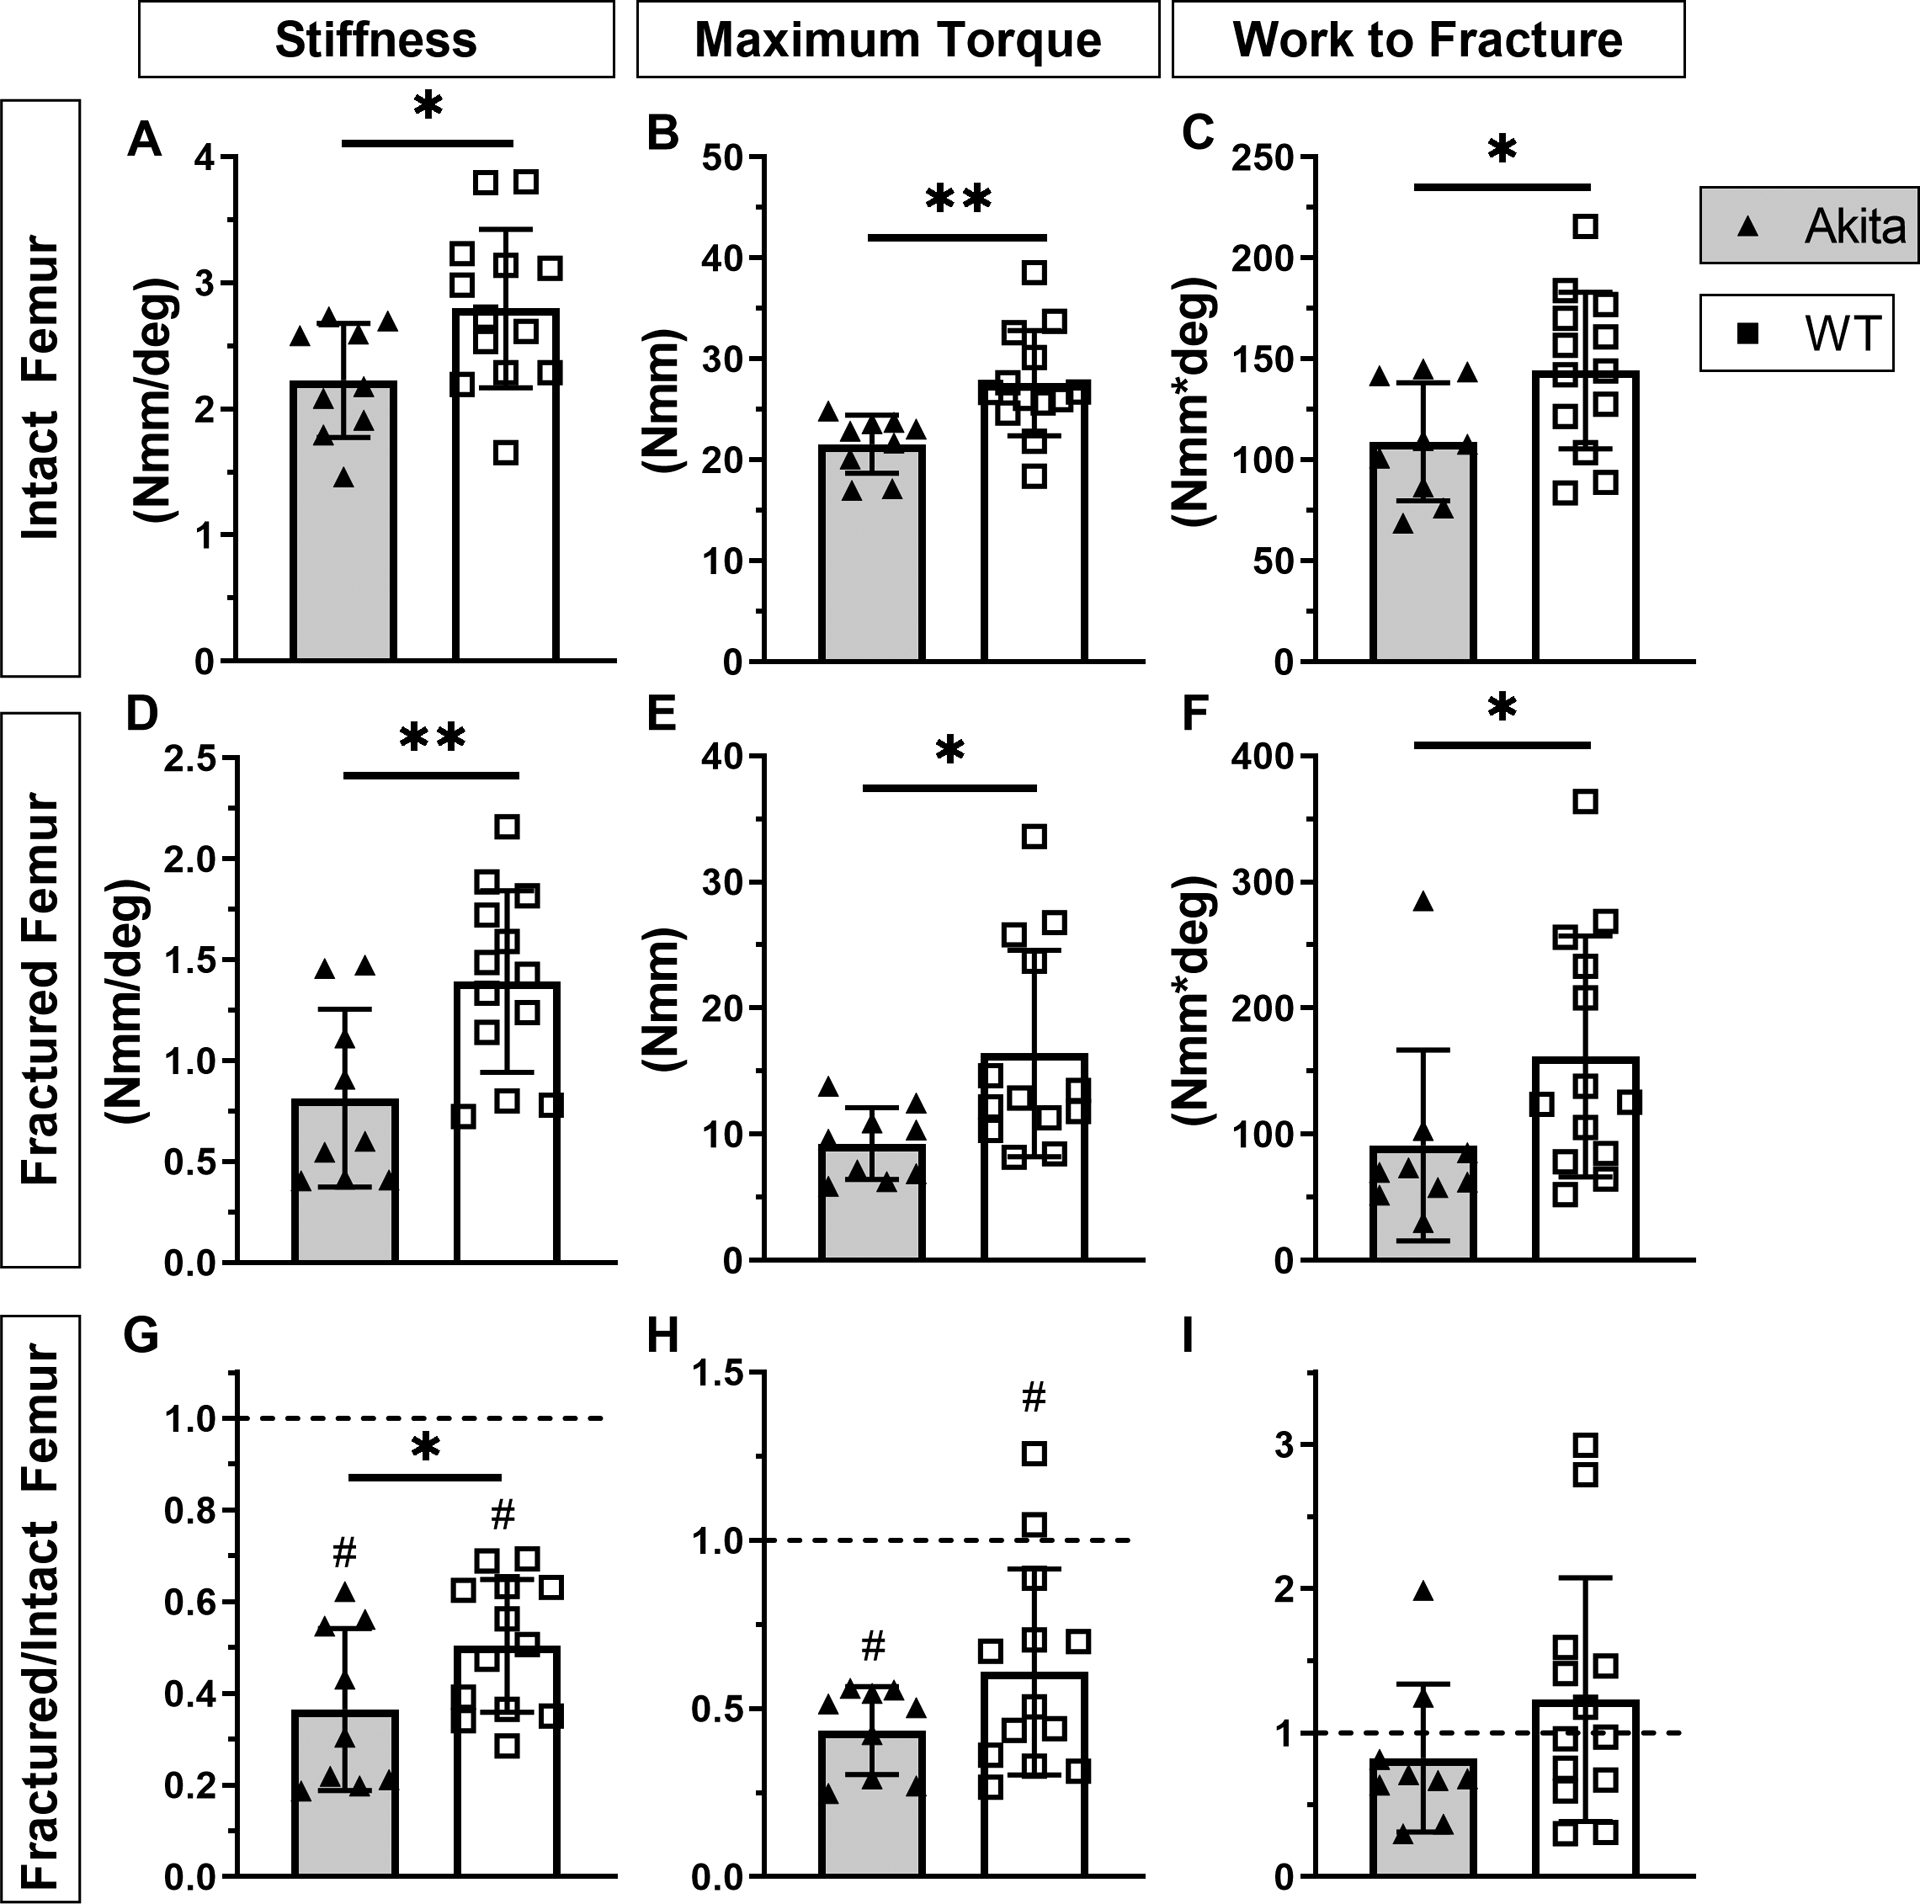
Type 1 diabetes (T1DM) impairs bone formation and fracture healing in humans. Akita mice carry a mutation in one allele of the insulin-2 (Ins2) gene, which leads to pancreatic beta cell dysfunction and hyperglycemia by 5-6 weeks age. We hypothesized that T1DM in Akita mice is associated with decreased bone mass, weaker bones, and impaired fracture healing. Ins2 ± (Akita) and wildtype (WT) males were subjected to femur fracture at 18-weeks age and healing assessed 3-21 days post-fracture. Non-fractured left femurs were assessed for morphology (microCT) and strength (bending or torsion) at 19-21 weeks age. Fractured right femurs were assessed for callus mechanics (torsion), morphology and composition (microCT and histology) and gene expression (qPCR). Both Akita and WT mice gained weight from 3 to 18 weeks age, but Akita mice weighed less starting at 5 weeks (-5.2%, p < 0.05). At 18-20 weeks age Akita mice had reduced serum osteocalcin (-30%), cortical bone area (-16%), and thickness (-17%) compared to WT, as well as reduced cancellous BV/TV (-39%), trabecular thickness (-23%) and vBMD (-31%). Mechanical testing of non-fractured femurs showed decreased structural (stiffness, ultimate load) and material (ultimate stress) properties of Akita bones. At 14 and 21 days post fracture Akita mice had a significantly smaller callus than WT mice (~30%), with less cartilage and bone area. Assessment of torsional strength showed a weaker callus in Akita mice with lower stiffness (-42%), maximum torque (-44%) and work to fracture (-44%). In summary, cortical and cancellous bone mass were reduced in Akita mice, with lower bone mechanical properties. Fracture healing in Akita mice was impaired by T1DM, with a smaller, weaker fracture callus due to decreased cartilage and bone formation. In conclusion, the Akita mouse mimics some of the skeletal features of T1DM in humans, including osteopenia and impaired fracture healing, and may be useful to test interventions.

Keywords: Akita diabetic mouse; Bone formation; Bone strength; Cartilage; Fracture healing.


Figures

Figure 1.
Figure 1.. Male Akita mice are hyperglycemic and hypoinsulinemic.
A) Akita and WT mice had similar initial body weights and both gained weight from 3 to 18 weeks, although Akita mice had 6–9% lower body weight after 6 weeks age (n = 28–40). B) Fasting blood glucose levels indicated that all Akita mice were hyperglycemic by 6 weeks with increased severity at 18 weeks (n = 69–98). C) At 18 weeks Akita mice had a severe insulin deficiency (n = 6). (*p <0.05, ***p<0.001, Akita vs. WT)
Figure 2.
Figure 2.. Akita mice are osteopenic at 21 weeks of age.
A) Representative microCT sections of Akita and WT intact femur cortical bone. B) Akita mice had a slightly shorter femur than WT. C-H) Cortical bone microCT evaluation (n = 8–11) revealed that Akita femurs had reduced total area, bone area, Ct.Th and pMOI compared to WT, while medullary area and TMD were not different between groups. I) Representative 3D reconstruction of Akita and WT cancellous bone from intact distal femur. J-L) Cancellous bone microCT evaluation (n = 7–8) revealed that Akita femurs had reduced trabecular thickness, BV/TV and volumetric BMD. M-N) Serum analysis of bone turnover markers CTX-1 (resorption) and OCN (formation) (n=6). (*p<0.05, ***p<0.001, Akita vs. WT)
Figure 3.
Figure 3.. Whole-bone strength is diminished in Akita bones at 21 weeks.
A) Representative three-point bending force-displacement curves for Akita and WT femurs. B-F) Structural property evaluation (n = 10) revealed that Akita femurs had decreased stiffness, maximum load, and yield load, with increased post-yield displacement. There were no differences in work to fracture. G-I) Material properties calculations of Young’s modulus and yield stress were not different, while ultimate stress was decreased in Akita femurs. (*p<0.05, **p<0.01, Akita vs. WT)
Figure 4.
Figure 4.. Akita mice had diminished bone formation following fracture.
A) Representative x-ray images at days 14 and 21 after fracture. B) Quantification of x-ray images found significantly less union rates at day 21 (p < 0.05 Chi-squared test). C) Representative microCT reconstructions of day 14 and 21 post fracture (6.3mm, 300 slices) and two-dimensional cross sections at the callus midpoint. (These are from the same samples shown in A.) D-G) At day 14 Akita calluses had a significantly lower total volume and bone volume, with significantly higher BV/TV and vBMD (n = 7–9). At day 21 Akita calluses had lower total volume and bone volume, while BV/TV and vBMD were no different (n = 8–10). H) Akita mice had reduced serum OCN levels at day 7, day 14 and day 21 groups (n = 6). I-K) Expression of osteogenic genes was similar on days 3, 7 and 14 between groups, with the exception of Runx2 being lower in Akita at day 14 (n = 3–6). (*p<0.05, **p<0.01, ***p<0.001, Akita vs. WT)
Figure 5.
Figure 5.. Akita mice had impaired cartilage formation after fracture.
A) Representative picrosirius red/Alcian blue staining at days 7, 14 and 21. B-E) Analysis of staining revealed Akita mice had decreased callus area at all time points with decreased woven bone area on day 21, and cartilage area on days 7 and 14 (n = 7–11). F) The expression of chondrogenic genes (Acan, Sox9 and Col2a1) substantially increased after fracture in both Akita and WT. Expression of hedgehog pathway related genes (Ihh, Ptch1 and Gli1) was increased in both groups over time (n = 3–6). (*p<0.05, **p<0.01, ***p<0.001, Akita vs. WT; scale bar 1 mm)
Figure 6.
Figure 6.. Osteoclasts were modestly affected in Akita mice.
A-B) Representative tartrate-resistant acid phosphatase (TRAP) staining at days 7, 14 and 21 post fracture. C-D) Histological analysis revealed Oc.S/BS and Oc.N/BS were decreased in Akita mice on day 7 (n = 7–11). E) Elevated serum CTX-1 levels were observed at day 14 for Akita mice (n = 6). F) Expression of osteoclastogenic and inflammatory genes at days 3, 7 and 14 were not different between groups, with the exception of Ctsk at day 14 (n = 3–6). (*p<0.05, **p<0.01, ***p<0.001, Akita vs. WT; scale bar A: 100 μm, B: 2.5 mm)
Figure 7.
Figure 7.. Akita fracture callus is mechanically inferior.
A-C) Intact Akita femurs had decreased stiffness, maximum torque and work to fracture (n = 10). D-F) At day 21 post fracture healing Akita femurs (fracture callus) had decreased stiffness, maximum torque and work to fracture compared to WT. G-I) Normalized data (fractured/intact) revealed that stiffness and maximum torque for both groups were reduced in fracture compared to intact femur, with a significant decrease in stiffness for Akita compared to WT. Work to fracture recovered to intact levels in both groups. (*p<0.05, **p<0.01, Akita vs. WT; #p<0.01, fracture vs. intact)

References

    1. Alblowi J, Kayal RA, Siqueira M, McKenzie E, Krothapalli N, McLean J, Conn J, Nikolajczyk B, Einhorn TA, Gerstenfeld L, and Graves DT High levels of tumor necrosis factor-alpha contribute to accelerated loss of cartilage in diabetic fracture healing. Am J Pathol 175:1574–85; 2009. - PMC - PubMed
    1. Alharbi MA, Zhang C, Lu C, Milovanova TN, Yi L, Ryu JD, Jiao H, Dong G, O’Connor JP, and Graves DT FOXO1 Deletion Reverses the Effect of Diabetic-Induced Impaired Fracture Healing. Diabetes 67:2682–2694; 2018. - PMC - PubMed
    1. Botolin S, and McCabe LR Bone loss and increased bone adiposity in spontaneous and pharmacologically induced diabetic mice. Endocrinology 148:198–205; 2007. - PubMed
    1. Carvalho FR, Calado SM, Silva GA, Diogo GS, Moreira da Silva J, Reis RL, Cancela ML, and Gavaia PJ Altered bone microarchitecture in a type 1 diabetes mouse model Ins2(Akita). J Cell Physiol 234:9338–9350; 2019. - PubMed
    1. Chiang JL, Kirkman MS, Laffel LM, Peters AL, and Type 1 Diabetes Sourcebook, A. Type 1 diabetes through the life span: a position statement of the American Diabetes Association. Diabetes Care 37:2034–54; 2014. - PMC - PubMed

Publication types