. 2021 Sep;41(9):2295-2310.
doi: 10.1177/0271678X21994395. Epub 2021 Mar 4.

Activation of astroglial CB1R mediates cerebral ischemic tolerance induced by electroacupuncture

Affiliations

Activation of astroglial CB1R mediates cerebral ischemic tolerance induced by electroacupuncture

Cen Yang et al. J Cereb Blood Flow Metab. 2021 Sep.

Abstract

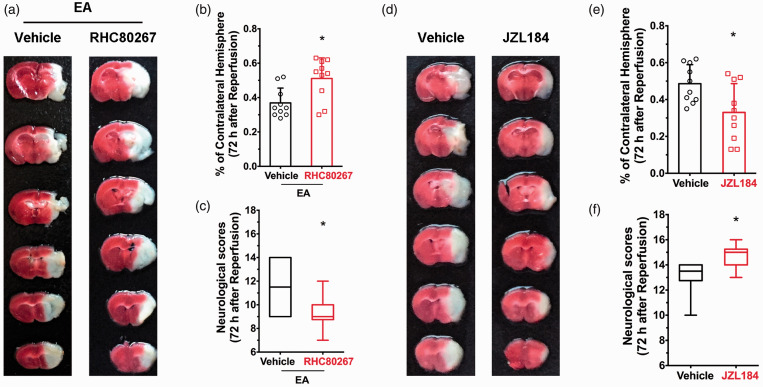
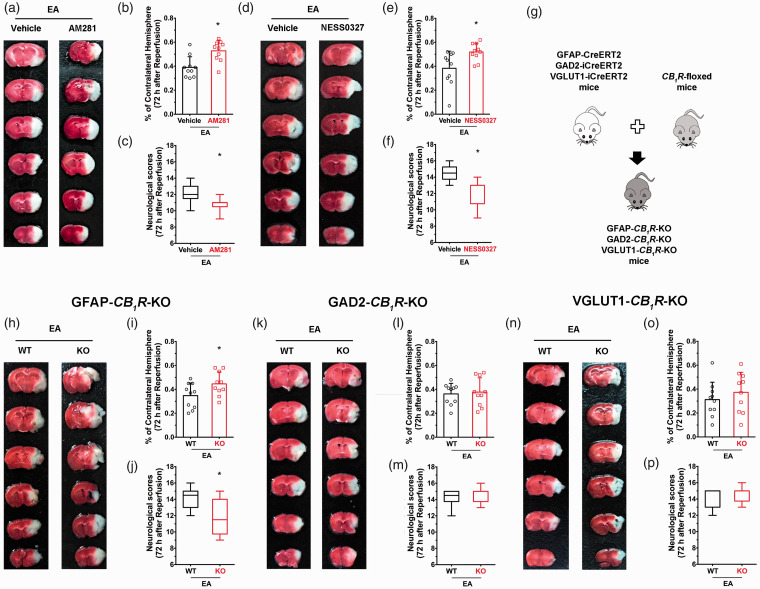
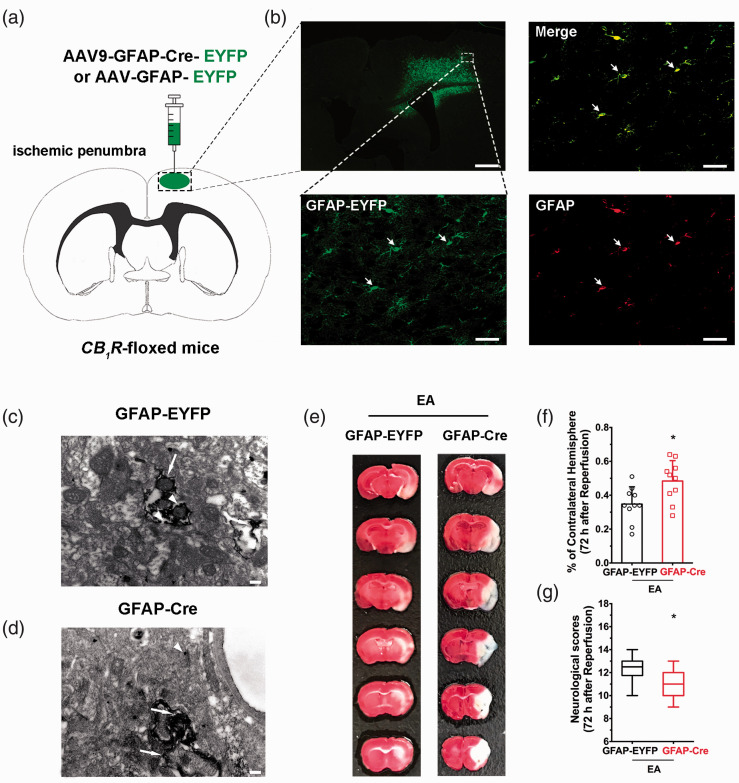
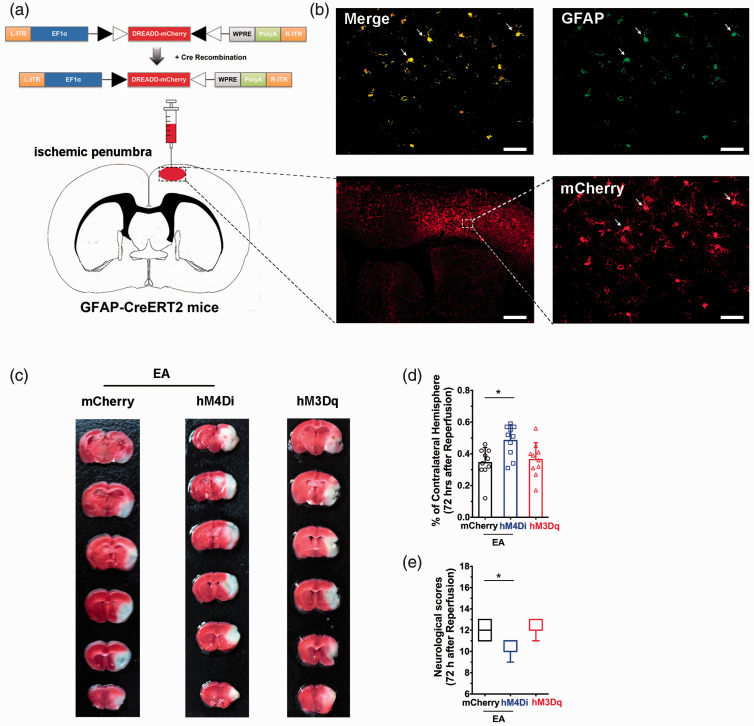
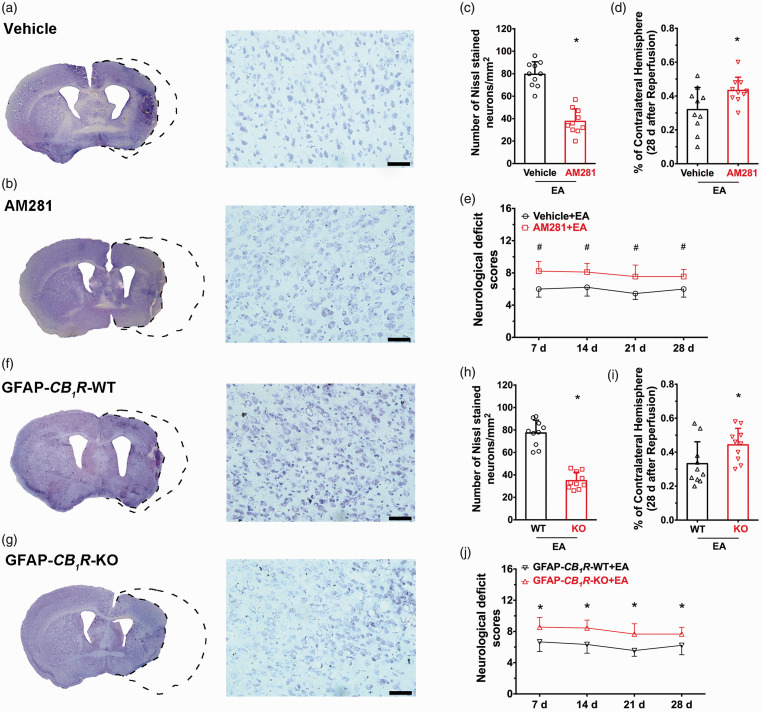
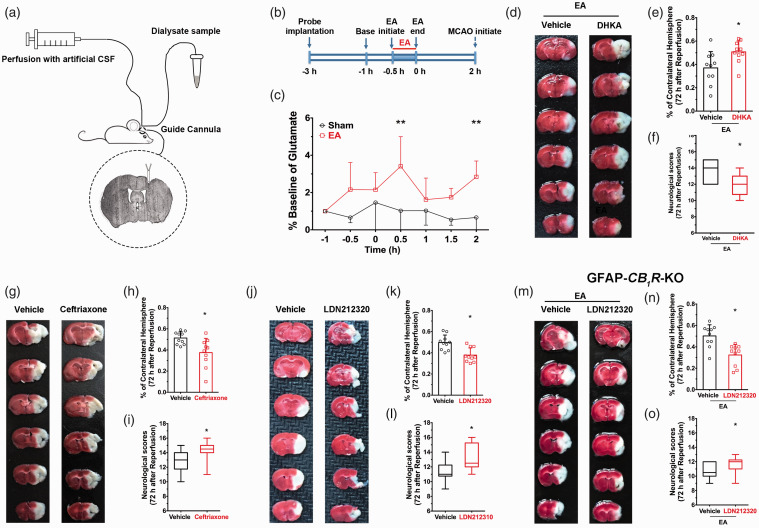
There are no effective treatments for stroke. The activation of endogenous protective mechanisms is a promising therapeutic approach, which evokes the intrinsic ability of the brain to protect itself. Accumulated evidence strongly suggests that electroacupuncture (EA) pretreatment induces rapid tolerance to cerebral ischemia. With regard to mechanisms underlying ischemic tolerance induced by EA, many molecules and signaling pathways are involved, such as the endocannabinoid system, although the exact mechanisms have not been fully elucidated. In the current study, we employed mutant mice, neuropharmacology, microdialysis, and virus transfection techniques in a middle cerebral artery occlusion (MCAO) model to explore the cell-specific and brain region-specific mechanisms of EA-induced neuroprotection. EA pretreatment resulted in increased ambient endocannabinoid (eCB) levels and subsequent activation of ischemic penumbral astroglial cannabinoid type 1 receptors (CB1R) which led to moderate upregulation of extracellular glutamate that protected neurons from cerebral ischemic injury. These findings provide a novel cellular mechanism of EA and a potential therapeutic target for ischemic stroke.

Keywords: Astrocyte; CB1R; electroacupuncture; pretreatment; stroke.


Conflict of interest statement

Declaration of conflicting interests: The author(s) declared no potential conflicts of interest with respect to the research, authorship, and/or publication of this article.

Figures

Figure 1.
Figure 1.
2-AG mediates EA-induced neuroprotection. (a) Representative images showing infarct tissue following pretreatment with RHC80687 and vehicle. (b,c) EA-induced neuroprotection was abolished by pretreatment of RHC80687 with increased infarct volume (b) and lower neurological scores (c) compared with the vehicle group, induced by focal cerebral ischemia for 60 min. (d) Representative images showing infarct tissue following pretreatment with JZL184 and vehicle. (e,f) JZL184 pretreatment protected the ischemic penumbra from 60 min focal cerebral ischemia with smaller infarct volume (e) and higher neurological scores (f). Infarct volume graphs show mean ± SD; n = 10 mice/group. *p < 0.05 vs. vehicle or wild-type littermates, t-test ((b): p = 0.016; (e): p = 0.019). Neurological behavioral scores show median (range) values; group differences tested using the Kruskal–Wallis test followed by the Mann–Whitney U test. *p < 0.05 vs. vehicle, U test ((c): p = 0.0013; (f): p = 0.019).
Figure 2.
Figure 2.
Ischemic penumbra astroglial CB1R mediates the neuroprotective effects of EA pretreatment. (a) Representative images from AM281 and vehicle groups. (b–f) Blocking CB1R with either AM281 or NESS0327 abolished the neuroprotective effect of EA pretreatment. (g) schematic showing generation of cell specific CB1R deletion mice. (h) Representative images from GFAP-CB1R-KO and WT groups. (i,j) CB1R deletion in astrocytes abolished the neuroprotective effect of EA pretreatment. (k–p) EA pretreatment did not produce neuroprotection both in GAD2-CB1R-KO mice and VGLUT1-CB1R-KO mice compared with their wild-type littermates. Infarct volume graphs show mean ± SD, n = 10 mice/group. *p < 0.05 vs. wild-type littermates, t-test ((b): p = 0.0023; (e): p = 0.0069; (i): p = 0.04; (l): p = 0.92; (o): p = 0.39). Neurological behavioral score graphs show median (range) values; group differences were tested with the Kruskal–Wallis test followed by the Mann–Whitney U test. *p < 0.05 vs. vehicle, U test ((c): p = 0.0093; (f): p = 0.01; (j): p = 0.016; (m): p = 0.58; (p): p = 0.68).
Figure 3.
Figure 3.
Ischemic penumbral astroglial CB1R mediates the neuroprotective effects of EA pretreatment. (a) Schematic showing intra-ischemic penumbra injection of GFAP-Cre-EYFP or GFAP-EYFP virus in CB1R-floxed mutant mice. (b) Coronal brain section showing the scope with green (GFAP-EYFP) fluorescence in the right ischemic penumbra after microinjection of different viruses. Corresponding magnified images (40×) of the box in showing the virus (green), GFAP (red) and merge (yellow). Scale bar = 50 μm. (c,d) Electron microscopic images used to detect whether astroglial CB1R is knocked out in the ischemic penumbra on CB1R-floxed mice, showing a high density of CB1R immune-positive silver grains (small arrows) in axons/terminals of GFAP-EYFP (c) but not in GFAP-Cre (d) mice. Scale bar = 200 nm. (e) Representative images showing infarct volume in GFAP-EYFP and GFAP-Cre mice. (f,g) Astroglial CB1R deletion in ischemic penumbral abolishes the neuroprotective effect of EA pretreatment induced by focal cerebral ischemia for 60 min. Infarct volume graphs show mean ± SD, n = 10 mice/group. *p < 0.05 vs. GFAP-EYFP group, t-test ((f): p = 0.013). Neurological behavioral score graphs show median (range) values; group differences were tested with the Kruskal–Wallis test followed by the Mann–Whitney U test. *p < 0.05 vs. GFAP-EYFP group, U test ((g): p = 0.02).
Figure 4.
Figure 4.
Ischemic penumbral astrocytes mediate the neuroprotective effects of EA pretreatment. (a) Schematic showing intra-ischemic penumbra injection of DREADD virus in GFAP-Cre mice. (b) Coronal brain section shows the scope with red (mCherry) fluorescence in the right ischemic penumbra after microinjection of different viruses. (c–e) corresponding magnified images (40×) of the box in (b) showing mCherry (red), GFAP, and merge (yellow). Scale bars = 50 µm. (c) Representative images comparing infarct volume in mCherry, hM4Di, and hM3Dq groups. (d,e) Activation of ischemic penumbral astrocytes decreased infarct volume (d) and improved neurological scores (e) induced by focal cerebral ischemia for 60 min. By contrast, inhibition of ischemic penumbral astrocytes decreased infarct volume (d) and decreased neurological scores (e) after EA pretreatment. Infarct volume graphs show means ± SD, n = 10 mice/group, *p < 0.05 vs. mCherry group, one-way ANOVA ((d): p = 0.0023; hM4Di vs mCherry; p > 0.999; hM3Dq vs. mCherry). Neurological behavioral score graphs show median (range) values; group differences were tested with the Kruskal–Wallis test followed by the Mann–Whitney U test. *p < 0.05 vs. mCherry group, U test ((e): p = 0.0092; hM4Di vs. mCherry; p > 0.999; hM3Dq vs. mCherry).
Figure 5.
Figure 5.
Ischemic penumbra astroglial CB1R mediates the long-term neuroprotective effect of EA pretreatment. (a,b) Left images represent coronal sections of Nissl staining in (a) vehicle or (b) AM281 groups; Right images show higher magnifications (20×) of the images on the left. (c) Neuronal density ratio in the left/right cerebral cortex. EA-induced long-term neuroprotection is abolished by pretreatment with AM281 compared to the vehicle group, showing decreased infarct volume (d) and neurological deficit scores (e) induced by focal cerebral ischemia for 60 min. (f,g) Left images represent coronal sections of Nissl staining in the GFAP-CB1R-WT (f) or GFAP-CB1R-KO (g) groups; Right images show a higher magnification (20×) of the images on the left. (h) Neuronal density ratio in the left/right cerebral cortex. EA-induced long-term neuroprotection is abolished by pretreatment with GFAP-CB1R-KO mice compared to wild-type littermates, showing decreased infarct volume (i) and neurological deficit scores (j) induced by focal cerebral ischemia for 60 min. Infarct volume graphs show mean ± SD, n = 10 mice/group. *p < 0.05 vs. vehicle or wild-type littermates, t-test ((c): p < 0.0001; (d): p = 0.03 (h): p < 0.0001; (i): p = 0.04). Neurological deficit scores graphs show median (range) values; group differences were tested using the Kruskal–Wallis test followed by the Mann–Whitney U test. *p < 0.05 vs. wild-type littermates, U test ((e): p = 0.004; (i): p = 0.005).
Figure 6.
Figure 6.
Pharmacological activation of EAAT2 restores EA-induced neuroprotective effect in astroglial CB1R deficient mice by mediating the ambient glutamate. (a) Photomicrograph of the representative location of the tip of microdialysis probe in the ischemic penumbra. The vertical black arrow indicates the guide cannula and the lower black arrow represents the tip of microdialysis probe (microdialysis probe is 1 mm longer than guide cannula). (b) Timeline showing microdialysis experimental procedure. (c) EA pretreatment raised extracellular glutamate level in the ischemic penumbra 0.5 h and 2 h after administration of EA compared with the sham group (*p 0.5 h= 0.025 vs. sham, *p 2 h< 0.007 vs. sham, (c). (d–f) Pharmacological approaches were used to detect the role of EAAT2 in EA-induced neuroprotection. (d) Representative images comparing infarct volume in vehicle and DHKA (e,f) Inhibition of EAAT2 abolished the neuroprotective effect of EA pretreatment. (g,j) Representative images comparing infarct volume in vehicle and ceftriaxone (g) and in vehicle and LDN212320 (j). Activation of EAAT2 either by LDN212320 or Ceftrixone decreased infarct volume (h,k) and improved neurological scores (i,l). (m–o) LDN212320 restored EA-induced neuroprotection in the GFAP-CB1R-KO mice showing decreased infarct volume (n) and improved neurological scores (o) after MCAO compared with the vehicle group. Group differences in baseline dialysate glutamate concentrations were evaluated using one-way ANOVA with EA treatment as the between-subjects factor. Subsequently, per treatment dialysate glutamate levels were transformed to percentages of mean baseline dialysate concentration (set at 100%) for evaluation of changes in dialysate glutamate content following EA treatment as performed by ANOVA with repeated measures over time. In the case of significant overall effects, a Bonferroni multiple comparison test was used for post-hoc comparisons. Infarct volume graphs are shown as mean ± SD, n = 10 mice/group. *p < 0.05 vs. vehicle, t-test ((e): p = 0.001; (h): p = 0.0083; (k): p = 0.01; (n): p = 0.001). Neurological behavioral scores graphs show median (range) values; group differences were tested using the Kruskal–Wallis test followed by the Mann–Whitney U test. *p < 0.05 vs. vehicle, U test ((f): p = 0.019; (i): p = 0.02; (l): p = 0.01; (o): p = 0.04).

Similar articles

Cited by

References

    1. Johnston SC, Mendis S, Mathers CD.Global variation in stroke burden and mortality: estimates from monitoring, surveillance, and modelling. Lancet Neurol 2009; 8: 345–354. - PubMed
    1. Hoyert DL, Xu J.Deaths: preliminary data for 2011. Natl Vital Stat Rep 2012; 61: 1–51. - PubMed
    1. Mozaffarian D, Benjamin EJ, Go AS, et al.. Heart disease and stroke statistics-2016 update: a report from the American Heart Association. Circulation 2016; 133: e38–e360. - PubMed
    1. Chen G, Leak RK, Sun Q, et al.. Neurobiology of stroke: research progress and perspectives. Prog Neurobiol 2018; 163-164: 1–4. 4. - PubMed
    1. Powers WJ, Rabinstein AA, Ackerson T, et al.. 2018 Guidelines for the early management of patients with acute ischemic stroke: a guideline for healthcare professionals from the American Heart Association/American Stroke Association. Stroke 2018; 49: e46–e110. - PubMed

Publication types

Substances

LinkOut - more resources