. 2021 Mar 4;13(1):55.
doi: 10.1186/s13195-021-00794-8.

Genome-wide epistasis analysis for Alzheimer's disease and implications for genetic risk prediction

Affiliations

Genome-wide epistasis analysis for Alzheimer's disease and implications for genetic risk prediction

Hui Wang et al. Alzheimers Res Ther. .

Abstract

Background: Single-nucleotide polymorphisms (SNPs) identified by genome-wide association studies only explain part of the heritability of Alzheimer's disease (AD). Epistasis has been considered as one of the main causes of "missing heritability" in AD.

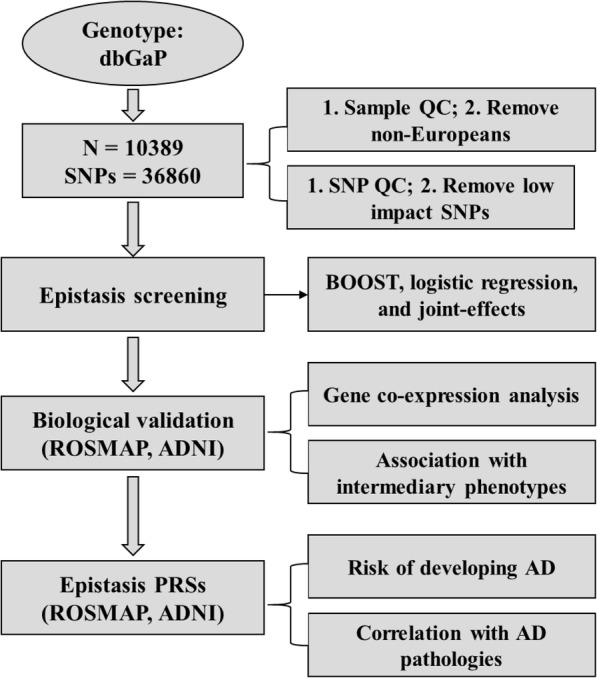
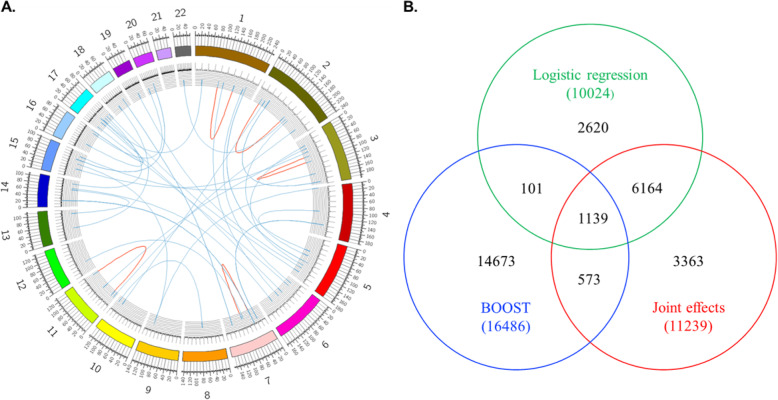
Methods: We performed genome-wide epistasis screening (N = 10,389) for the clinical diagnosis of AD using three popularly adopted methods. Subsequent analyses were performed to eliminate spurious associations caused by possible confounding factors. Then, candidate genetic interactions were examined for their co-expression in the brains of AD patients and analyzed for their association with intermediate AD phenotypes. Moreover, a new approach was developed to compile the epistasis risk factors into an epistasis risk score (ERS) based on multifactor dimensional reduction. Two independent datasets were used to evaluate the feasibility of ERSs in AD risk prediction.

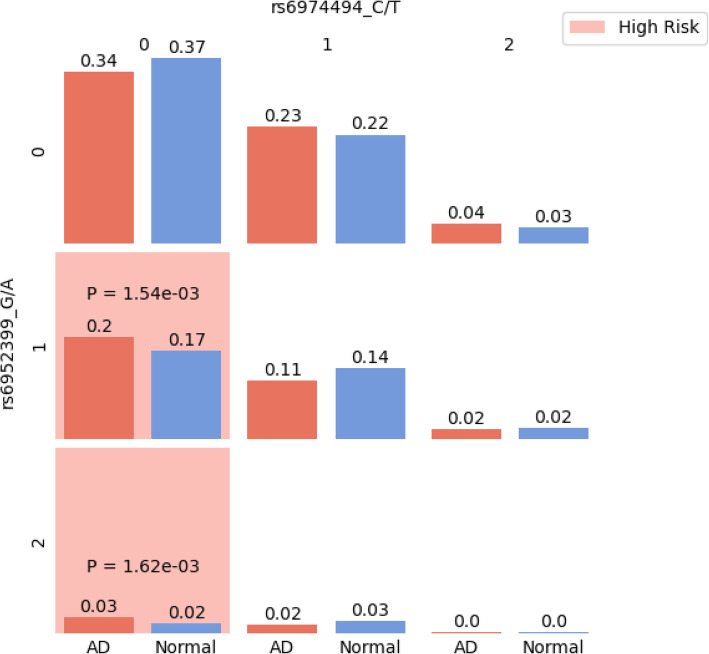
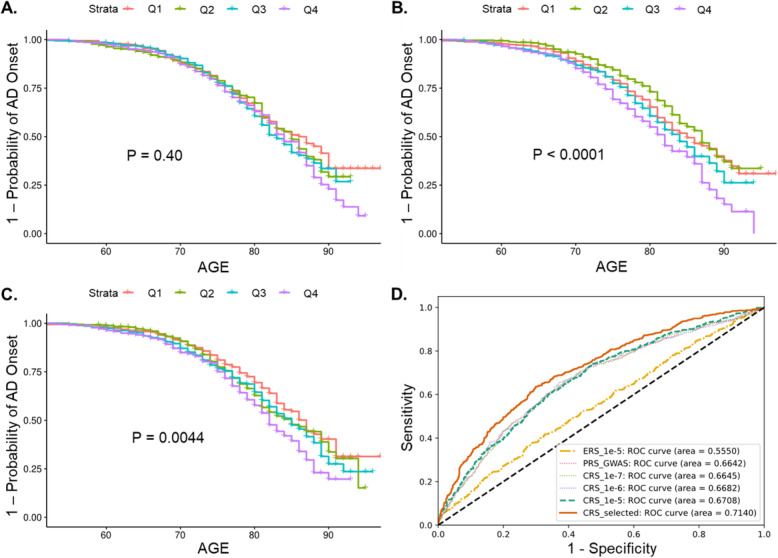
Results: We identified 2 candidate genetic interactions with PFDR < 0.05 (RAMP3-SEMA3A and NSMCE1-DGKE/C17orf67) and another 5 genetic interactions with PFDR < 0.1. Co-expression between the identified interactions supported the existence of possible biological interactions underlying the observed statistical significance. Further association of candidate interactions with intermediate phenotypes helps explain the mechanisms of neuropathological alterations involved in AD. Importantly, we found that ERSs can identify high-risk individuals showing earlier onset of AD. Combined risk scores of SNPs and SNP-SNP interactions showed slightly but steadily increased AUC in predicting the clinical status of AD.

Conclusions: In summary, we performed a genome-wide epistasis analysis to identify novel genetic interactions potentially implicated in AD. We found that ERS can serve as an indicator of the genetic risk of AD.

Keywords: Alzheimer’s disease; Association studies in genetics; Gene expression studies; Polygenic risk score.


Conflict of interest statement

The authors declare that they have no competing interests.

Figures

Fig. 1
Fig. 1
The workflow of our genetic interaction screening and validation procedures. AD, Alzheimer’s disease; BOOST, Boolean operation-based screening and testing; ADNI: the Alzheimer’s Disease Neuroimaging Initiative; dbGaP, the database of Genotypes and Phenotypes; PRS, polygenic risk score; ROSMAP: the Religious Orders Study and the Rush Memory and Aging Project; SNP, single nucleotide polymorphism
Fig. 2
Fig. 2
Genetic interactions identified by the three adopted methods. a Interactions with P value smaller than 1 × 10−8 are shown. Interactions within the same chromosome are marked in red. The histogram shows the interaction density. b There are 1139 common genetic interactions identified by all three methods (P < 1 × 10 −5). Genetic interactions identified by BOOST are often different from the other two methods
Fig. 3
Fig. 3
Visualization of rs6952399-rs6974494 interaction. The ratio of case and control in each cell is shown. Cells with significantly higher cases than controls by fisher’s exact test are marked red. The counted allele for rs6952399 is G. The counted allele for rs6974494 is C
Fig. 4
Fig. 4
Performance of epistasis risk scores (ERSs), polygenic risk scores (PRSs), and combined risk scores (CRSs) in AD risk prediction using samples from ADNI. Samples were divided into four quantiles (Q1 to Q4: from the lowest risk to the highest risk) based on their ERSs. The probability of developing AD was analyzed by the Kaplan-Meier method, where the P value was obtained by the log-rank test. ERSs were obtained via interactions with a P < 1 × 10−7 (298 interactions), b P < 1 × 10−6 (2478 interaction), or c P < 1 × 10−5 (19,264 interactions). d Comparison of AUCs of ERSs, PRSs, and CRSs in identifying AD patients. ERS_1e-5: ERSs constructed by genetic interactions with P value smaller than 1 × 10−5; PRS_GWAS: PRSs constructed by APOE (rs7412 and rs429358) and 20 SNPs identified by previous GWAS; CRS_1e-7, CRS_1e-6, CRS_1e-5: combined risk score of SNPs and SNP-SNP interactions with P value smaller than 1 × 10−7, 1 × 10−6, or 1 × 10−5; CRS_selected: similar to CRS_1e-5, except that only 77 genetic interactions showing non-random effects in ROS/MAP and ADNI were included
Fig. 5
Fig. 5
Associations between CRSs_1e-5 (combined risk scores constructed by genetic interactions with P < 1 × 10−5) and Alzheimer’s disease pathologies. a CRSs were negatively correlated with CSF Aβ1–42 (AD (n = 388): R = −0.41, P = 8.4 × 10−17; non-AD (n = 655): R = − 0.35, P = 7.1 × 10−20). b CRSs showed a positive correlation with CSF total tau (AD (n = 388): R = 0.088, P = 0.082; non-AD (n = 655): R = 0.19, P = 5.8 × 10−7). c CRSs showed a positive correlation with phosphorylated tau (AD (n = 388): R = 0.12, P = 0.018; non-AD (n = 655): R = 0.23, P = 2.3 × 10−9)

References

    1. Qiu C, Kivipelto M, von Strauss E. Epidemiology of Alzheimer’s disease: occurrence, determinants, and strategies toward intervention. Dialogues Clin Neurosci. 2009;11:111–128. doi: 10.31887/DCNS.2009.11.2/cqiu. - DOI - PMC - PubMed
    1. Hardy JA, Higgins GA. Alzheimer’s disease: the amyloid cascade hypothesis. Science. 1992;256:184–186. doi: 10.1126/science.1566067. - DOI - PubMed
    1. Jansen IE, Savage JE, Watanabe K, Bryois J, Williams DM, Steinberg S, et al. Genome-wide meta-analysis identifies new loci and functional pathways influencing Alzheimer’s disease risk. Nat Genet. 2019;51:404–413. doi: 10.1038/s41588-018-0311-9. - DOI - PMC - PubMed
    1. Lambert J-C, Ibrahim-Verbaas CA, Harold D, Naj AC, Sims R, Bellenguez C, et al. Meta-analysis of 74,046 individuals identifies 11 new susceptibility loci for Alzheimer’s disease. Nat Genet. 2013;45:1452–1458. doi: 10.1038/ng.2802. - DOI - PMC - PubMed
    1. Kunkle BW, Grenier-Boley B, Sims R, Bis JC, Damotte V, Naj AC, et al. Genetic meta-analysis of diagnosed Alzheimer’s disease identifies new risk loci and implicates Aβ, tau, immunity and lipid processing. Nat Genet. 2019;51:414–430. doi: 10.1038/s41588-019-0358-2. - DOI - PMC - PubMed

Publication types