. 2021 Mar 4;6(57):eabg6461.
doi: 10.1126/sciimmunol.abg6461.

SARS-CoV-2 mutations in MHC-I-restricted epitopes evade CD8+ T cell responses

Affiliations

SARS-CoV-2 mutations in MHC-I-restricted epitopes evade CD8+ T cell responses

Benedikt Agerer et al. Sci Immunol. .

Abstract

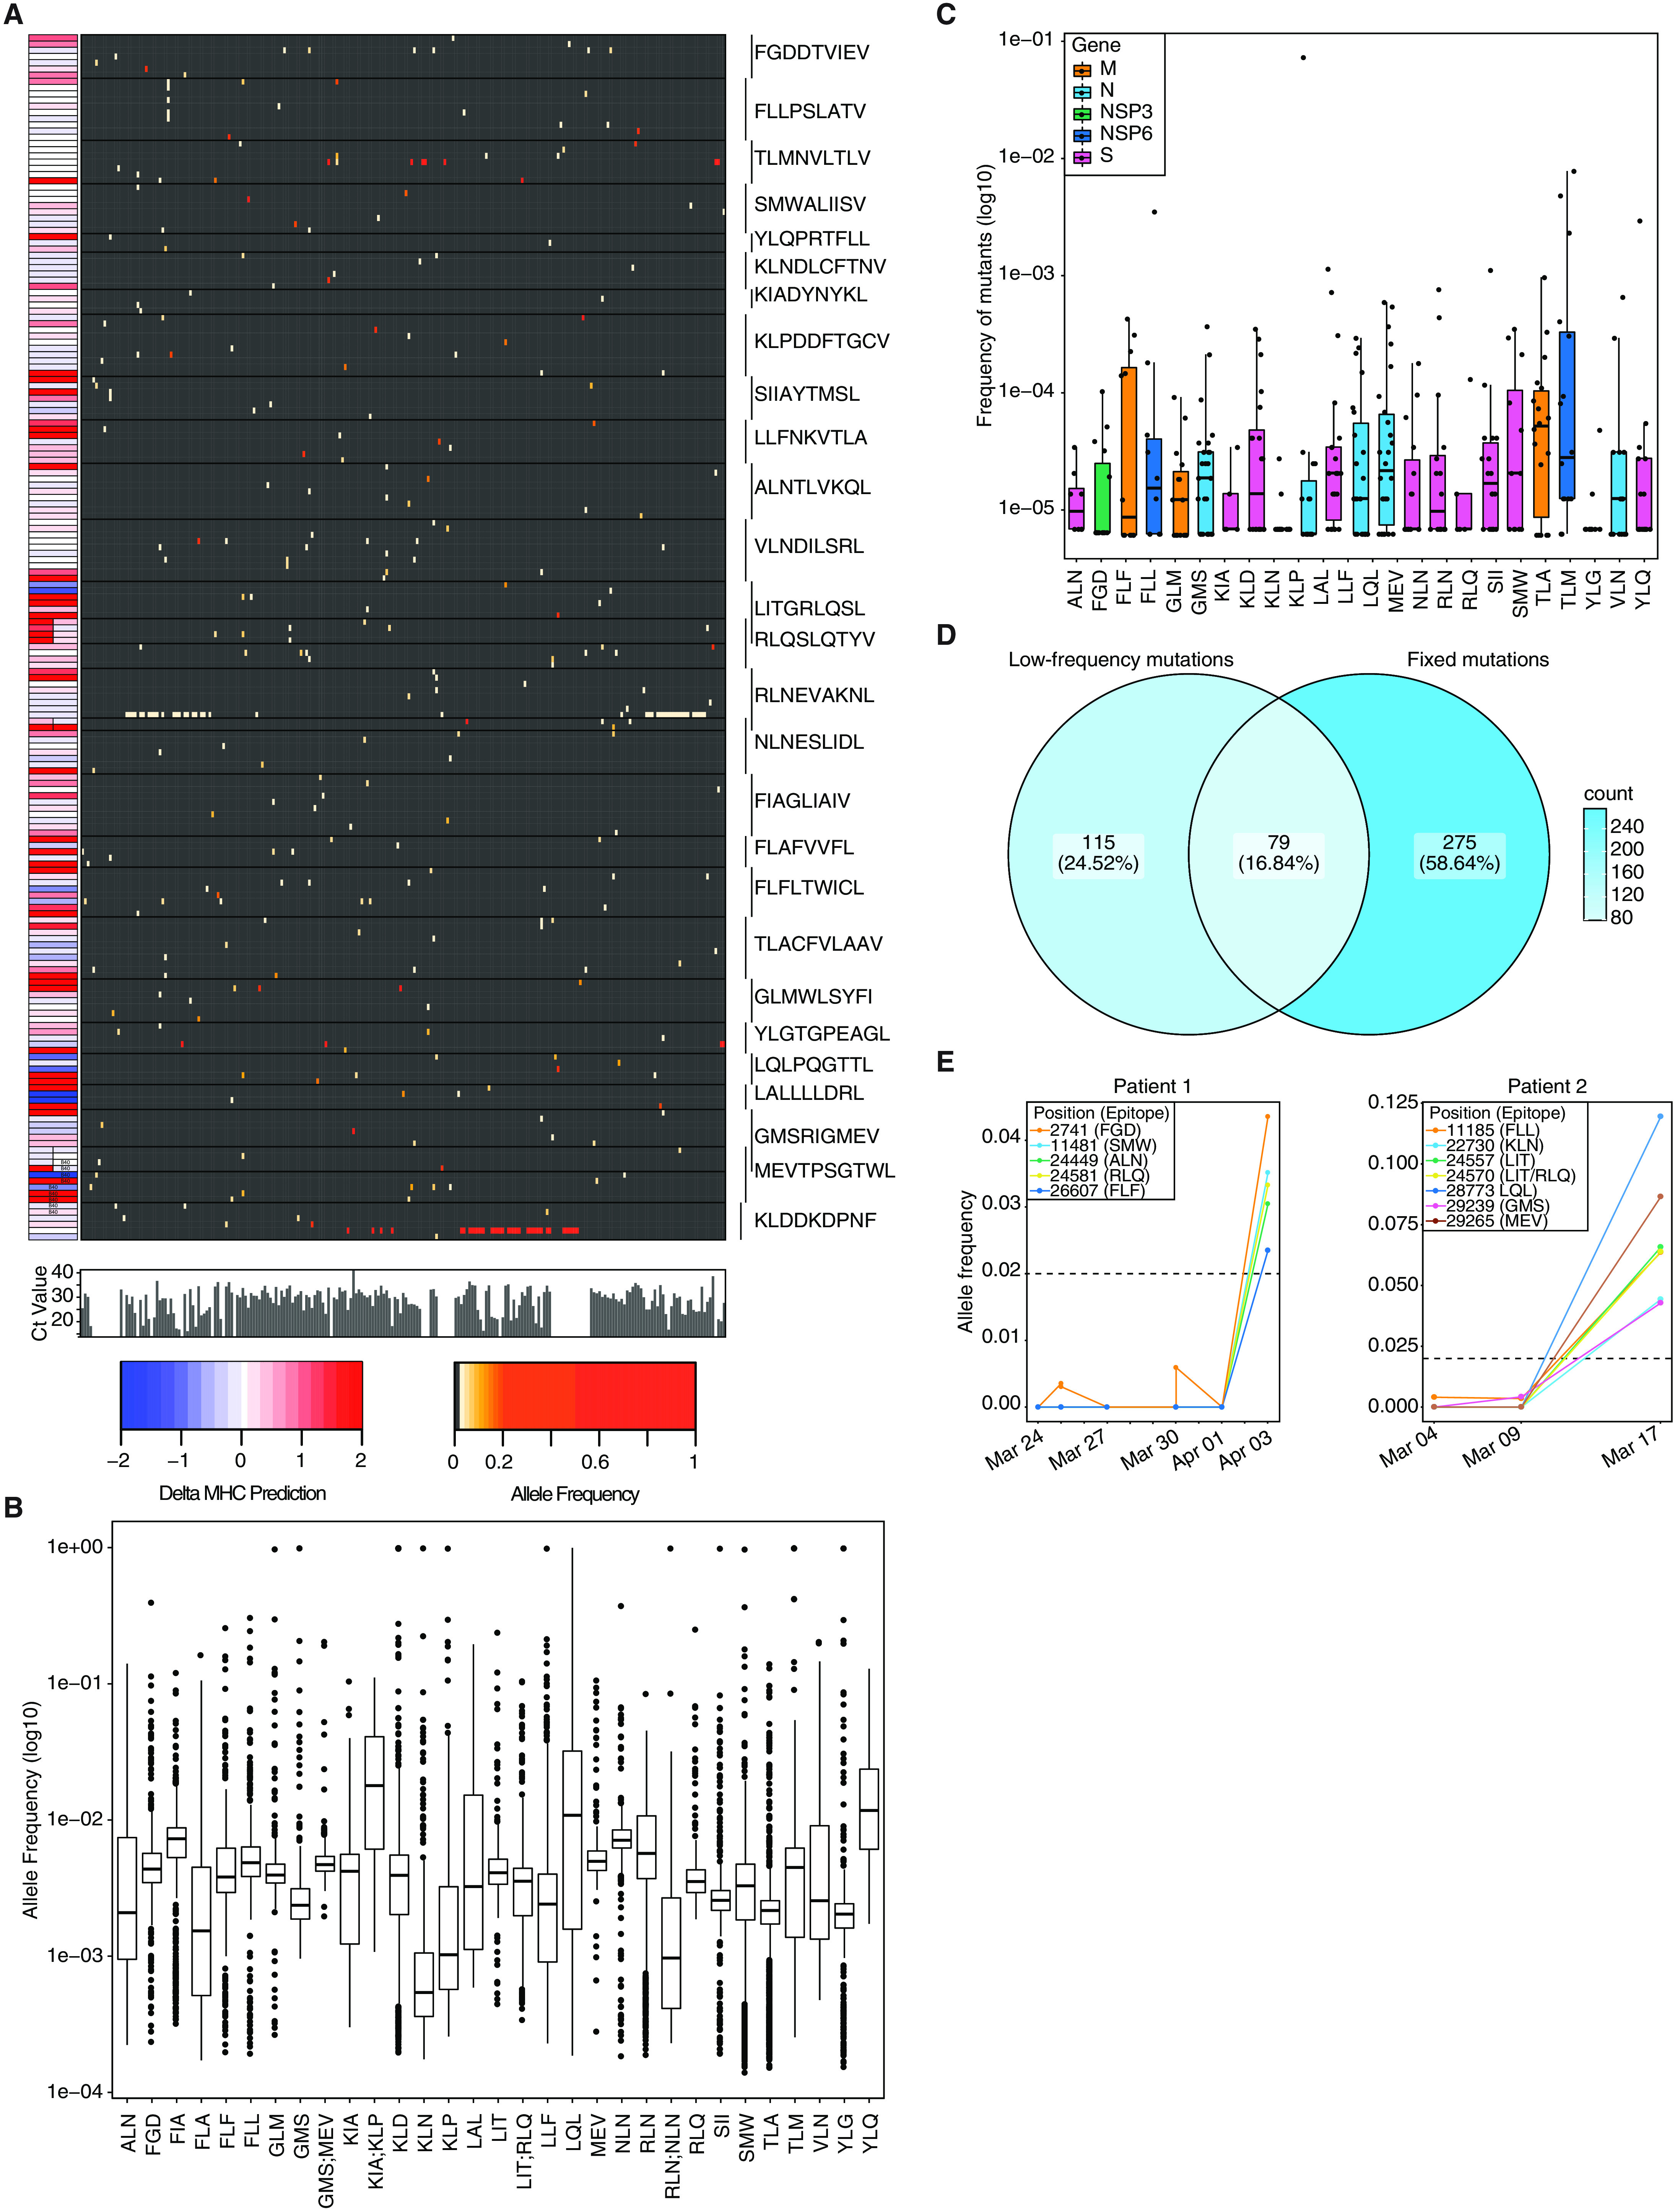
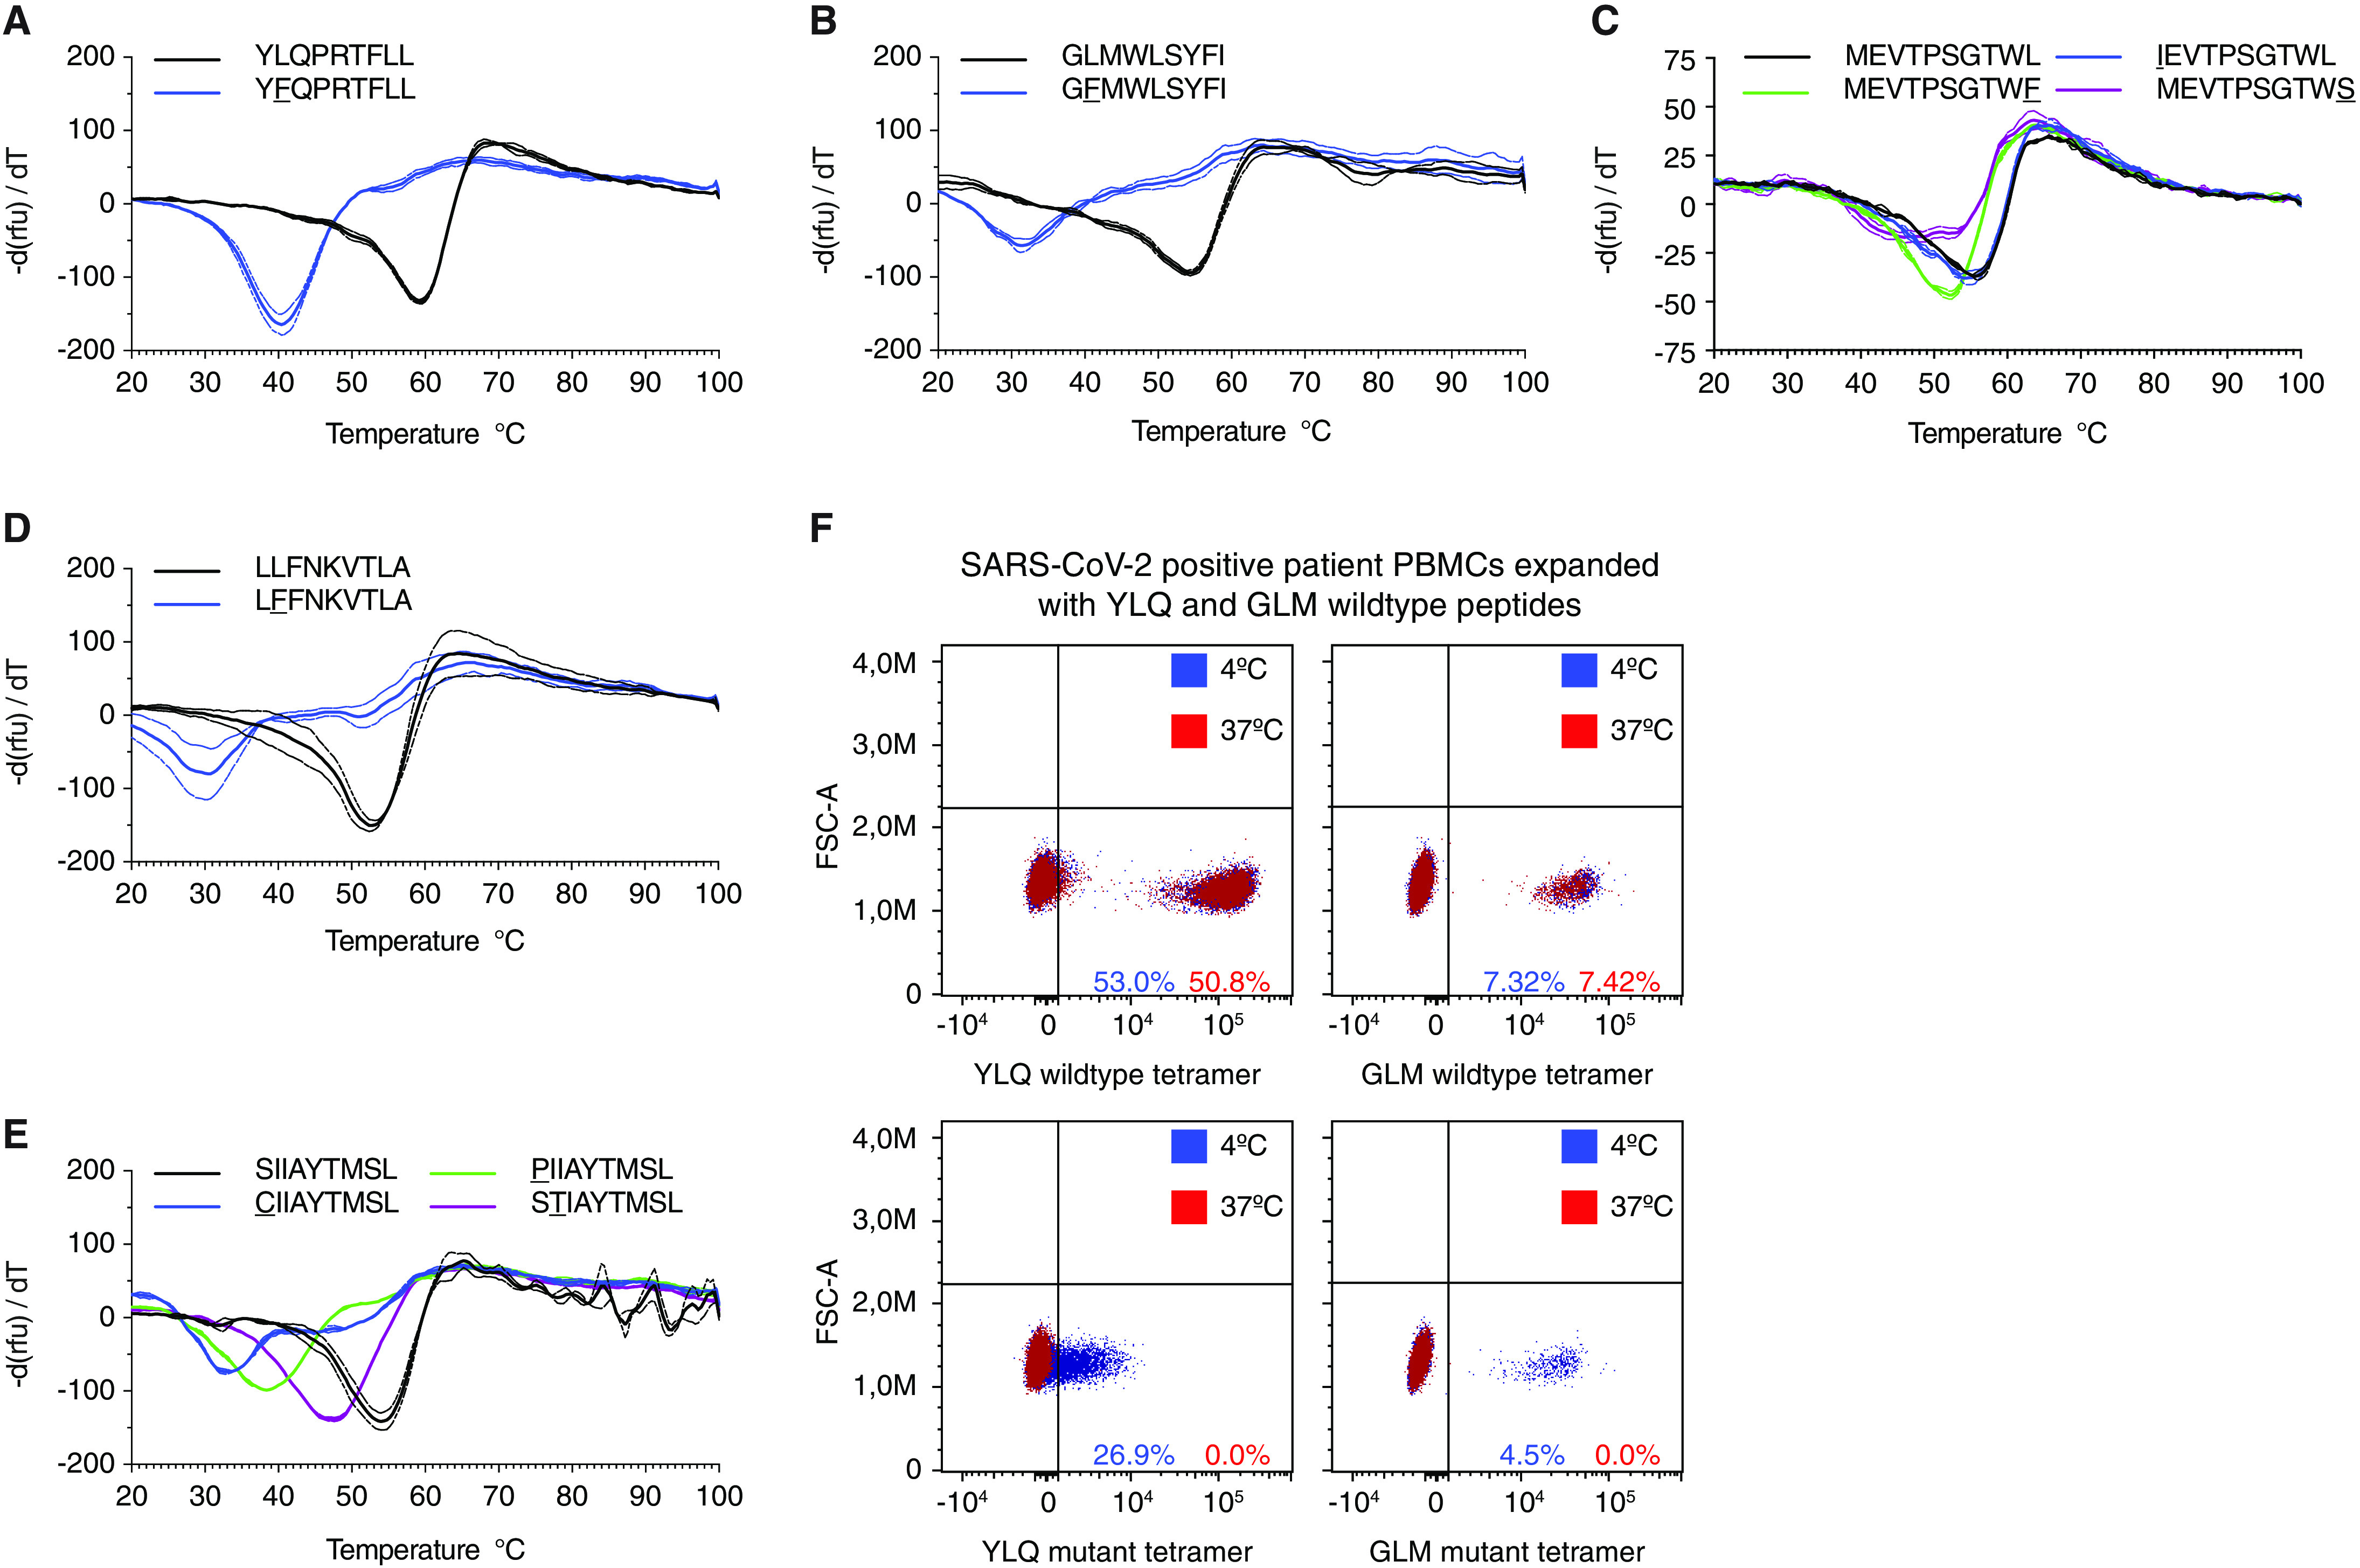
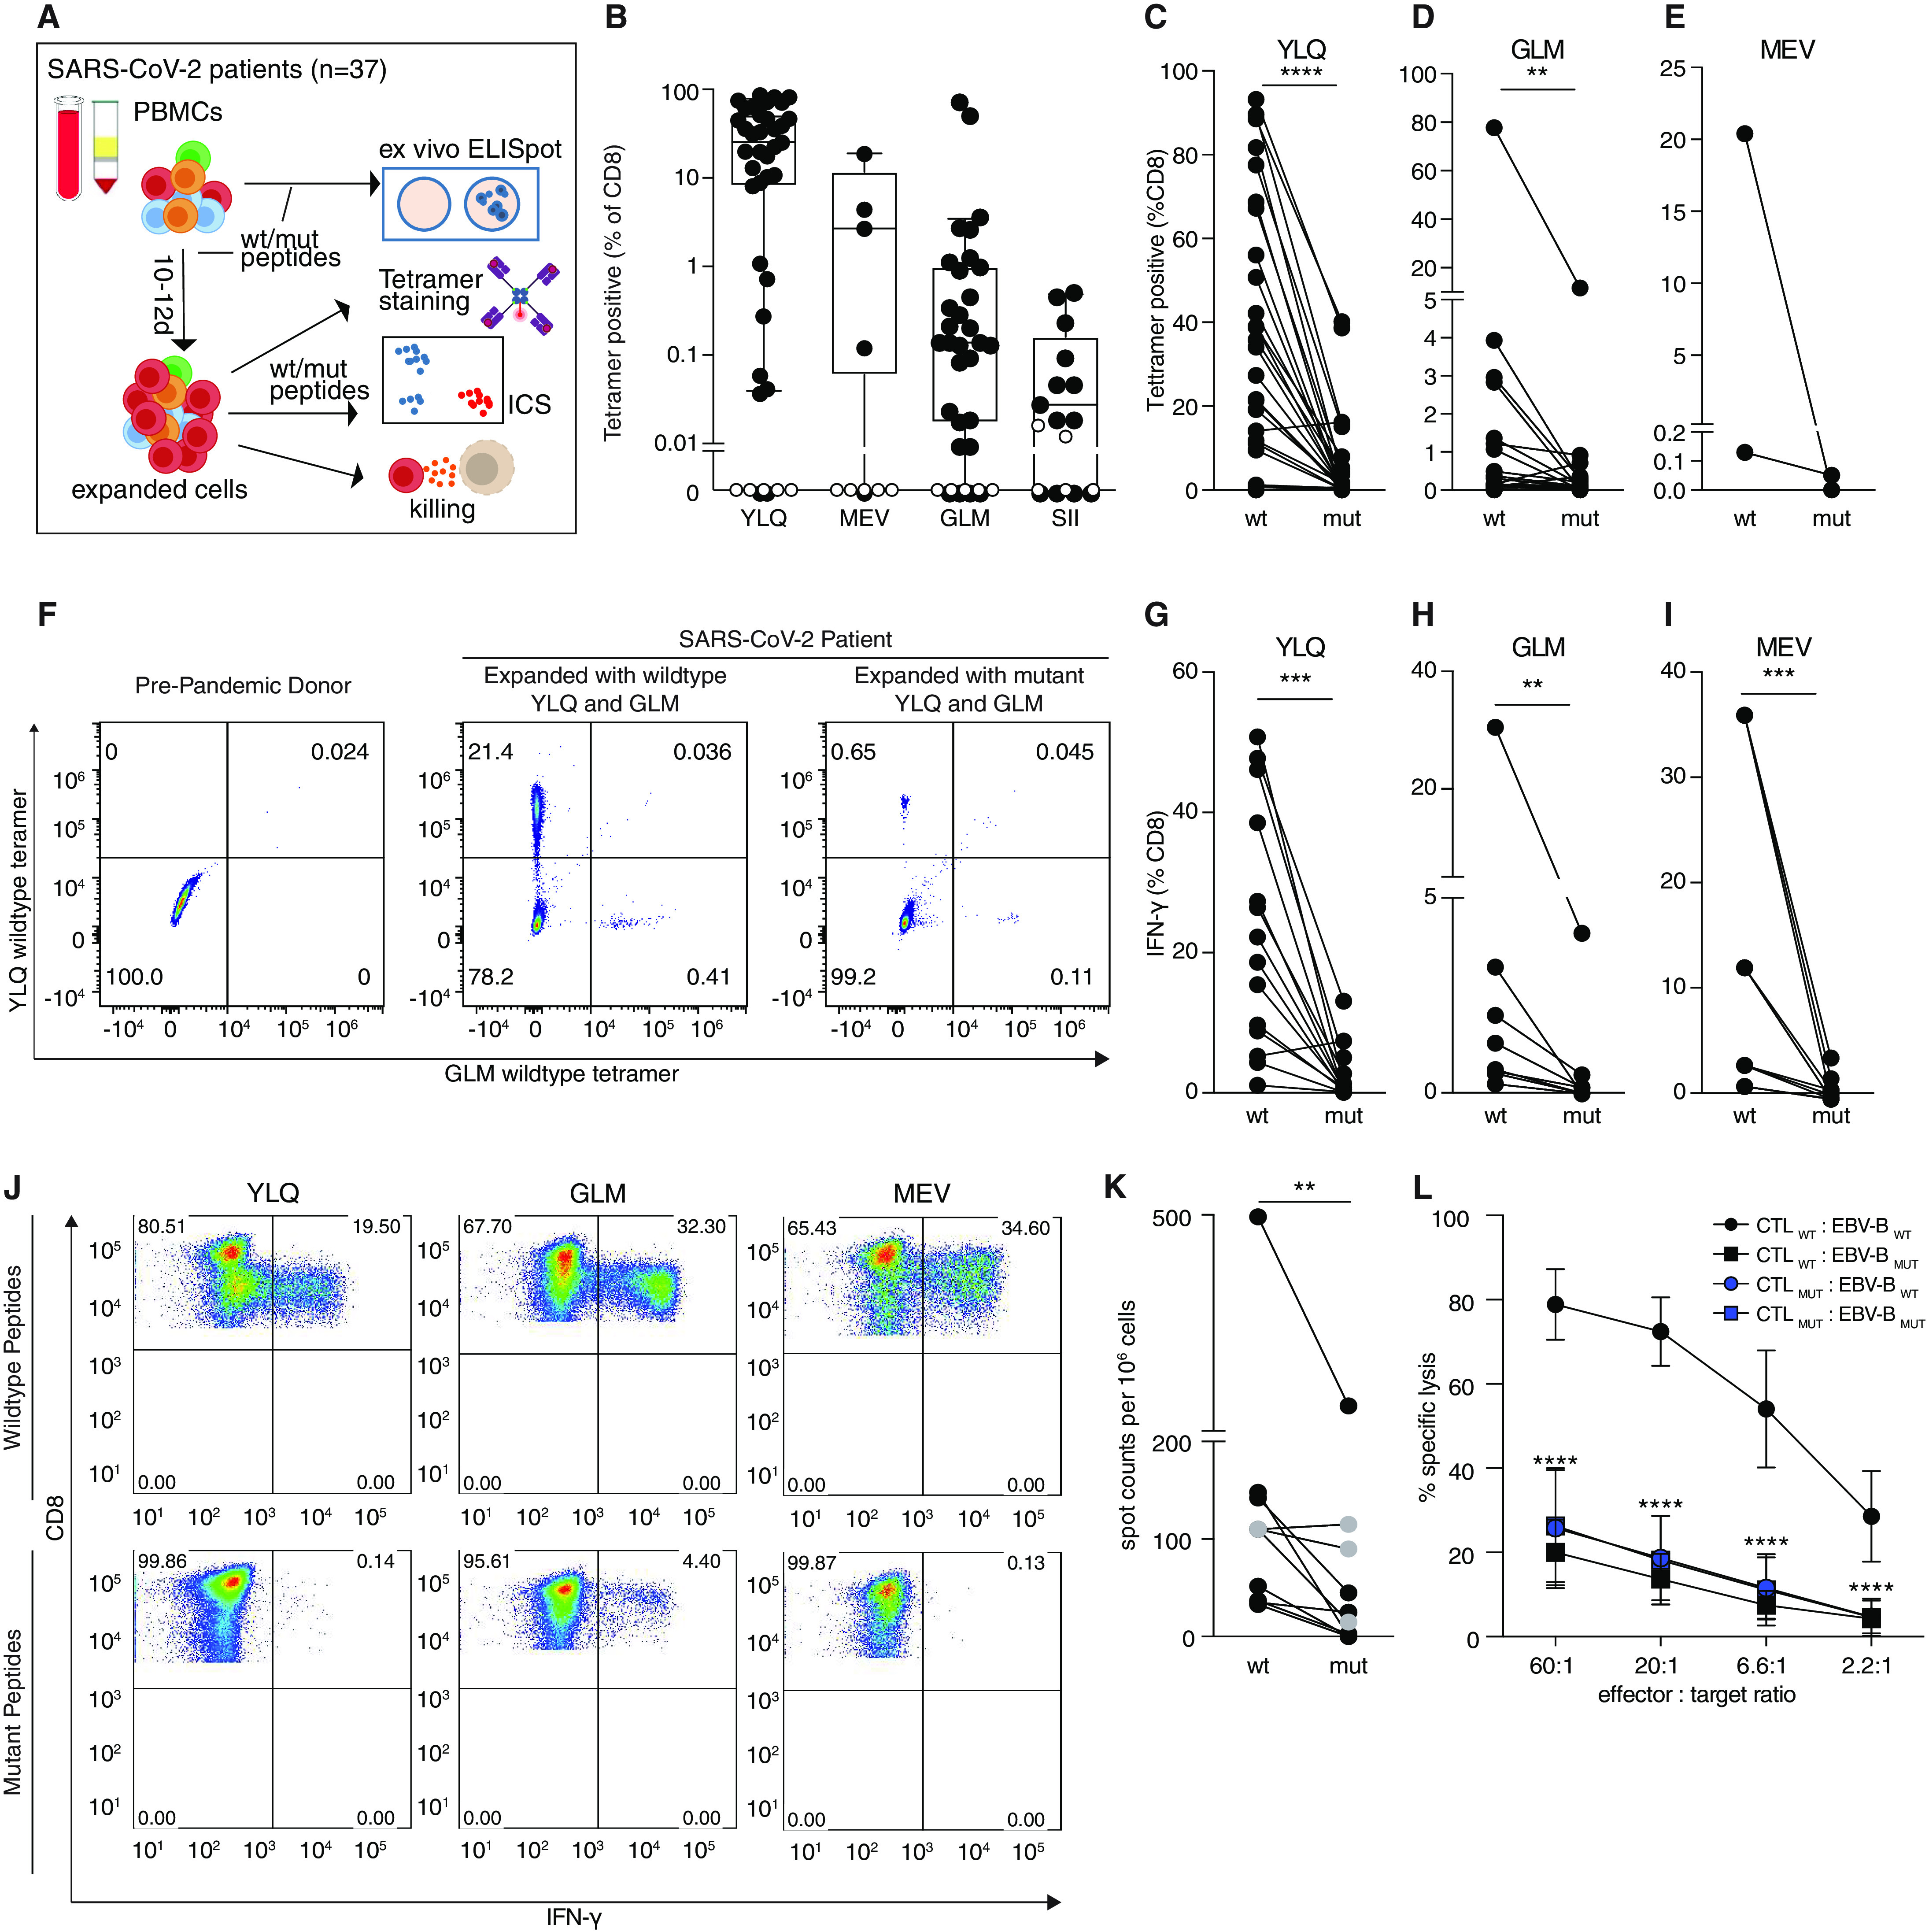
CD8+ T cell immunity to SARS-CoV-2 has been implicated in COVID-19 severity and virus control. Here, we identified nonsynonymous mutations in MHC-I-restricted CD8+ T cell epitopes after deep sequencing of 747 SARS-CoV-2 virus isolates. Mutant peptides exhibited diminished or abrogated MHC-I binding in a cell-free in vitro assay. Reduced MHC-I binding of mutant peptides was associated with decreased proliferation, IFN-γ production and cytotoxic activity of CD8+ T cells isolated from HLA-matched COVID-19 patients. Single cell RNA sequencing of ex vivo expanded, tetramer-sorted CD8+ T cells from COVID-19 patients further revealed qualitative differences in the transcriptional response to mutant peptides. Our findings highlight the capacity of SARS-CoV-2 to subvert CD8+ T cell surveillance through point mutations in MHC-I-restricted viral epitopes.


Figures

Fig. 1
Fig. 1
Nonsynonymous mutations are detected in SARS-CoV-2 CTL epitopes. A) Allele frequency of low-frequency mutations detected in 27 CTL epitopes. Epitopes are indicated on the right. The heatmap to the left indicates change in % ranks predicted by netMHCpan 4.1 (32). Bar plots below the large heatmap indicate viral loads as Ct values. B) Allele frequency of mutations in specified epitopes. Regions present in two epitopes are depicted separately. C) Frequency of global fixed mutations in CTL epitopes. D) Venn diagram depicting overlap between global fixed mutations and low-frequency variants. E) Mutations in CTL epitopes arise late in infection. Mutation frequency over time of two patients which were longitudinally sampled. Shown are variants that lead to nonsynonymous mutations in CTL epitopes. Patient 1 was sampled multiple times on the same day for some time points. Dashed lines indicate the detection limit for calling low-frequency mutations.
Fig. 2
Fig. 2
Epitope variants lead to diminished MHC-I binding. A-E) Decreased thermostability of mutant peptide MHC-I complexes. Negative first derivative of relative fluorescence units (rfu) plotted against increasing temperatures. Curves for wild type peptides are black, mutated peptides are colored. The minimum point of the curves represents the melting temperature of peptide-MHC-I complexes. Dashed lines indicate SD. n=2-3 technical replicates. F) Tetramers featuring mutated peptides are unstable at 37°C. FACS plots showing staining of in vitro expanded PBMCs stained with tetramers containing wild type (top) or mutant (bottom) peptides incubated at 4°C (blue) or 37°C (red).
Fig. 3
Fig. 3
SARS-CoV-2 epitope mutations are associated with decreased CTL responses. A) Experimental overview. B) CTL responses against wild type epitopes. PBMCs were isolated from HLA-A*02:01 or HLA-B*40:01 positive SARS-CoV-2 patients (black, n=35, 5, 3, or 13 respectively, or pre-pandemic controls with unknown HLA status (white, n=7), expanded 10-12 days with indicated peptides, and stained with wild type tetramers. Boxes show median ± 25th and 75th percentile and whiskers indicate 10th and 90th percentile. C-E) T cells expanded with mutant peptides do not give rise to wild type peptide-specific CTLs. PBMCs were isolated as in B), stimulated with wild type or mutant peptides and stained with tetramers containing the wild type peptide. (n=27, 25, and 2 patients per epitope). F) Representative FACS plots for C-E. G-I) Impact of mutations on CTL response. PBMCs expanded with wild type or mutant peptides as indicated, were analyzed for IFN-γ-production via ICS after restimulation with wild type or mutant peptide (n=14, 8, and 4 patients per epitope). J) Representative FACS plots for G-I. K) Ex vivo IFN-γ ELISpot assays from PBMCs stimulated with the YLQ peptide or the corresponding mutant (n=7, PBMCs obtained 2.7 ± 0.8 weeks after symptom onset) or the MEV peptide (marked in gray) or corresponding mutant (n=1, PBMCs obtained 3 weeks after symptom onset). Two or three wells were evaluated per sample and peptide. Patient ID is as indicated in Table S6. L) CTL killing assay. PBMCs from 4 patients were expanded with wild type or mutant YLQ peptide, mixed with autologous EBV+ B cells that were pulsed with wild type or mutant YLQ peptide and specific killing was assessed (n=2 per patient). Error bars represent mean ± SD. Significance is indicated as *P<0.05, **P<0.01, ***P<0.001, ****P<0.0001, tested by Wilcoxon matched-pairs signed rank test (C,D,E,G,H,I,K) or 2-way ANOVA followed by Dunnett’s multiple comparison test (L).
Fig. 4
Fig. 4
Single cell transcriptomics and TCR sequencing of CD8+ T cells reveals distinct transcritptional profiles in response to mutant peptide. A) Experimental setup. PBMCs were expanded for 10-12 days in the presence of wild type or mutant YLQ peptide, sorted for YLQ tetramer-positive and tetramer-negative CD8+ cells, labeled with barcoded antibodies (TotalSeq anti-human Hashtag) and subjected to single-cell RNA sequencing (figure generated with BioRender.com). B) Percentages of YLQ tetramer-positive CD8+ T cells in response to wild type or mutant peptide expansion from the two donors analyzed. C-D) UMAP plots displaying an embedding of single-cell transcriptomes in 2-dimensional space. The cells are colored according to their clusters (C), or experimental condition (D). E) Distribution of clonotypes for both patients and the indicated conditions. The top 5 clonotypes are colored. Connecting lines show clonotypes shared between conditions. F) Top 15 TRAV and TRVB genes. G) Volcano plot displaying differentially expressed genes between wild type-positive and mutant-positive cells. P-values of 0 were capped to 10−350 (indicated by gray dotted line). H) Violin plots showing expression levels in tetramer-negative and tetramer-positive cells expanded with mutant or wild type peptide. Expression levels given as log-normalized relative read counts (RC). All plots in C-H show combined data from both patients.

References

    1. Zhang X., Tan Y., Ling Y., Lu G., Liu F., Yi Z., Jia X., Wu M., Shi B., Xu S., Chen J., Wang W., Chen B., Jiang L., Yu S., Lu J., Wang J., Xu M., Yuan Z., Zhang Q., Zhang X., Zhao G., Wang S., Chen S., Lu H., Viral and host factors related to the clinical outcome of COVID-19. Nature 583, 437–440 (2020). 10.1038/s41586-020-2355-0 - DOI - PubMed
    1. Vabret N., Britton G. J., Gruber C., Hegde S., Kim J., Kuksin M., Levantovsky R., Malle L., Moreira A., Park M. D., Pia L., Risson E., Saffern M., Salomé B., Esai Selvan M., Spindler M. P., Tan J., van der Heide V., Gregory J. K., Alexandropoulos K., Bhardwaj N., Brown B. D., Greenbaum B., Gümüş Z. H., Homann D., Horowitz A., Kamphorst A. O., Curotto de Lafaille M. A., Mehandru S., Merad M., Samstein R. M.; Sinai Immunology Review Project , Immunology of COVID-19: Current state of the science. Immunity 52, 910–941 (2020). 10.1016/j.immuni.2020.05.002 - DOI - PMC - PubMed
    1. Mathew D., Giles J. R., Baxter A. E., Oldridge D. A., Greenplate A. R., Wu J. E., Alanio C., Kuri-Cervantes L., Pampena M. B., D’Andrea K., Manne S., Chen Z., Huang Y. J., Reilly J. P., Weisman A. R., Ittner C. A. G., Kuthuru O., Dougherty J., Nzingha K., Han N., Kim J., Pattekar A., Goodwin E. C., Anderson E. M., Weirick M. E., Gouma S., Arevalo C. P., Bolton M. J., Chen F., Lacey S. F., Ramage H., Cherry S., Hensley S. E., Apostolidis S. A., Huang A. C., Vella L. A., Betts M. R., Meyer N. J., Wherry E. J.; UPenn COVID Processing Unit , Deep immune profiling of COVID-19 patients reveals distinct immunotypes with therapeutic implications. Science 369, eabc8511 (2020). 10.1126/science.abc8511 - DOI - PMC - PubMed
    1. Le Bert N., Tan A. T., Kunasegaran K., Tham C. Y. L., Hafezi M., Chia A., Chng M. H. Y., Lin M., Tan N., Linster M., Chia W. N., Chen M. I.-C., Wang L.-F., Ooi E. E., Kalimuddin S., Tambyah P. A., Low J. G.-H., Tan Y.-J., Bertoletti A., SARS-CoV-2-specific T cell immunity in cases of COVID-19 and SARS, and uninfected controls. Nature 584, 457–462 (2020). 10.1038/s41586-020-2550-z - DOI - PubMed
    1. McMahan K., Yu J., Mercado N. B., Loos C., Tostanoski L. H., Chandrashekar A., Liu J., Peter L., Atyeo C., Zhu A., Bondzie E. A., Dagotto G., Gebre M. S., Jacob-Dolan C., Li Z., Nampanya F., Patel S., Pessaint L., Van Ry A., Blade K., Yalley-Ogunro J., Cabus M., Brown R., Cook A., Teow E., Andersen H., Lewis M. G., Lauffenburger D. A., Alter G., Barouch D. H., Correlates of protection against SARS-CoV-2 in rhesus macaques. Nature 590, 630–634 (2021). 10.1038/s41586-020-03041-6 - DOI - PMC - PubMed

Publication types