

Both Default and Multiple-Demand Regions Represent Semantic Goal Information
- PMID: 33664130
- PMCID: PMC8055078
- DOI: 10.1523/JNEUROSCI.1782-20.2021
Both Default and Multiple-Demand Regions Represent Semantic Goal Information
Abstract
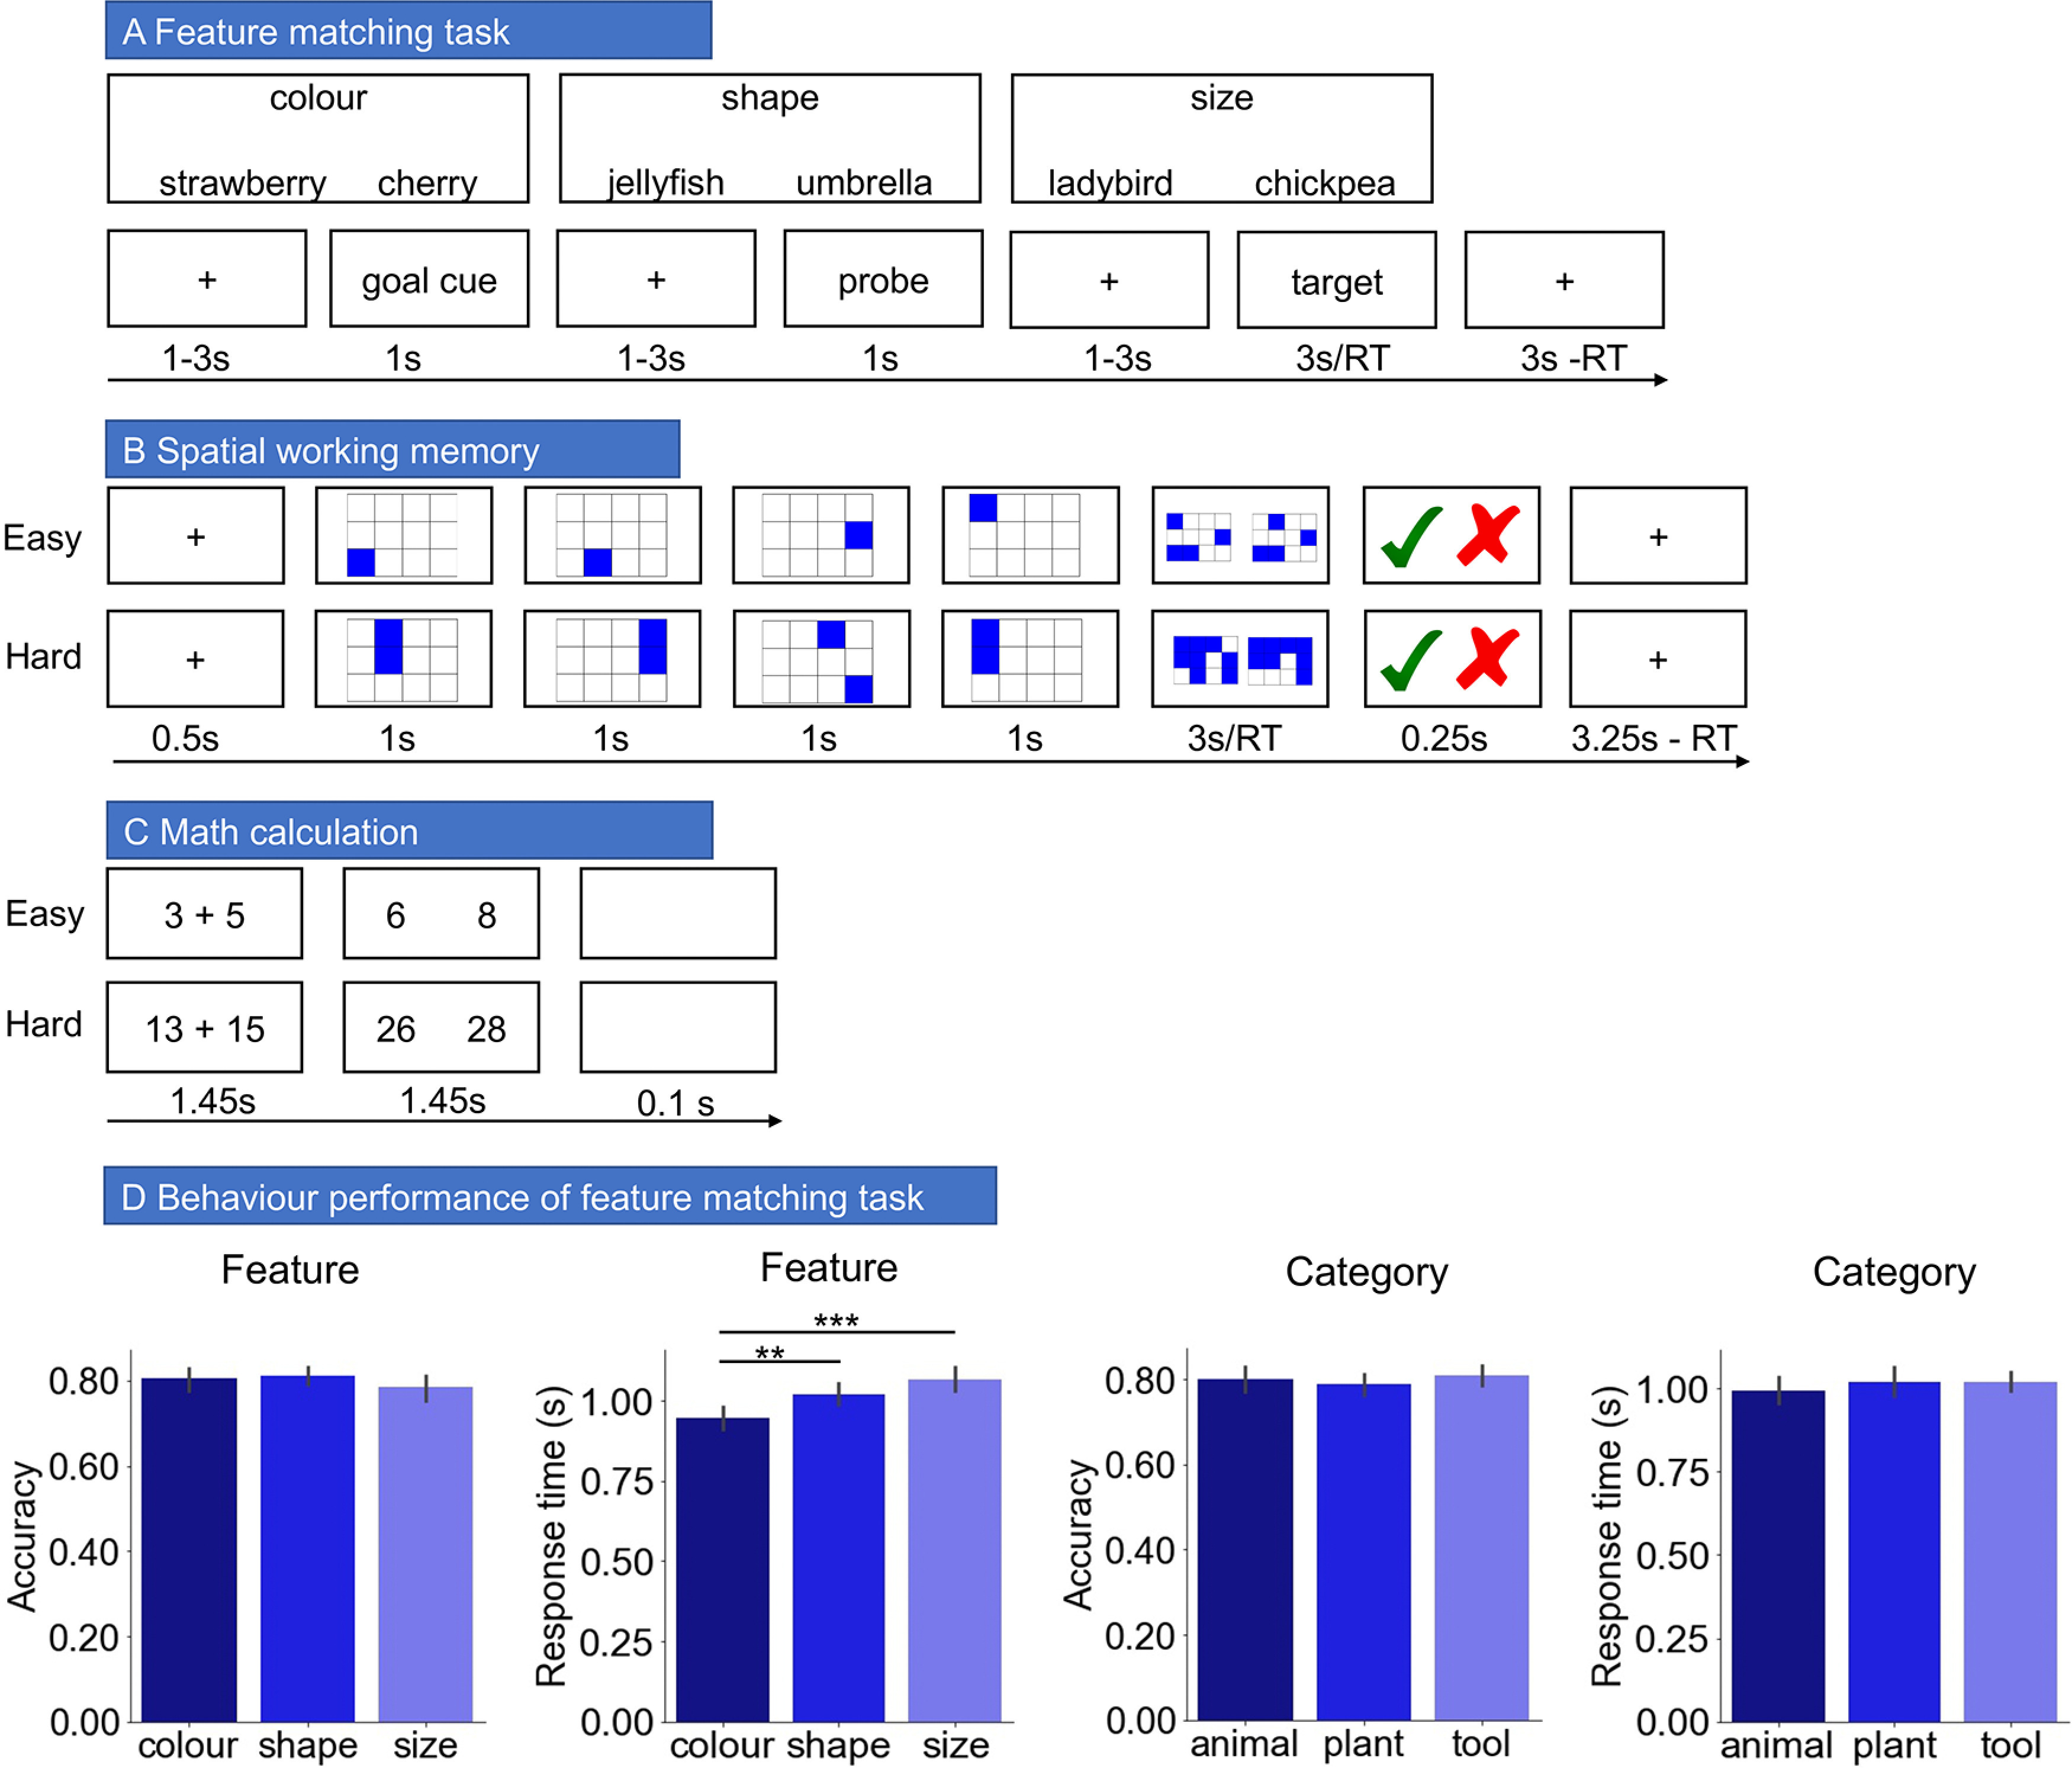
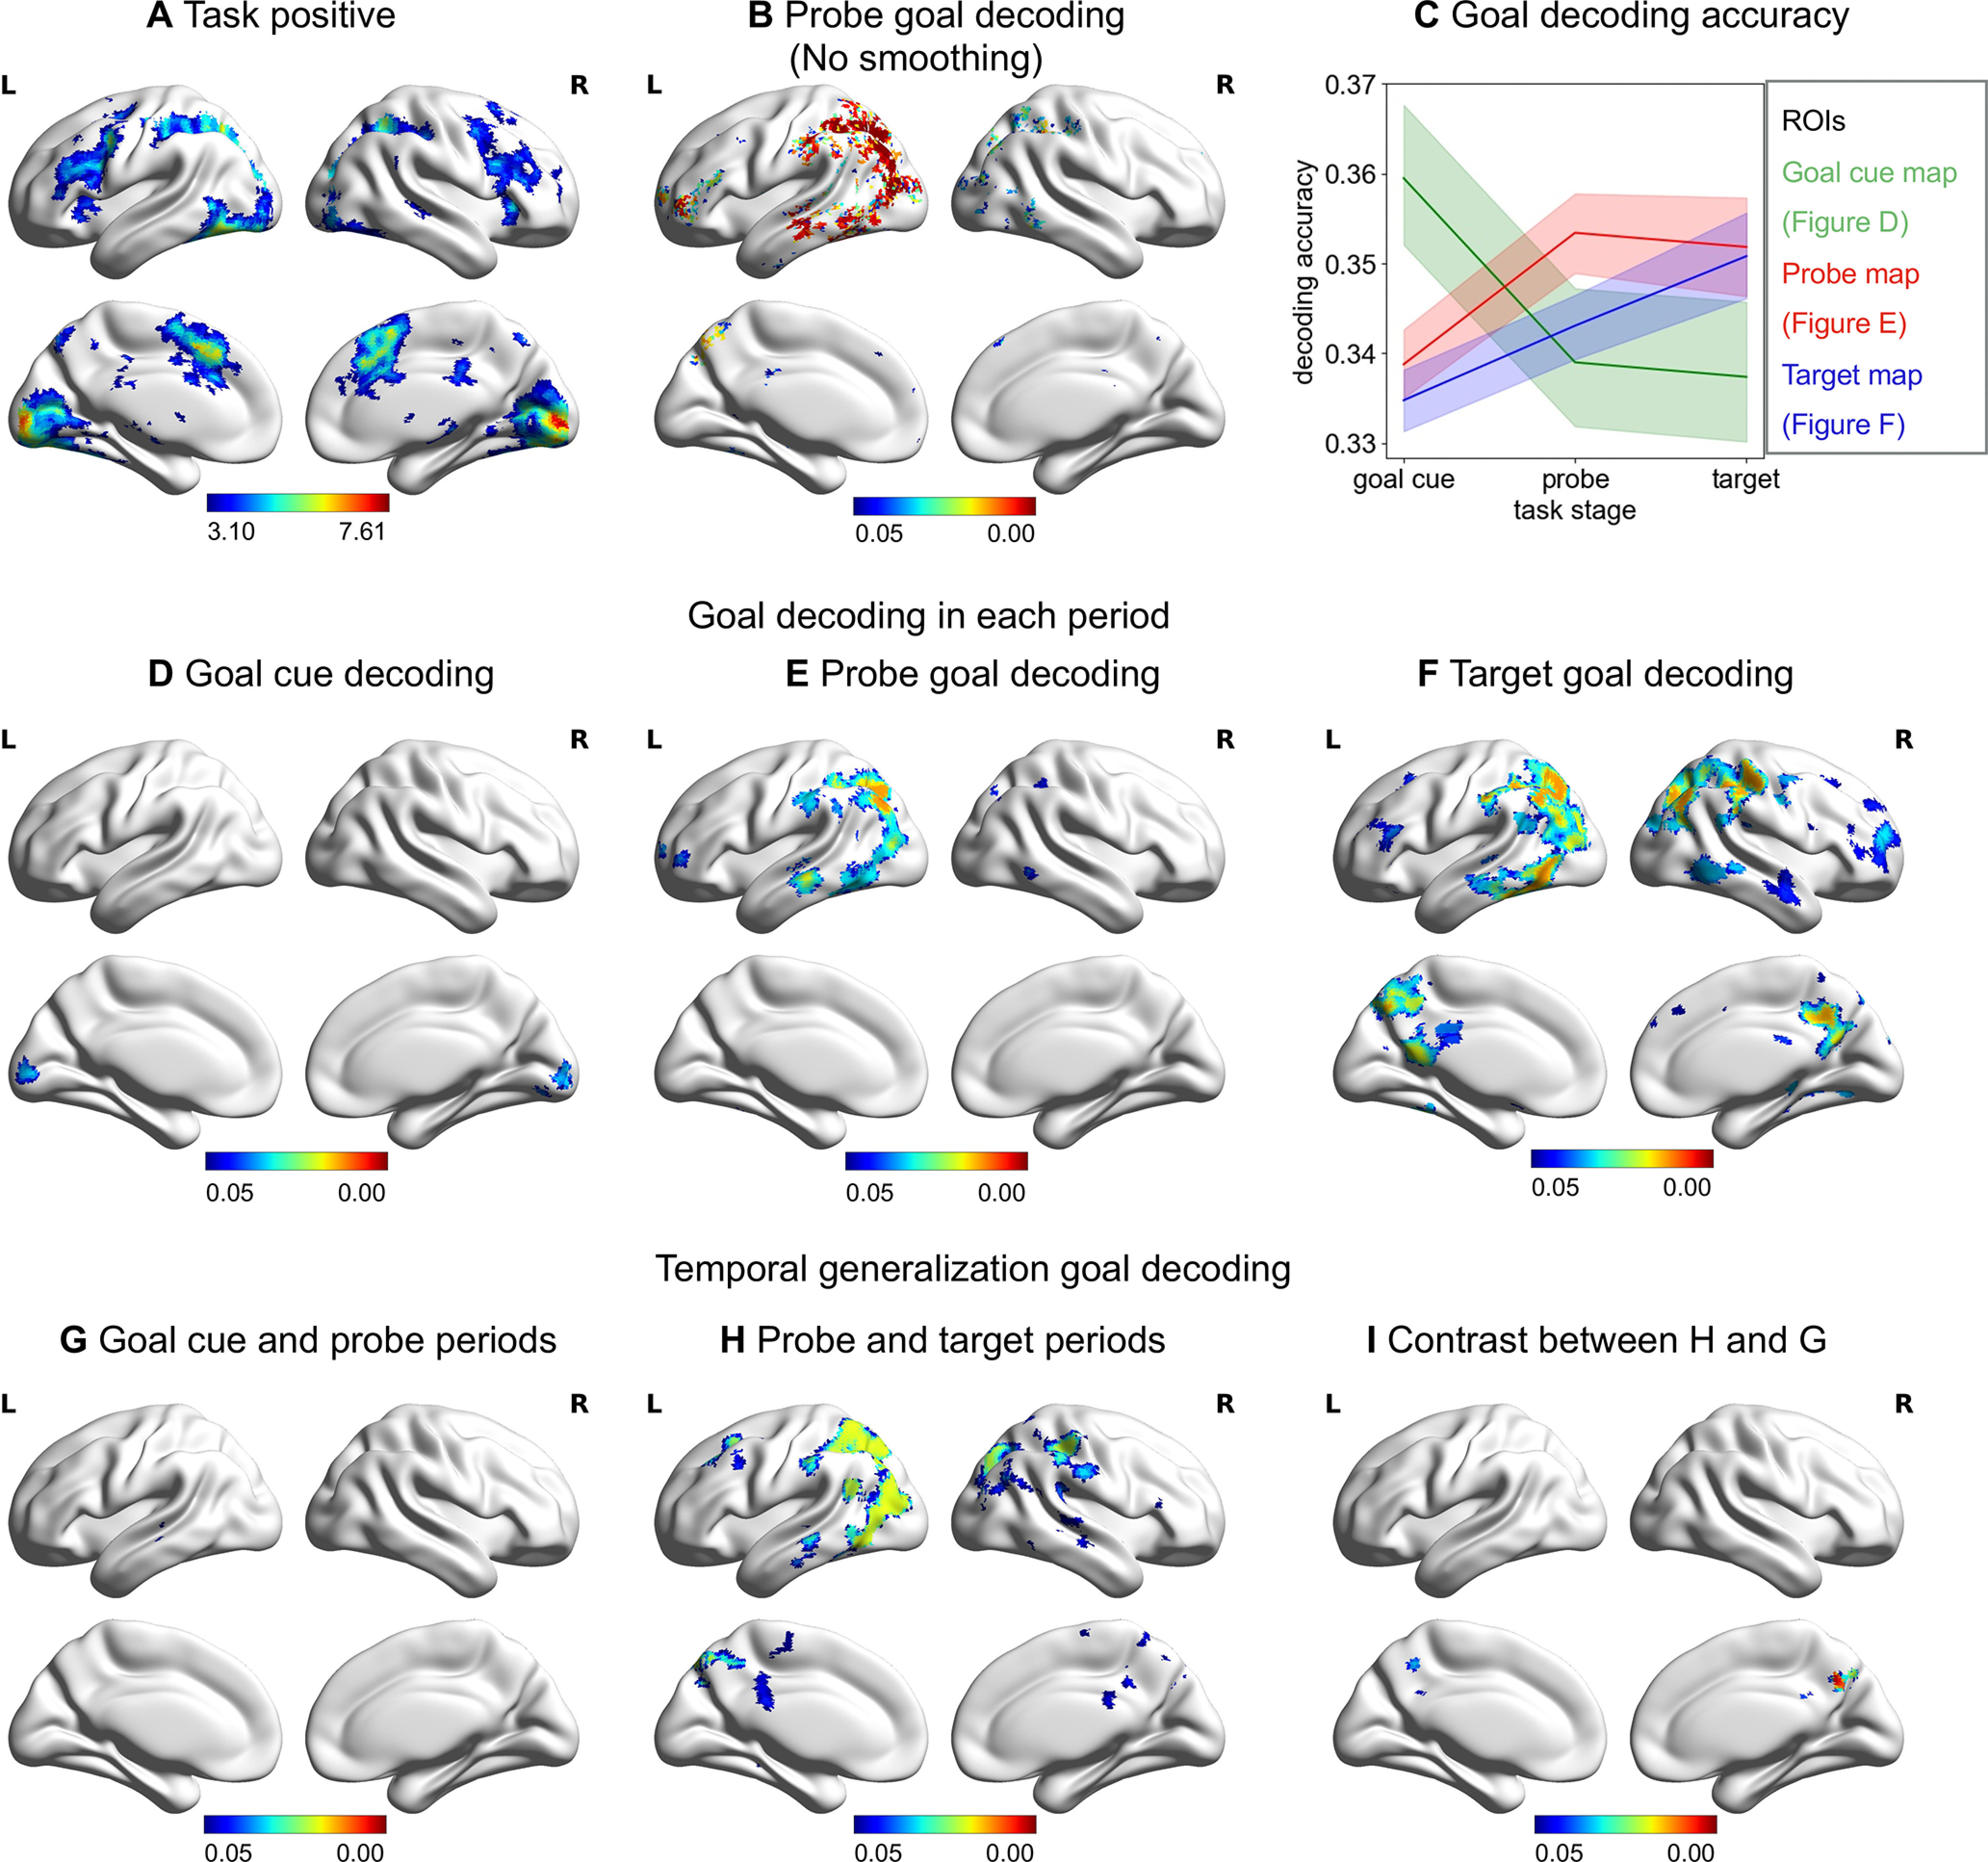
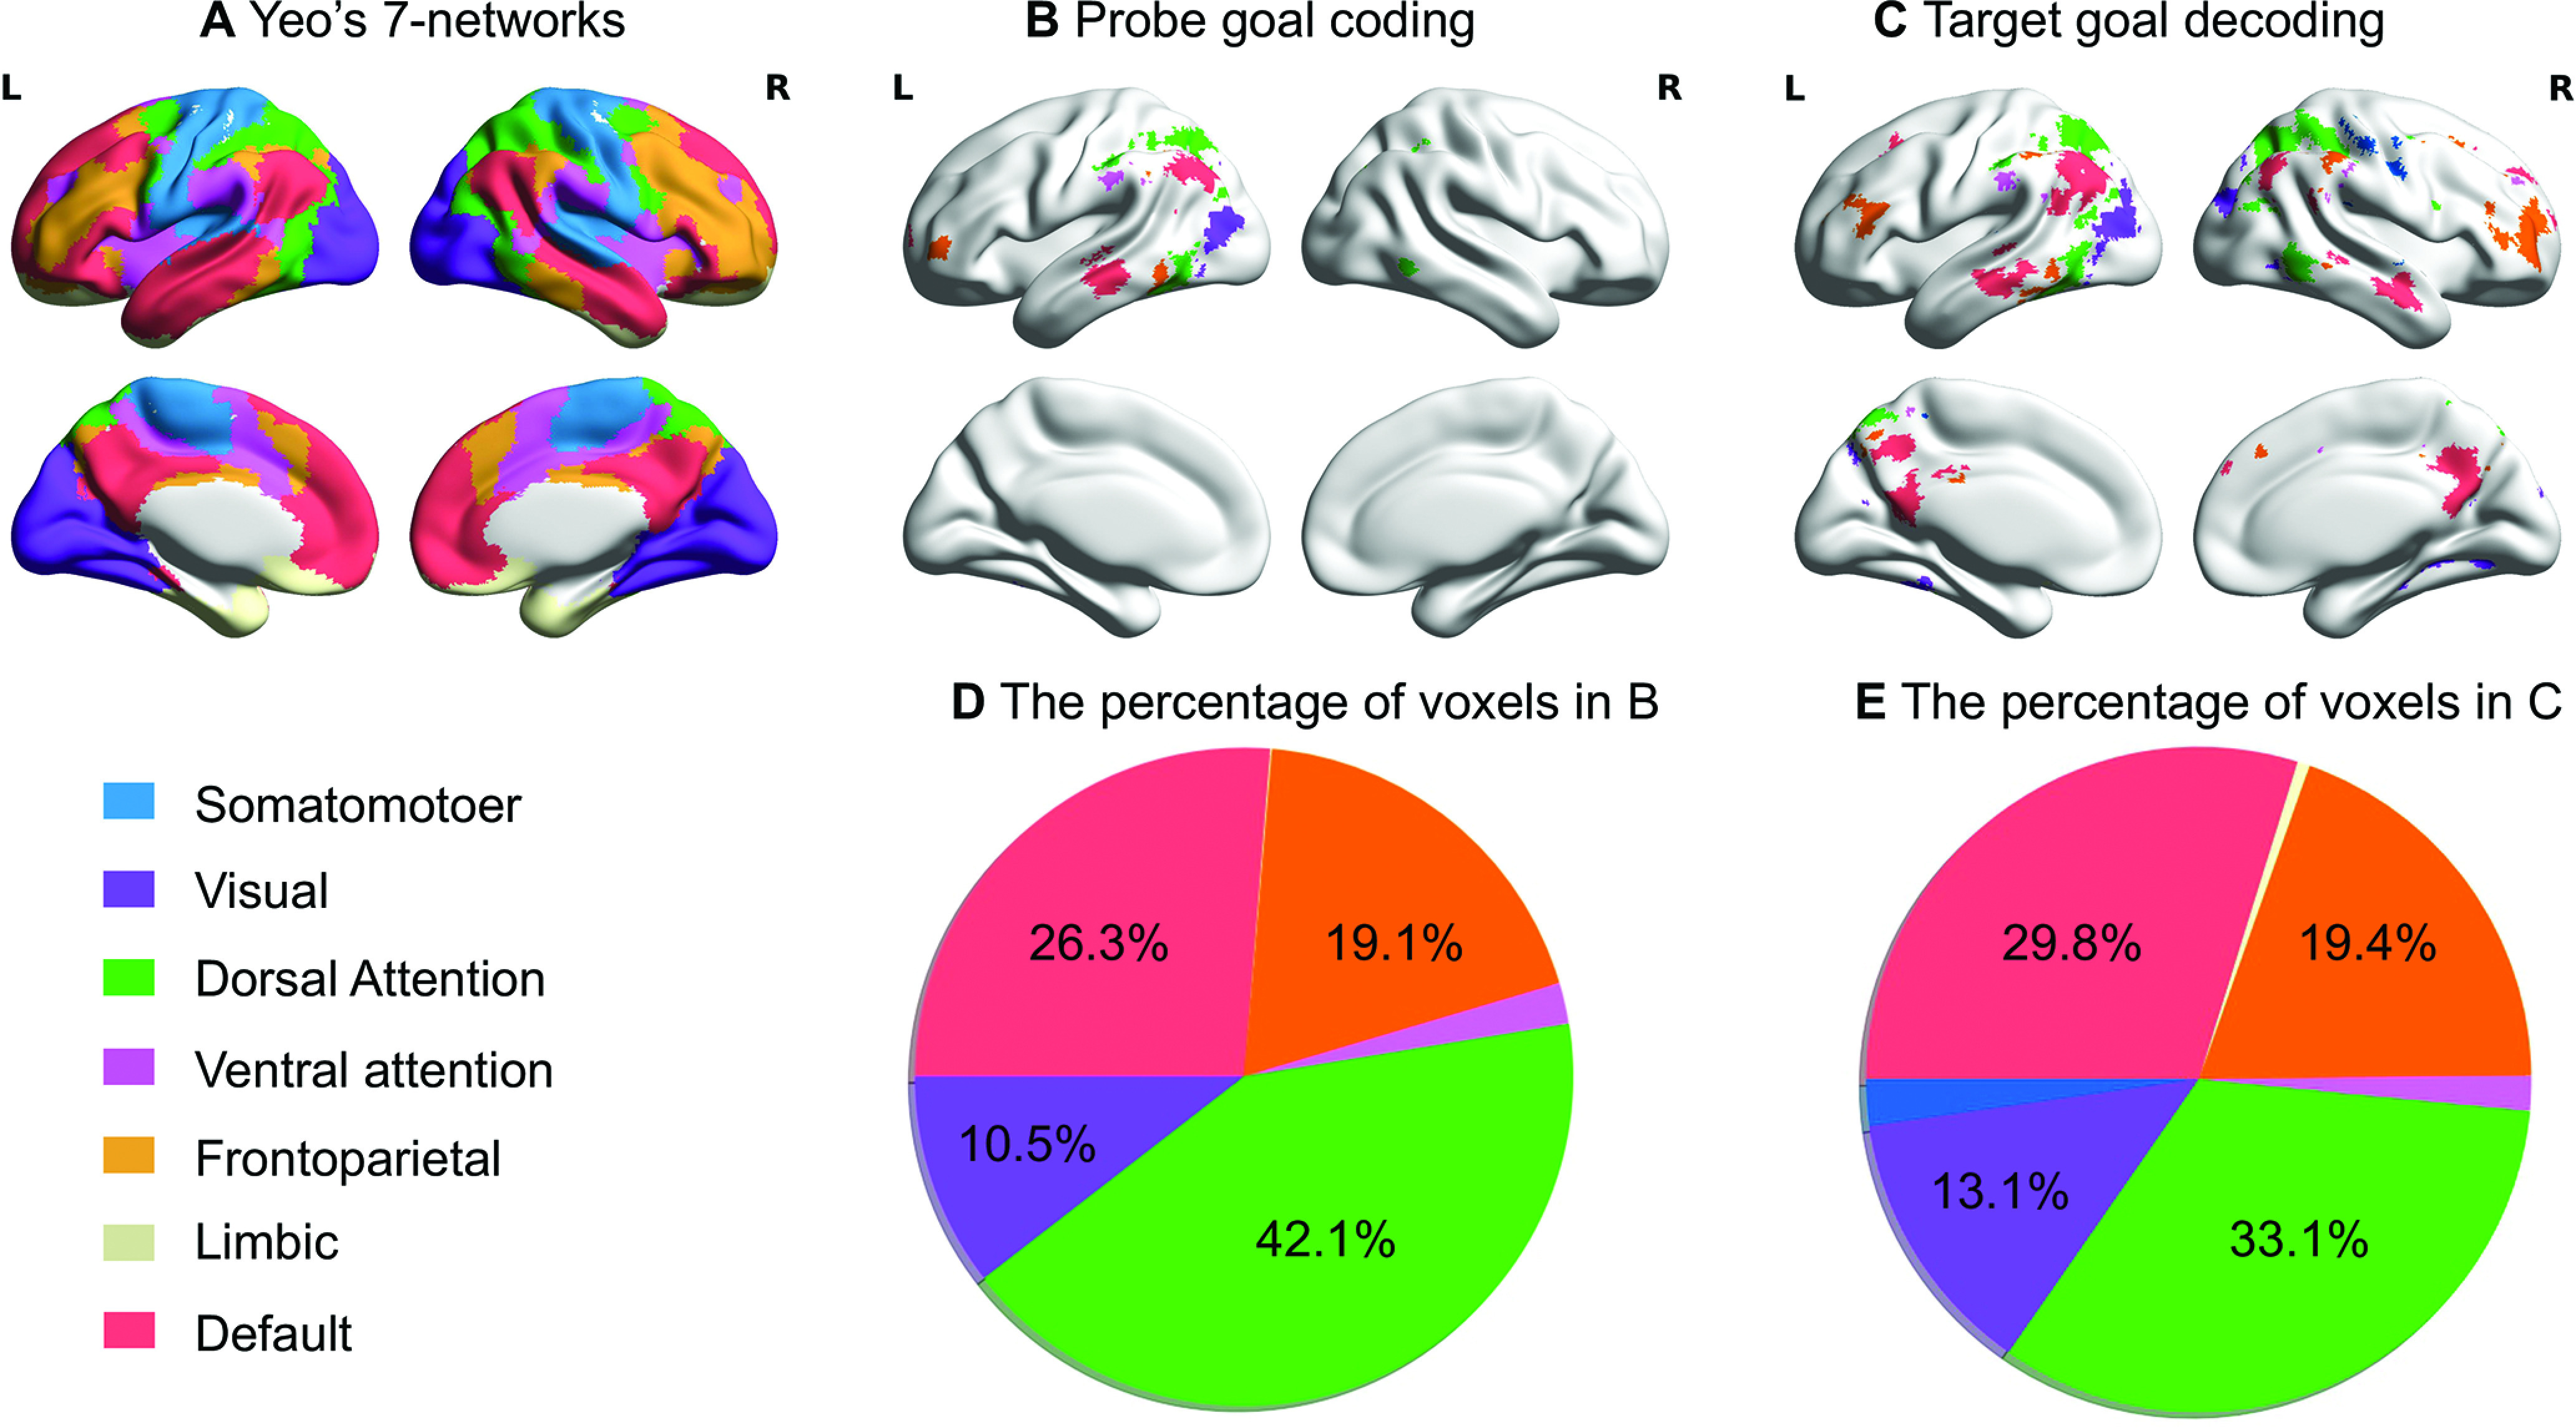
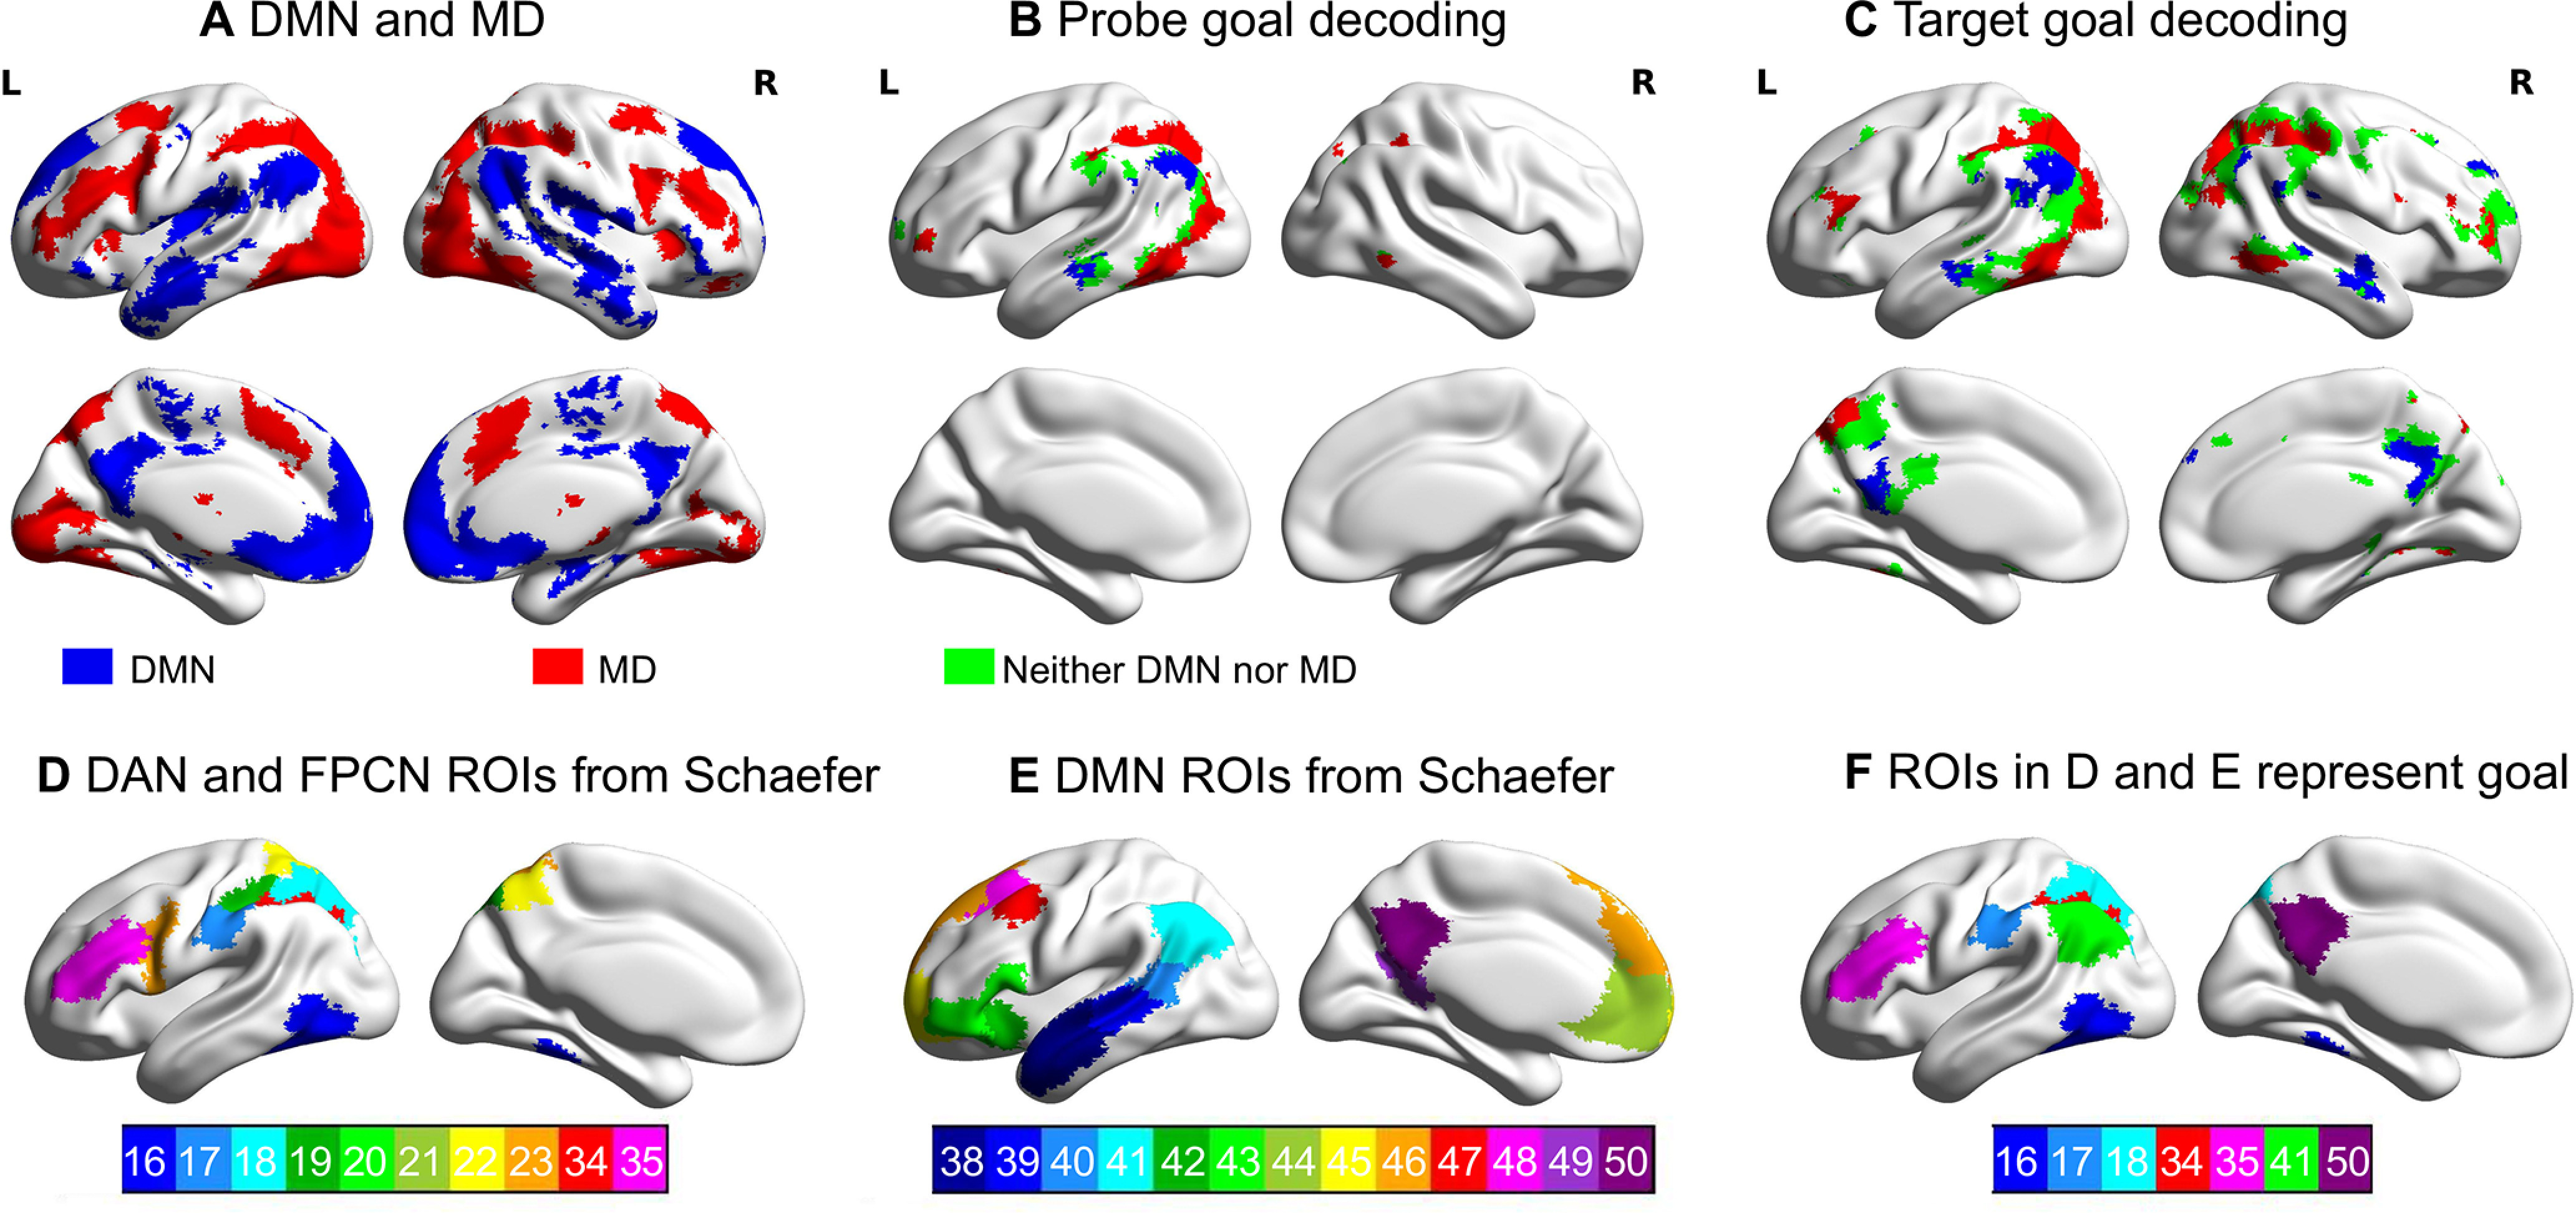
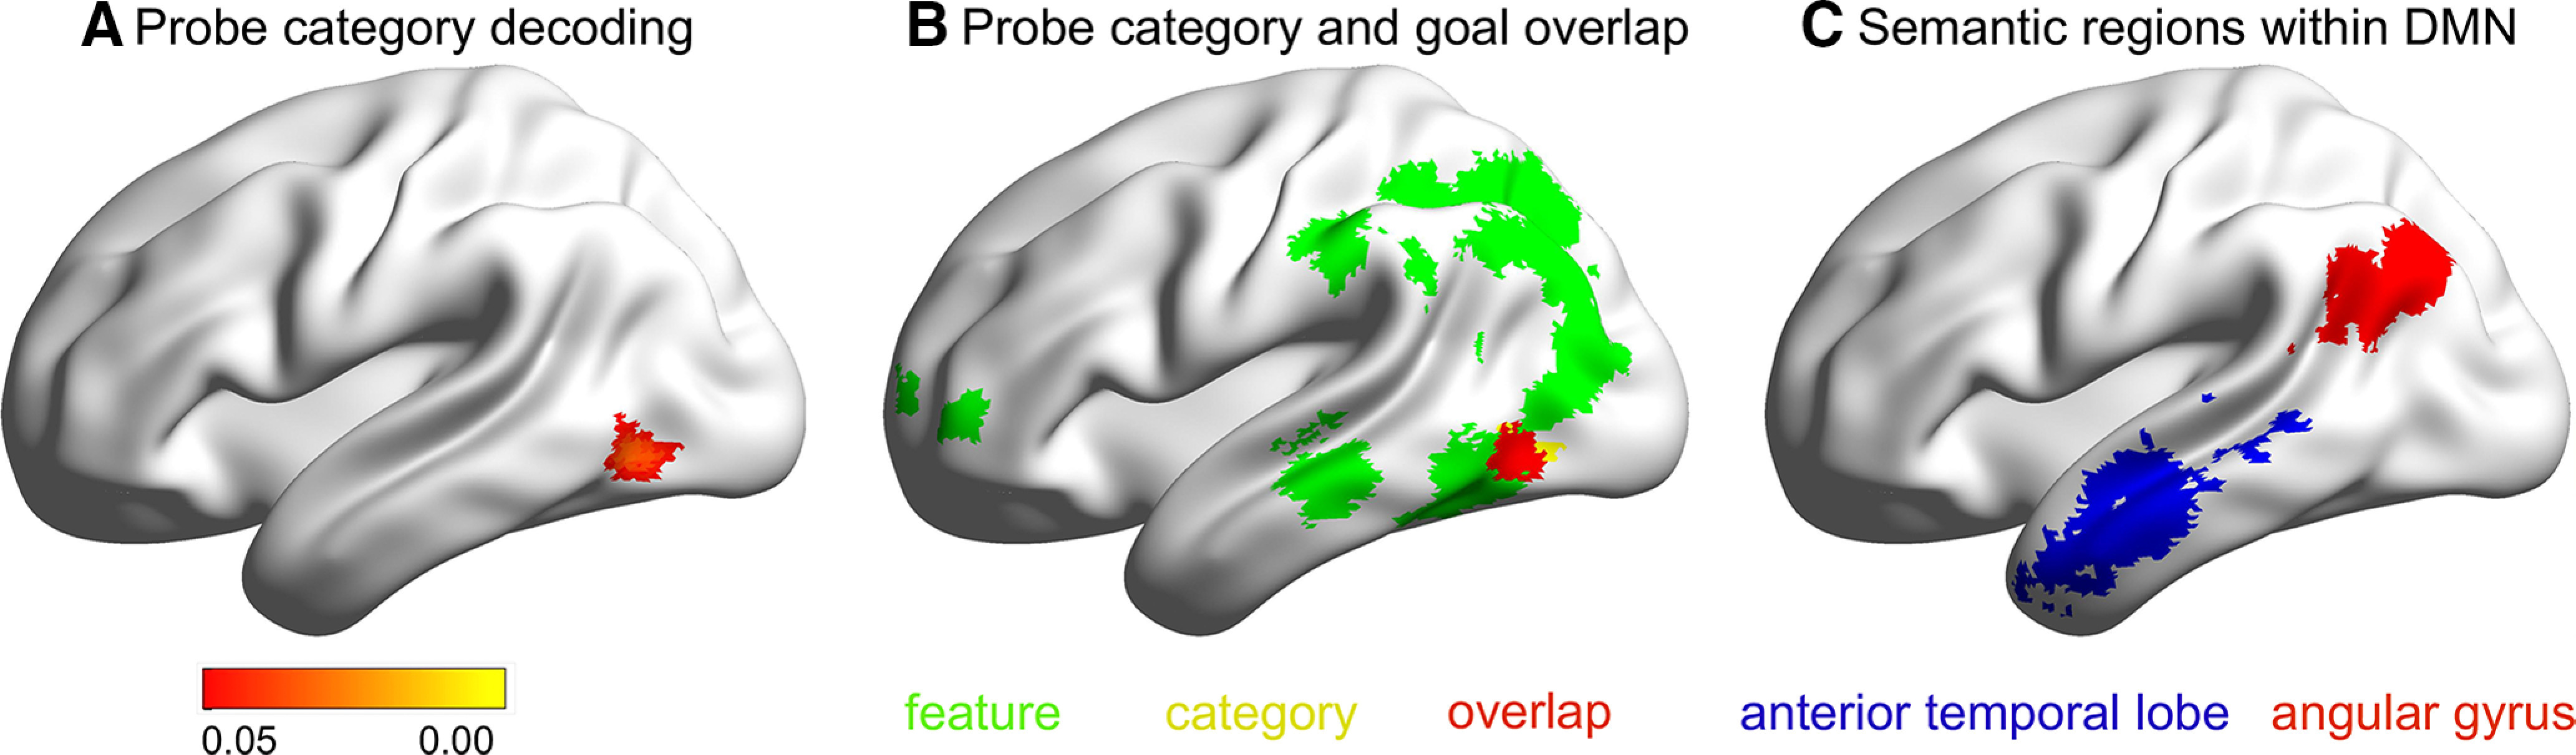
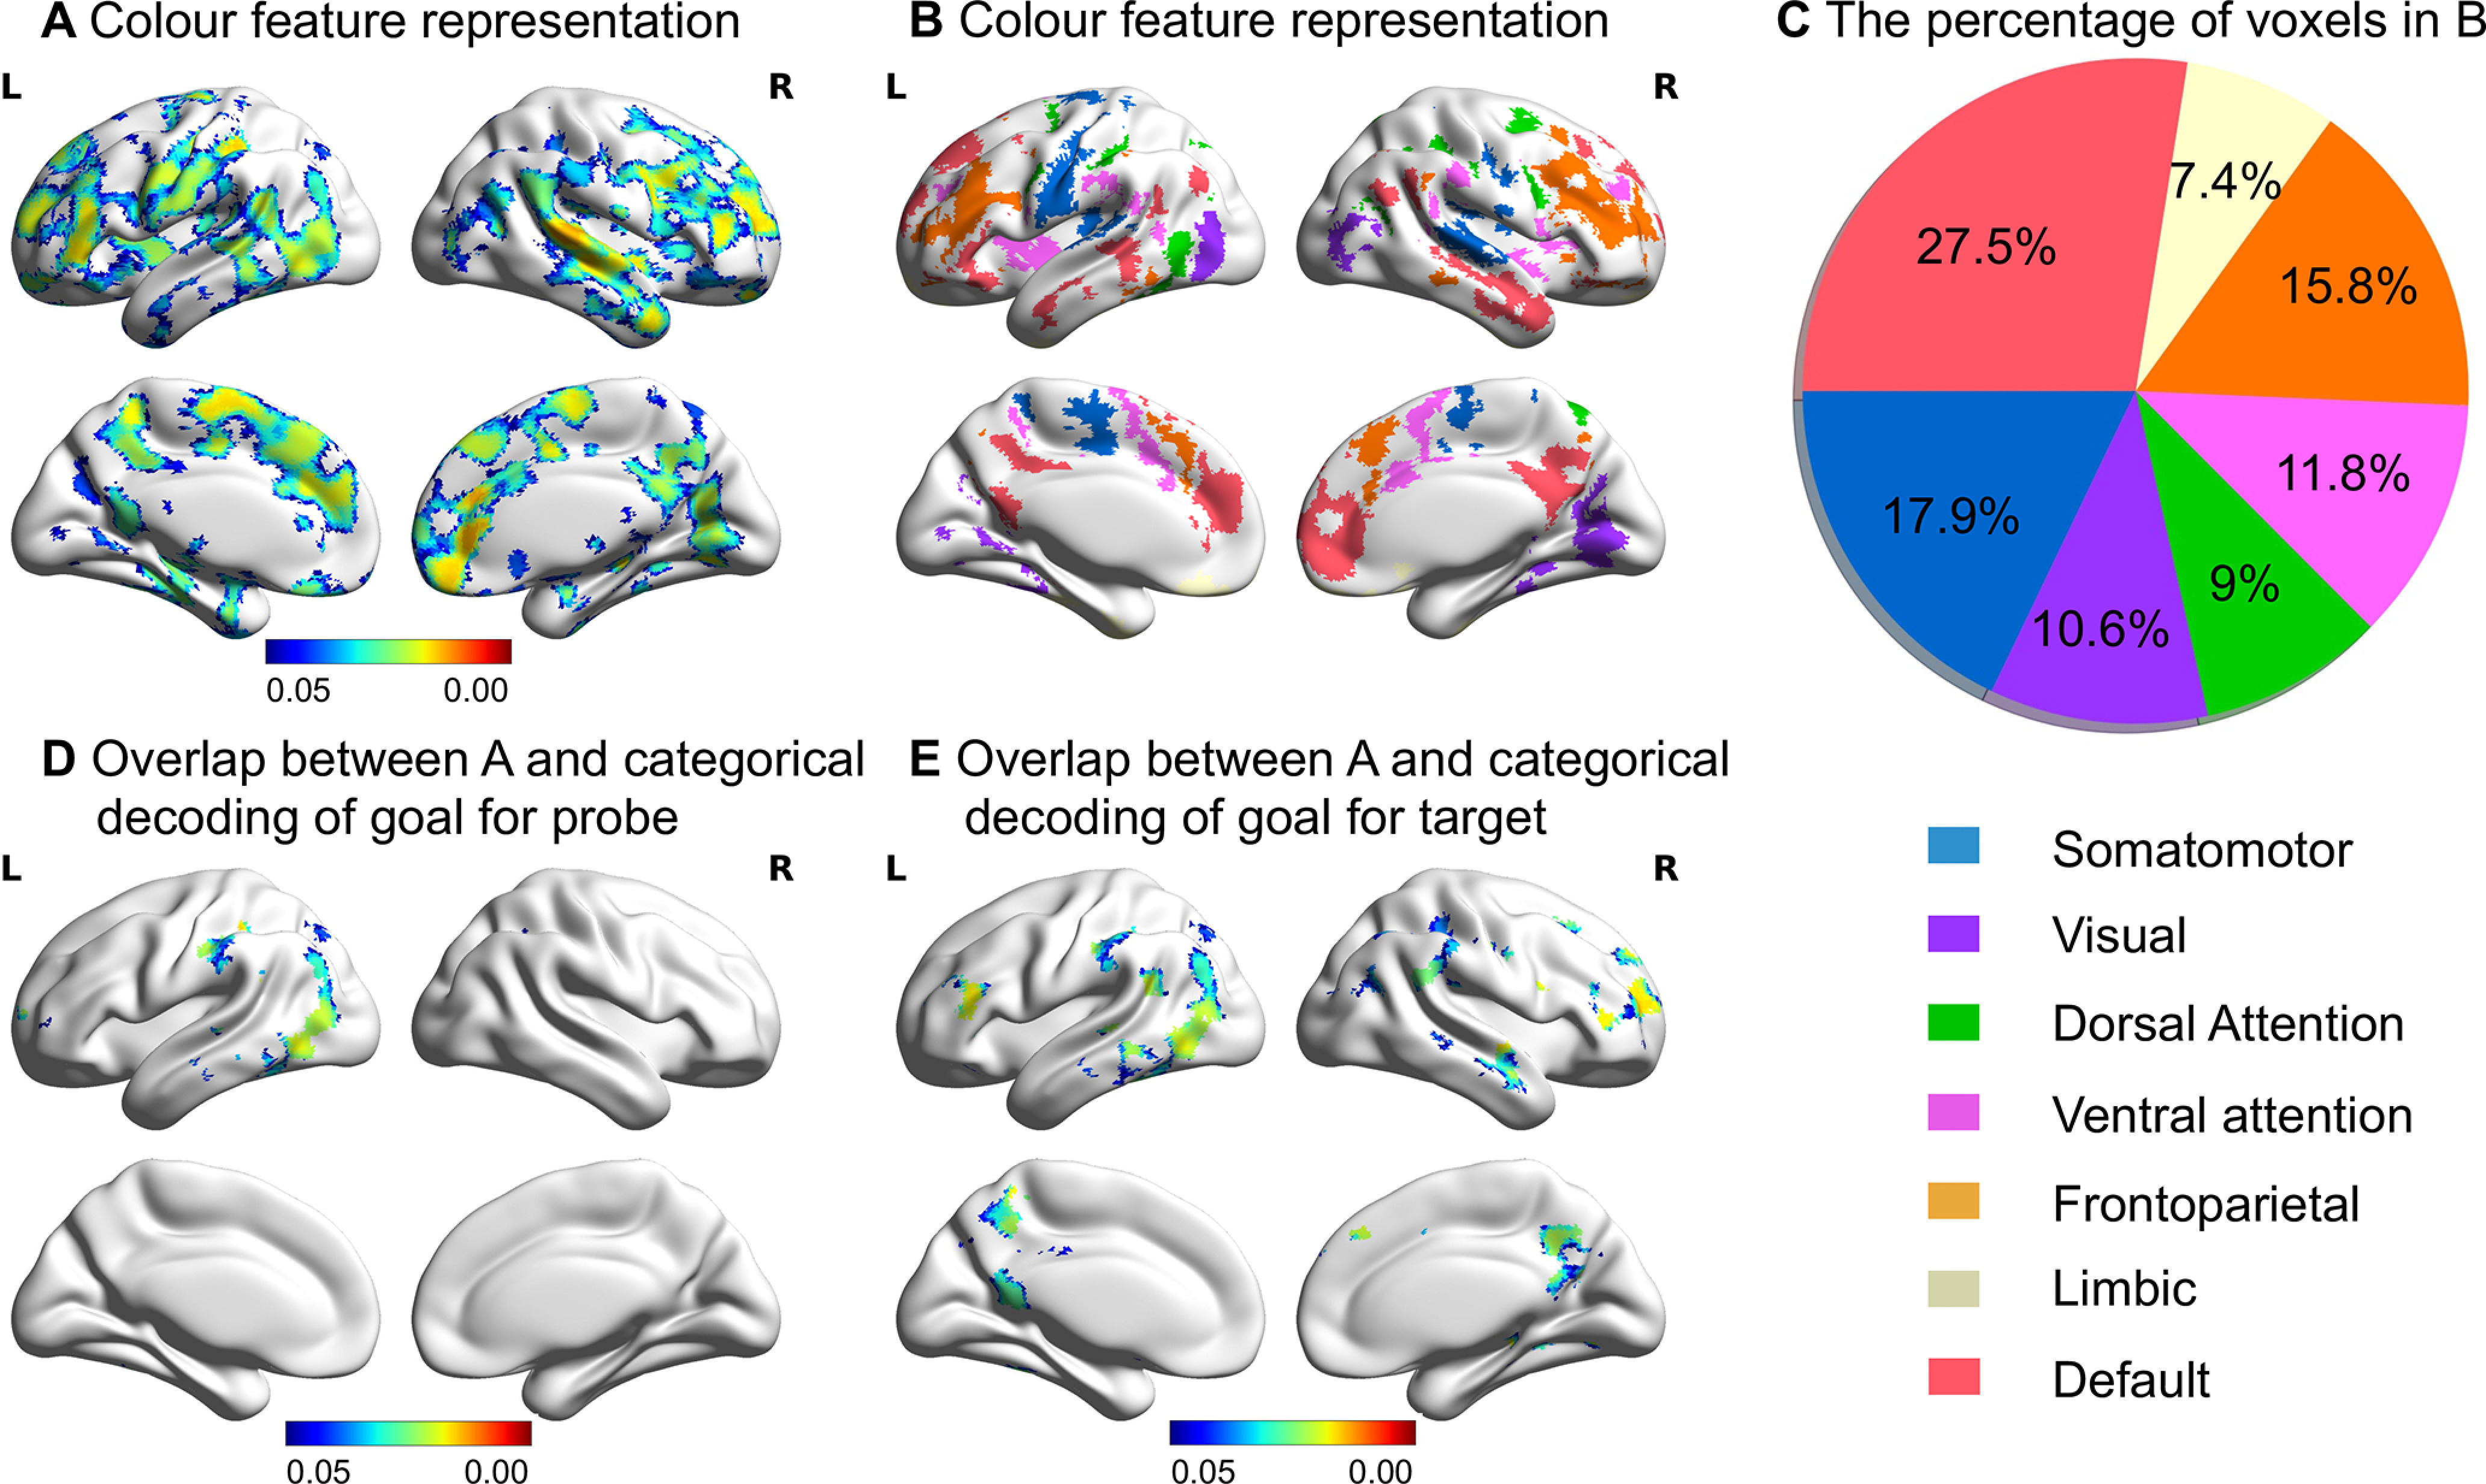
We used a semantic feature-matching task combined with multivoxel pattern decoding to test contrasting accounts of the role of the default mode network (DMN) in cognitive flexibility. By one view, DMN and multiple-demand cortex have opposing roles in cognition, with DMN and multiple-demand regions within the dorsal attention network (DAN) supporting internal and external cognition, respectively. Consequently, while multiple-demand regions can decode current goal information, semantically relevant DMN regions might decode conceptual similarity regardless of task demands. Alternatively, DMN regions, like multiple-demand cortex, might show sensitivity to changing task demands, since both networks dynamically alter their patterns of connectivity depending on the context. Our task required human participants (any sex) to integrate conceptual knowledge with changing task goals, such that successive decisions were based on different features of the items (color, shape, and size). This allowed us to simultaneously decode semantic category and current goal information using whole-brain searchlight decoding. As expected, multiple-demand cortex, including DAN and frontoparietal control network, represented information about currently relevant conceptual features. Similar decoding results were found in DMN, including in angular gyrus and posterior cingulate cortex, indicating that DMN and multiple-demand regions can support the same function rather than being strictly competitive. Semantic category could be decoded in lateral occipital cortex independently of task demands, but not in most regions of DMN. Conceptual information related to the current goal dominates the multivariate response within DMN, which supports flexible retrieval by modulating its response to suit the task demands, alongside regions of multiple-demand cortex.SIGNIFICANCE STATEMENT We tested contrasting accounts of default mode network (DMN) function using multivoxel pattern analysis. By one view, semantically relevant parts of DMN represent conceptual similarity, regardless of task context. By an alternative view, DMN tracks changing task demands. Our semantic feature-matching task required participants to integrate conceptual knowledge with task goals, such that successive decisions were based on different features of the items. We demonstrate that DMN regions can decode the current goal, as it is applied, alongside multiple-demand regions traditionally associated with cognitive control, speaking to how DMN supports flexible cognition.
Keywords: control; decoding; default mode network; feature representation; multiple demand; semantic.
Copyright © 2021 the authors.
Figures
Similar articles
-
A gradient from long-term memory to novel cognition: Transitions through default mode and executive cortex.Neuroimage. 2020 Oct 15;220:117074. doi: 10.1016/j.neuroimage.2020.117074. Epub 2020 Jun 20. Neuroimage. 2020. PMID: 32574804 Free PMC article.
-
Default mode network shows distinct emotional and contextual responses yet common effects of retrieval demands across tasks.Hum Brain Mapp. 2024 May;45(7):e26703. doi: 10.1002/hbm.26703. Hum Brain Mapp. 2024. PMID: 38716714 Free PMC article.
-
Roles of the Default Mode and Multiple-Demand Networks in Naturalistic versus Symbolic Decisions.J Neurosci. 2021 Mar 10;41(10):2214-2228. doi: 10.1523/JNEUROSCI.1888-20.2020. Epub 2021 Jan 20. J Neurosci. 2021. PMID: 33472829 Free PMC article.
-
The neurocognitive basis of knowledge about object identity and events: dissociations reflect opposing effects of semantic coherence and control.Philos Trans R Soc Lond B Biol Sci. 2020 Feb 3;375(1791):20190300. doi: 10.1098/rstb.2019.0300. Epub 2019 Dec 16. Philos Trans R Soc Lond B Biol Sci. 2020. PMID: 31840592 Free PMC article. Review.
-
Cognition, emotion, and the default mode network.Brain Cogn. 2024 Dec;182:106229. doi: 10.1016/j.bandc.2024.106229. Epub 2024 Oct 30. Brain Cogn. 2024. PMID: 39481259 Review.
Cited by
-
Situation updating during discourse comprehension recruits right posterior portion of the multiple-demand network.Hum Brain Mapp. 2023 Apr 15;44(6):2129-2141. doi: 10.1002/hbm.26198. Epub 2023 Jan 5. Hum Brain Mapp. 2023. PMID: 36602295 Free PMC article.
-
Semantic processing in older adults is associated with distributed neural activation which varies by association and abstractness of words.Geroscience. 2024 Dec;46(6):6195-6212. doi: 10.1007/s11357-024-01216-x. Epub 2024 May 31. Geroscience. 2024. PMID: 38822124 Free PMC article.
-
Successful aging of musicians: Preservation of sensorimotor regions aids audiovisual speech-in-noise perception.Sci Adv. 2023 Apr 28;9(17):eadg7056. doi: 10.1126/sciadv.adg7056. Epub 2023 Apr 26. Sci Adv. 2023. PMID: 37126550 Free PMC article.
-
Physical distance to sensory-motor landmarks predicts language function.Cereb Cortex. 2023 Apr 4;33(8):4305-4318. doi: 10.1093/cercor/bhac344. Cereb Cortex. 2023. PMID: 36066439 Free PMC article.
-
Reduced temporal and spatial stability of neural activity patterns predict cognitive control deficits in children with ADHD.bioRxiv [Preprint]. 2024 May 30:2024.05.29.596493. doi: 10.1101/2024.05.29.596493. bioRxiv. 2024. Update in: Nat Commun. 2025 Mar 08;16(1):2346. doi: 10.1038/s41467-025-57685-x. PMID: 38854066 Free PMC article. Updated. Preprint.
References
Publication types
MeSH terms
LinkOut - more resources
Full Text Sources
Other Literature Sources
Research Materials
Miscellaneous