. 2021 Apr 14;41(15):3462-3478.
doi: 10.1523/JNEUROSCI.2718-20.2021. Epub 2021 Mar 4.

Glutamatergic Neurons in the Preoptic Hypothalamus Promote Wakefulness, Destabilize NREM Sleep, Suppress REM Sleep, and Regulate Cortical Dynamics

Affiliations

Glutamatergic Neurons in the Preoptic Hypothalamus Promote Wakefulness, Destabilize NREM Sleep, Suppress REM Sleep, and Regulate Cortical Dynamics

Alejandra Mondino et al. J Neurosci. .

Abstract

Clinical and experimental data from the last nine decades indicate that the preoptic area of the hypothalamus is a critical node in a brain network that controls sleep onset and homeostasis. By contrast, we recently reported that a group of glutamatergic neurons in the lateral and medial preoptic area increases wakefulness, challenging the long-standing notion in sleep neurobiology that the preoptic area is exclusively somnogenic. However, the precise role of these subcortical neurons in the control of behavioral state transitions and cortical dynamics remains unknown. Therefore, in this study, we used conditional expression of excitatory hM3Dq receptors in these preoptic glutamatergic (Vglut2+) neurons and show that their activation initiates wakefulness, decreases non-rapid eye movement (NREM) sleep, and causes a persistent suppression of rapid eye movement (REM) sleep. We also demonstrate, for the first time, that activation of these preoptic glutamatergic neurons causes a high degree of NREM sleep fragmentation, promotes state instability with frequent arousals from sleep, decreases body temperature, and shifts cortical dynamics (including oscillations, connectivity, and complexity) to a more wake-like state. We conclude that a subset of preoptic glutamatergic neurons can initiate, but not maintain, arousals from sleep, and their inactivation may be required for NREM stability and REM sleep generation. Further, these data provide novel empirical evidence supporting the hypothesis that the preoptic area causally contributes to the regulation of both sleep and wakefulness.SIGNIFICANCE STATEMENT Historically, the preoptic area of the hypothalamus has been considered a key site for sleep generation. However, emerging modeling and empirical data suggest that this region might play a dual role in sleep-wake control. We demonstrate that chemogenetic stimulation of preoptic glutamatergic neurons produces brief arousals that fragment sleep, persistently suppresses REM sleep, causes hypothermia, and shifts EEG patterns toward a "lighter" NREM sleep state. We propose that preoptic glutamatergic neurons can initiate, but not maintain, arousal from sleep and gate REM sleep generation, possibly to block REM-like intrusions during NREM-to-wake transitions. In contrast to the long-standing notion in sleep neurobiology that the preoptic area is exclusively somnogenic, we provide further evidence that preoptic neurons also generate wakefulness.

Keywords: DREADDs; arousal; consciousness; gamma; sleep fragmentation; slow oscillations.


Figures

Figure 1.
Figure 1.
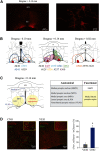
Histologic confirmation of hM3Dq receptor expression in the preoptic area of Vglut2-Cre mice used in sleep studies, and confirmation of neuronal activation caused by CNO administration. A, Left, Right, Examples of low- and high-magnification photographs, respectively, of mCherry immunohistochemical staining (red), indicating the expression of the excitatory designer receptor hM3Dq within the VLPO of a Vglut2-Cre mouse. B, Color-coded depiction of the area of hM3Dq receptor expression is represented on coronal schematics of the preoptic area modified from a mouse brain atlas (Paxinos and Franklin, 2001). Middle, Filled areas of hM3Dq expression highlight mice #437 and #361 (also indicated by underlined numbers below the brain schematic), which had the largest increase in sleep and wakefulness, respectively. For anatomic reference, solid red represents the bilateral sites corresponding to the VLPO. Color-matched identification numbers for each mouse used in the sleep studies (n = 11) are listed below each panel. C, Schematic of the preoptic area illustrating relevant anatomic subdivisions and main area of designer receptor expression (yellow circles). Right, Chart compares the anatomic subdivisions and functional nomenclature used in this study. Based on the uniform response to chemogenetic stimulation, different from that observed in MnPO studies (Vanini et al., 2020), the area of hM3Dq receptor expression in the current study is referred to as the medial-lateral preoptic region. D, cFos expression (green nuclei) in mCherry-positive (red) neurons in the medial-lateral preoptic region after CNO (1.0 mg/kg; n = 4 mice) and VEH (n = 4) administration. Graph plots the percentage (mean ± SEM) of mCherry-positive neurons that also expressed cFos over the total count of mCherry-positive neurons. Two-tailed unpaired t test was used for statistical comparison between treatment conditions. *Significant difference (p < 0.05) relative to control. Scale bars: high-magnification photographs (insets), 20 µm. aca, Anterior commissure; 3V, third ventricle.
Figure 2.
Figure 2.
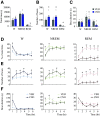
Chemogenetic activation of glutamatergic neurons in the medial-lateral preoptic region increased wakefulness and decreased NREM and REM sleep. A, Time spent in wakefulness, NREM sleep, and REM sleep, averaged across the 6 h recording period, after administration of VEH and CNO (1.0 mg/kg) in n = 11 mice. B, Effect on the number of wakefulness, NREM sleep, and REM sleep bouts. C, Changes in the mean duration of wake, NREM sleep, and REM sleep bouts. Additionally, analyses of sleep-wake parameters were conducted in 1 h blocks after VEH (lighter color) and CNO (darker color) injection. D, Percent of total time in wakefulness, NREM sleep, and REM sleep. E, Number of bouts per state. F, Mean duration of wake, NREM sleep, and REM sleep bouts. A–C, A one-tailed paired t test with Bonferroni correction was used for statistical comparisons. D–F, Two-way, repeated-measures ANOVA followed by a Sidak test adjusted for multiple comparisons was used to statistically compare sleep-wake parameters shown as a function of time and treatment condition. Data are mean ± SEM. *Significant difference (p < 0.05) relative to control.
Figure 3.
Figure 3.
Chemogenetic activation of glutamatergic neurons in the medial-lateral preoptic region altered sleep-wake patterns. A, Schematic representation of bilateral injections of a Cre-dependent adeno-associated virus for expression of the excitatory designer receptor hM3Dq into the medial-lateral preoptic region of Vglut2-Cre mice. Three weeks after the injection, mice were implanted with electrodes for recording the EEG from the right frontal (purple) and right occipital (yellow) cortex. A reference electrode was placed over the cerebellum (orange), and two electrodes were also implanted bilaterally in the neck muscles for recording the EMG. Right, Representative EEG and EMG signals from a mouse during wakefulness, NREM sleep, and REM sleep. B, Hypnogram pairs illustrate the temporal organization of sleep-wake states after VEH (left panels) and 1.0 mg/kg CNO (right panels) for each mouse (n = 11). The height of the bars (from lowest to highest) represents the occurrence of wakefulness (W), NREM sleep, and REM sleep. Time 0 on the abscissa indicates the time at which the mouse received the injection of VEH or CNO. Mouse identification numbers are listed between each pair of hypnograms. Individual differences relative to control (% change) in the time spent in wakefulness (blue), NREM sleep (green), and REM sleep (red) after CNO injection are shown to the right of each CNO hypnogram. Representative spectrograms and power plots below the top two hypnograms corresponding to Mouse #559 show, respectively, state- and treatment-specific changes in frontal power density and normalized δ power with median filter across the 6 h recording session.
Figure 4.
Figure 4.
Activation of glutamatergic neurons in the medial-lateral preoptic region increased the latency to NREM and REM sleep. A, Effect of CNO (1.0 mg/kg) injection on NREM (left) and REM sleep (right) latencies in n = 11 mice. Data are mean ± SEM. One-tailed paired t test was used for statistical comparisons. *Significant difference (p < 0.05) relative to control. B, Graphs represent the probability of no NREM sleep (left) and REM sleep (right) generation after injection of VEH or CNO. Survival analysis demonstrated that the probability of no REM sleep occurring remained increased throughout the 6 h recording period and was significantly different between treatment condition in both NREM (p = 0.0006) and REM sleep (p = 0.0001).
Figure 5.
Figure 5.
Activation of glutamatergic neurons in the medial-lateral preoptic region increased NREM to wake transitions and caused NREM sleep fragmentation. A, Number of transitions from NREM to wakefulness (W) averaged across the 6 h recording period (left) and per 1 h block (right) after injection of VEH or CNO in n = 11 mice. Data are mean ± SEM. One-tailed paired t test (6 h block) and two-way repeated-measures ANOVA followed by a Sidak test to correct for multiple comparisons (1 h block analysis) was used for statistical comparisons between treatment conditions. *Significant difference (p < 0.05) relative to control. B, Diagram of the Markov model for wakefulness (W)–NREM sleep–REM sleep dynamics after VEH and CNO (1.0 mg/kg) injection in n = 11 mice. Circular arrows indicate the probability of remaining within the same state. Straight arrows indicate the probability of transitioning from one state to another. The thickness of the arrows is proportional to the corresponding probability. Two different scales were used: one for the circular arrows and another one for straight arrows; that is, circular arrows were designed with continuous lines, whereas straight arrows were designed with dotted lines. Differences between VEH and CNO were analyzed by means of Wilcoxon matched-pairs rank tests. *Significant difference (p < 0.05) relative to control. C, FI calculated from n = 11 mice for each 1 h block during wakefulness and NREM sleep after VEH or CNO injection. We defined FI as FI = 1 – p(X/X), being p(X/X) the probability of transitioning from the State X to the same State X. This implies that FI = 1 only if the state is completely fragmented, that is, if the probability of transitioning to the same state equals 0. Error bars indicate SEM. Differences between VEH and CNO were analyzed by means of Wilcoxon matched-pairs rank tests. p values were corrected by the Benjamini-Hochberg for a false discovery rate of 5%. *Significant difference (p < 0.05) relative to control. D, Histograms represent the probability distribution of episode durations calculated from n = 11 mice in units of 10 s of wakefulness and in units of 50 s of NREM sleep. VEH and CNO histograms were overlapped to better appreciate the differences. The difference in the distribution of episode duration between VEH and CNO injection was analyzed by means of a Kolmogorov-Smirnov test. Episode duration after CNO and VEH had a different distribution in both wakefulness (p < 0.0001) and NREM sleep (p < 0.0001), with increased short and reduced long bouts after CNO administration.
Figure 6.
Figure 6.
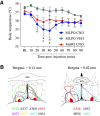
Activation of glutamatergic neurons in the medial-lateral preoptic region causes hypothermia in awake mice. A, The time course of core body temperature in awake mice before and after injection of VEH control solution (n = 5 mice) or CNO (1.0 mg/kg) for activation of glutamatergic neurons within the MnPO (n = 9) and medial-lateral preoptic region (MLPO; n = 10). Temperature values for the MnPO are from Vanini et al. (2020, their Fig. 3; see also their Fig. S4 showing the distribution of the excitatory designer receptor hM3Dq within the MnPO of Vglut2-Cre mice used in that study). Data are mean ± SEM. Two-way ANOVA followed by a post hoc Dunnett's test corrected for multiple-comparisons was used for statistical comparisons of mean temperature levels after VEH and CNO injection relative to baseline (BL). Differences in temperature levels between the VEH and the medial-lateral preoptic group, and medial-lateral preoptic versus MnPO glutamatergic group were assessed by Tukey's and Sidak's post hoc tests. *Significant difference (p < 0.05) in the medial-lateral preoptic group relative to baseline. #Significant difference relative to VEH. B, Color-coded area of hM3Dq receptor expression within the medial-lateral preoptic region of Vglut2-Cre mice used for temperature experiments, represented on coronal schematics of the preoptic area modified from a mouse brain atlas (Paxinos and Franklin, 2001).
Figure 7.
Figure 7.
CNO administration to Vglut2-Cre mice that did not express designer receptors did not alter sleep-wake states. Sleep data from Vglut2-Cre mice injected with (1) AAV-hSyn-DIO-hM3D(Gq)-mCherry into the preoptic area but did not express designer receptors (n = 5) and (2) the control vector AAV-hSyn-DIO-mCherry (n = 4) were pooled together and used as negative controls. A, Group data summarizing total time in wakefulness, NREM sleep, and REM sleep after VEH or CNO (1.0 mg/kg) injection. B, Number of bouts of wakefulness, NREM sleep, and REM sleep. C, Comparison of mean episode duration per state. A one-tailed paired t test with Bonferroni correction was used for statistical comparisons between treatment conditions. D–F. Graphs plot the mean time (expressed as percent of total recording time) in wakefulness, NREM sleep, and REM sleep, respectively, for each 1 h block after VEH and CNO administration. Two-way repeated-measures ANOVA followed by a Bonferroni test was used for statistical comparisons. G, Latency to NREM and REM sleep. A one-tailed paired t test was used for statistical comparisons between treatment conditions. H, I, FI calculated for NREM and REM sleep, respectively, plotted for each 1 h block after VEH and CNO injection. Wilcoxon matched-pairs rank tests were used for statistical comparisons between treatment conditions. Data are mean ± SEM. J, Left, Right, Low- and high-magnification photographs, respectively, of mCherry immunohistochemical staining (red) corresponding to the fluorescent reporter of the control vector within the VLPO of a Vglut2-Cre mouse. Scale bars: Left, 500 µm; Right, 100 µm. K, Color-coded depiction of control vector injection area, represented on coronal schematics of the preoptic area modified from a mouse brain atlas (Paxinos and Franklin, 2001). Color-matched identification numbers for each mouse used in this study are listed on the left side of each panel. aca, Anterior commissure; 3V, third ventricle.
Figure 8.
Figure 8.
Activation of glutamatergic neurons in the MnPO of the hypothalamus did not substantially alter sleep-wake states. Sleep data from a previous study (collected using identical procedures and experiment design) (Vanini et al., 2020) were reanalyzed and used in the current study as a site-control group. All Vglut2-Cre mice (n = 7) included in this control group had confirmed hM3Dq receptor expression in MnPO glutamatergic neurons (for information on the distribution of the excitatory designer receptor hM3Dq within the MnPO, see Vanini et al., 2020, their Fig. S4). A, Group data summarizing total time in wakefulness, NREM sleep, and REM sleep after VEH or CNO (1.0 mg/kg) injection. B, Number of bouts of wakefulness, NREM sleep, and REM sleep. C, Comparison of mean episode duration per state. A one-tailed paired t test with Bonferroni correction was used for statistical comparisons between treatment conditions. D–F, Graphs represent the mean time (expressed as percent of total recording time) in wakefulness, NREM sleep, and REM sleep, respectively, for each 1 h block after VEH and CNO administration. Two-way repeated-measures ANOVA followed by a Bonferroni test was used for statistical comparisons. G, Latency to NREM and REM sleep. A one-tailed paired t test was used for statistical comparisons. H, I, FI calculated for NREM and REM sleep, respectively, plotted for each 1 h block after VEH and CNO injection. Wilcoxon matched-pairs rank tests were used for statistical comparisons between treatment conditions. Data are mean ± SEM.
Figure 9.
Figure 9.
Activation of glutamatergic neurons in the medial-lateral preoptic region decreased the spectral power of slow oscillations and increased δ power. Graphs plot normalized spectral power in the right frontal (rFr) and occipital (rOcc) regions during wakefulness (W) and NREM sleep, after injection of VEH or CNO (1.0 mg/kg) in n = 10 mice. Traces represent mean values (thin, dark lines) ± the SEM (shaded area above and below the mean). Alternating vertical-colored bands in the background of the graphs represent frequency ranges. Because notch filters were applied to some recording pairs (i.e., VEH and CNO recordings from the same mouse), frequencies between 45 and 75 Hz were excluded from the analysis. Two-way repeated-measures ANOVA followed by a Sidak test corrected for multiple comparisons was used for statistical comparison of spectral power in each frequency band. *Significant difference (p < 0.05) relative to control. SO, Slow oscillations; lγ, low-γ; hγ, high-γ.
Figure 10.
Figure 10.
Activation of glutamatergic neurons in the medial-lateral preoptic region increased cortical connectivity. Mean Z'coherence (undirected connectivity) profile between right frontal and occipital as a function of state (wakefulness [W] and NREM sleep) and treatment (VEH and CNO 1.0 mg/kg) in n = 10 mice. Traces represent mean values (thin, dark lines) ± the SEM (shaded area above and below the mean). Alternating vertical-colored bands in the background of the graphs represent frequency ranges. Because notch filters were applied to some recording pairs (i.e., VEH and CNO recordings from the same mouse), frequencies between 45 and 75 Hz were excluded from the analysis. *Significant difference (p < 0.05) relative to control. SO, Slow oscillations; lγ, low-γ; hγ, high-γ.
Figure 11.
Figure 11.
Activation of glutamatergic neurons in the medial-lateral preoptic region increased EEG signal complexity. Graphs plot corrected LZc (cLZc) values during wakefulness (W) and NREM sleep for frontal (A) and occipital (B) regions. Data are mean ± SEM. Differences between VEH and CNO (1.0 mg/kg) in n = 10 mice were analyzed by two-tailed paired t tests. *Significant difference (p < 0.05) relative to control.

Similar articles

Cited by

References

    1. Abasolo D, Simons S, Morgado da Silva R, Tononi G, Vyazovskiy VV (2015) Lempel-Ziv complexity of cortical activity during sleep and waking in rats. J Neurophysiol 113:2742–2752. 10.1152/jn.00575.2014 - DOI - PMC - PubMed
    1. Abbott SB, Saper CB (2017) Median preoptic glutamatergic neurons promote thermoregulatory heat loss and water consumption in mice. J Physiol 595:6569–6583. 10.1113/JP274667 - DOI - PMC - PubMed
    1. Alam MA, Kumar S, McGinty D, Alam MN, Szymusiak R (2014) Neuronal activity in the preoptic hypothalamus during sleep deprivation and recovery sleep. J Neurophysiol 111:287–299. 10.1152/jn.00504.2013 - DOI - PMC - PubMed
    1. Alam MN, Mallick BN (1990) Differential acute influence of medial and lateral preoptic areas on sleep-wakefulness in freely moving rats. Brain Res 525:242–248. 10.1016/0006-8993(90)90870-h - DOI - PubMed
    1. Amici R, Zamboni G, Perez E, Jones CA, Parmeggiani PL (1998) The influence of a heavy thermal load on REM sleep in the rat. Brain Res 781:252–258. 10.1016/s0006-8993(97)01242-0 - DOI - PubMed

Publication types

Substances