. 2021 Mar 4;12(3):234.
doi: 10.1038/s41419-020-03313-z.

Aberrant Gcm1 expression mediates Wnt/β-catenin pathway activation in folate deficiency involved in neural tube defects

Affiliations

Aberrant Gcm1 expression mediates Wnt/β-catenin pathway activation in folate deficiency involved in neural tube defects

Jianting Li et al. Cell Death Dis. .

Abstract

Wnt signaling plays a major role in early neural development. An aberrant activation in Wnt/β-catenin pathway causes defective anteroposterior patterning, which results in neural tube closure defects (NTDs). Changes in folate metabolism may participate in early embryo fate determination. We have identified that folate deficiency activated Wnt/β-catenin pathway by upregulating a chorion-specific transcription factor Gcm1. Specifically, folate deficiency promoted formation of the Gcm1/β-catenin/T-cell factor (TCF4) complex formation to regulate the Wnt targeted gene transactivation through Wnt-responsive elements. Moreover, the transcription factor Nanog upregulated Gcm1 transcription in mESCs under folate deficiency. Lastly, in NTDs mouse models and low-folate NTDs human brain samples, Gcm1 and Wnt/β-catenin targeted genes related to neural tube closure are specifically overexpressed. These results indicated that low-folate level promoted Wnt/β-catenin signaling via activating Gcm1, and thus leaded into aberrant vertebrate neural development.


Conflict of interest statement

The authors declare that they have no conflict of interest.

Figures

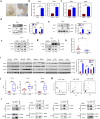
Fig. 1
Fig. 1. Wnt/β-catenin pathway signaling activation in cells with folate deficiency.
a Morphology of C57BL/6 mESCs as observed with an optical microscope at magnifications of ×100 and ×200, F6, sixth generation of C57BL/6 mESCs. b Analysis of the cell cycle distribution of C57BL/6 mESCs after six generations of culture under folate deficiency by flow cytometry. 3 × 106 cells were harvested for control and case group respectively; right panel: the results of cell cycle quantification were graded according to the cell cycle phase. c Analysis of apoptosis in C57BL/6 mESCs after six generations of culture under folate deficiency by flow cytometry. 3 × 106 cells were harvested for control and case group, respectively, the number of cells in early apoptosis is shown in a bar graph in the right panel. d Folate concentration in C57BL/6 mESCs after six generations of culture in folate deficiency and in NE-4C after three generations of culture in folate deficiency. e The mRNA expression of Fzd5, Lrp, Wnt6, Ccnd1, Nfat5, Lef1, TCF4, TCF12, Bcl9l, and Axin2 in C57BL/6 mESCs with folate deficiency. f Analysis of luciferase activity by TOP/FOP Flash assays in C57BL/6 mESCs subjected to folate deficiency for six generations and NE-4C subjected to folate deficiency for three generations. Data a–f represent the mean ± SEM (n = 3). The p value was calculated by Student’s t-test, ns was for no significance, *P < 0.05, **P < 0.01, ***P < 0.001.
Fig. 2
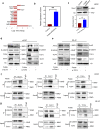
Fig. 2. Folate deficiency upregulates Gcm1 to promote formation of the Gcm1/β-catenin/TCF4 complex.
a Differentially expressed NTD-related genes in the microarray expression profiles of C57BL/6 mESCs cultured in folate-deficient conditions for six generations. The microarray data were obtained from three replicates for both control and folate-deficient cells. The X-axis represents the Log2 fold change. bThe mRNA expression of Gcm1 in C57BL/6 mESCs after six generations of folate deficiency. **P = 0.004. c Increased expression of Gcm1 in mESCs with folate deficiency. Top panel: western blots of Gcm1 in control and folate-deficient cells; bottom panel: bar graph showing the quantification of the western blot signal intensities. d Efficiency of siRNA-mediated Gcm1 and siRNA-mediated TCF4 depletion and the expression of TCF4, Gcm1 and Axin2 at the protein level in C57BL/6 mESCs. mESCs with folate deficiency were transfected into either scramble siRNA control or Gcm1 siRNA and TCF siRNA, and post 72 h of transfection, the expression was determined by western blotting. e Efficiency of siRNA-mediated Gcm1 and TCF4 depletion and the expression of TCF4 and Axin2 at the protein level in NE-4C. NE-4C with folate deficiency were transfected into either scramble siRNA control or Gcm1 siRNA, TCF4-siRNA, and the expression was determined 72 h post transfection by western blotting. f A coimmunoprecipitation (Co-IP) assay was used to identify the interaction between Gcm1, β-catenin, and TCF4 in C57BL/6 mESC. Immunoprecipitation (IP) was performed using an anti-Gcm1 antibody and TCF4 antibody, and immunoblotting (IB) was performed using an anti-β-catenin antibody. g A Co-IP assay was used to identify the interactions between Gcm1 and TCF4, β-catenin in NE-4C. An anti-Gcm1 antibody and anti-TCF4 antibody was used for IP, and an anti-TCF4 antibody and anti-β-catenin was used for IB. Data b–f represent the mean ± SEM (n = 3). The p value was calculated by Student’s t-test, ns was for no significance, *P < 0.05, **P < 0.01, ***P < 0.001.
Fig. 3
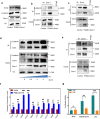
Fig. 3. Gcm1 overexpression activates the Wnt/β-catenin pathway in normal C57BL/6 mESCs and NE-4C.
a Increased expression of Axin2 in mESCs with Gcm1 overexpression. The western blots show that the Gcm1 overexpression plasmid increased Axin2 expression in normal C57BL/6 mESCs. PGMLV-Gcm1, Gcm1 plasmid. mESCs were transfected with either control siRNA or pGMLV-Gcm1, and the expression levels were determined 72 h post transfection by western blotting. b A Co-IP assay was used to identify the interaction between Gcm1 and β-catenin in cells transfected with pGMLV-Gcm1 overexpression plasmid in C57BL/6 mESCs. An anti-Gcm1 antibody was used for IP, and IB was performed using an anti-β-catenin antibody. c A Co-IP assay was used to identify the interaction between Gcm1 and TCF4 in cells transfected with pGMLV-Gcm1 overexpression plasmid in C57BL/6 mESCs. An anti-Gcm1 antibody was used for IP, and IB was performed using an anti-TCF4 antibody. d A Co-IP assay identified increase interactions between TCF4 and β-catenin in cells transfected with 0.5, 2, and 4 µg of pGMLV-Gcm1 for 72 h in C57BL/6 mESCs. e A Co-IP assay was used to identify the interaction between Gcm1 and TCF4, β-catenin in NE-4C cells transfected with the pGMLV-Gcm1 overexpression plasmid. An anti-Gcm1 antibody was used for IP, and IB was performed using an anti-TCF4 antibody and anti-β-catenin antibody. f The mRNA expression of Fzd5, Lrp, Wnt6, Ccnd1, Nfat5, Lef1, Tcf4, Tcf12, Bcl9L, and Axin2 in C57BL/6 mESCs transfected with the overexpression vector pGMLV-Gcm1. The mRNA was extracted from the mESCs after transfection with pGMLV-Gcm1 for 72 h. g Analysis of luciferase activity by TOP/FOP Flash assays in C57BL/6 mESCs transfected with pGMLV-Gcm1 overexpression plasmid relative to those transfected with scramble plasmid in normal and LiCl medium. LiCl (10 mmol) was added to the control medium before 72 h of transfection. Data a–g represent the mean ± SEM (n = 3). The p value was calculated by Student’s t-test, ns was for no significance, *P < 0.05, **P < 0.01, ***P < 0.001.
Fig. 4
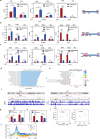
Fig. 4. Gcm1 competes with β-catenin for binding to TCF4 and is associated with Wnt target genes expression.
a ChIP-qPCR analysis of Gcm1, β-catenin and TCF4 enrichment in Wnt-responsive element (WREs) of Axin2 in control and folate-deficient mESCs. NEG negative control, TSS transcription start site. Right panel: the locations of the WRE and NEG in the promoter. b ChIP-qPCR analysis of Gcm1, β-catenin, and TCF4 enrichment in the WREs of Bcl9l in control and folate-deficient mESCs. Right panel: the locations of the WREs and NEG in the promoter. c ChIP-qPCR analysis of Gcm1, β-catenin, and TCF4 enrichment in the WREs of Isl1 in control and folate-deficient mESCs. Right panel: the locations of the WREs and NEG in the promoter. d Functional clustering of genes associated with Gcm1 ChIP-peaks in mESCs with folate deficiency (the top 10 categories are shown). The X-axis represents the log10 value of the binomial raw P value. e Pathway analysis of Gcm1 ChIP-peaks in mESCs with folate deficiency (the top 10 categories are shown). Gcm1 binding pathway enrichment was determined using PANTHER analysis. The X-axis represents the enrichment factor, the Y-axis represents the binomial raw P value, and the size of each circle represents the number of genes. f Representative examples of Ctla4 and Edn1 chromatin binding. A segment of chromosome 1 demonstrates the decreased binding of Clta4 to a TBE in folate-deficient compared to normal mESCs. A segment of chromosome 13 demonstrates the decreased binding of Edn1 to a TBE in folate-deficient group compared to normal mESCs. g ChIP-qPCR analysis of Clta4 and Edn1 in mESCs with folate deficiency. *P = 0.015 (Clta4) and *P = 0.022 (Edn1). h The mRNA expression of Clta4 (J) and Edn1 (K) in mESCs with folate deficiency. *P = 0.015 (Clta4) and *P = 0.04 (Edn1). i Correlation analysis between ChIP density and the mRNA expression of Clta4 and Edn1. The correlation coefficients for Clta4 is 0.739 (P = 0.003), and for Edn1 is 0.45 (P = 0.002). j Correlation of the tag densities (Y-axis) with the transcription levels of genes from −3 kb to +3 kb (X-axis). All the genes were divided into five groups based on their transcription levels from high (dark blue) to low (orange). The mean-normalized ChIP-seq densities with 1-bp resolution are plotted within a 6-kb region flanking the TSS or the TTS (transcription termination site). Data a–c, g–i represent the mean ± SEM (n = 3). The p value was calculated by Student’s t-test, ns was for no significance, *P < 0.05, **P < 0.01, ***P < 0.001.
Fig. 5
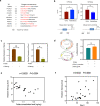
Fig. 5. Nanog upregulates Gcm1 promoter activity.
a Enrichment scores of transcription factor binding motifs in the mouse Gcm1 promoter. TF transcription factor. The size of the circle represents the −log10 (P value). b Nanog recognizes the Gcm1 promoter. C57BL/6 mESCs were subjected to ChIP analysis using Nanog antibodies. The immunoprecipitated complexes were analyzed by PCR. The TBE sites are located within 1 kb upstream of the Gcm1 promoter; the arrows represent the start and end sites of the PCR amplicons (bottom panel). c Efficiency of siRNA-mediated Nanog depletion and the expression of Gcm1 at mRNA level. C57BL/6 mESCs with folate deficiency were transfected with either control scramble siRNA or Nanog-siRNA, and the expression levels were determined 24 h post transfection by real-time RT-PCR. Left panel: quantification of Nanog in control scramble siRNA and si-Nanog cells; right panel: quantification of Gcm1 in control scrambles siRNA and si-Nanog cells. d Analysis of Gcm1 promoter-driven luciferase reporter activity in folate-deficient mESCs cotransfected with control plasmid or Nanog plasmid. Experimental mESCs were transfected with 1.5 µg of pGcm1-promoter, and control mESCs were transfected with 5.5 µg of Nanog-HA. The structures of the Gcm1 promoter reporter construct and the Nanog-HA construct are shown in the left panel. At 48 h post transfection, the cells were harvested for luciferase reporter assays. e Correlation analysis of folate concentration and Nanog mRNA expression in low-folate NTDs (n = 12). f Correlation analysis of Nanog mRNA expression and Gcm1 mRNA expression in low-folate NTDs, determined by Nanostring (n = 12). Data b–d represent the mean ± SEM (n = 3). Data e, f represent the mean mean ± SEM (n = 12). The p value was calculated by Student’s t-test, ns was for no significance, *P < 0.05, ** P < 0.01, ***P < 0.001.
Fig. 6
Fig. 6. Gcm1 and Axin2 are significantly upregulated in NTDs models.
a Morphology of CD-1 mouse embryos with low-folate diet and MTX induced from E9.5, left panel is control mouse fetus, right panels are NTDs mouse fetuses. The arrowhead is where the NTDs located; the left panel of NTDs embryos is schizencephaly. Scale bars, 100 μm. b The mRNA expression of Gcm1 in the brains and spines of NTD model mice. *P = 0.0003(brains) and *P = 0.01 (spines). c The mRNA expression of Axin2 in the brains and spines of NTD model mice. *P = 0.002(brains) and **P = 0.02 (spines). d Increased expression of Gcm1 and Axin2 in NTD mouse brains. Left panel: western blots of Gcm1 in normal and NTD brains; right panel: bar graph showing the quantification of the western blot signal intensities. e Increased expression of Gcm1 and Axin2 in NTD mouse spines. Left panel: western blots of Gcm1, Axin2 in normal and NTD brains; right panel: bar graph showing the quantification of the western blot signal intensities. f A Co-IP assay was used to identify the interaction between Gcm1 and TCF4, β-catenin in control and NTDs mouse brains. An anti-Gcm1 antibody was used for IP, and an anti-TCF4 antibody and anti-β-catenin was used for IB, Con was for Control. g A Co-IP assay was used to identify the interaction between Gcm1 and TCF4, β-catenin in control and NTDs mouse spines. An anti-Gcm1 antibody was used for IP, and an anti-TCF4 antibody and anti-β-catenin was used for IB, Con was for Control. h Folate concentrations in control human fetal brain tissue and spina bifida human fetal brain tissue. The data were obtained from 40 human fetus brains. i Increased expression of Gcm1, Axin2, and Atoh1 in human NTD brain samples. Left panel: western blots of Gcm1 in brains of normal humans (n = 20) and human NTD (n = 20) samples; right panel: bar graph showing the quantification of the western blot signal intensities. j The mRNA expression of Gcm1, Axin2, and Atoh1 in the NTDs fetuses, determined by Nanostring (n = 12). k Correlation analysis of folate concentration and Gcm1 mRNA expression (left panel); Gcm1 mRNA expression and Axin2 mRNA expression, Atoh1 mRNA expression (right panel) n = 12. l A Co-IP assay identified an interaction between Gcm1 and β-catenin in randomly selected low-folate fetal brains. Data a–h, l represent the mean ± SEM (n = 3). Data i represent the mean ± SEM (n = 20), Data j, k represent the mean ± SEM (n = 12), The p value was calculated by Student’s t-test, ns was for no significance, *P < 0.05, **P < 0.01, ***P < 0.001.

Similar articles

Cited by

References

    1. Wallingford JB, Niswander LA, Shaw GM, Finnell RH. The continuing challenge of understanding, preventing, and treating neural tube defects. Science. 2013;339:1222002. doi: 10.1126/science.1222002. - DOI - PMC - PubMed
    1. Czeizel AE, Dudás I. Prevention of the first occurrence of neural-tube defects by periconceptional vitamin supplementation. N. Engl. J. Med. 1992;327:1832–1835. doi: 10.1056/NEJM199212243272602. - DOI - PubMed
    1. Bielen H, Houart C. The Wnt cries many: Wnt regulation of neurogenesis through tissue patterning, proliferation, and asymmetric cell division. Dev. Neurobiol. 2014;74:772–780. doi: 10.1002/dneu.22168. - DOI - PubMed
    1. McMahon AP, Bradley A. The Wnt-1 (int-1) proto-oncogene is required for development of a large region of the mouse brain. Cell. 1990;62:1073–1085. doi: 10.1016/0092-8674(90)90385-R. - DOI - PubMed
    1. Han M, et al. Folate rescues lithium-, homocysteine- and Wnt3A-induced vertebrate cardiac anomalies. Dis. Model Mech. 2009;2:467–478. doi: 10.1242/dmm.001438. - DOI - PMC - PubMed

Publication types

MeSH terms