

doi: 10.1038/s41408-021-00442-2.
Novel molecular subgroups within the context of receptor tyrosine kinase and adhesion signalling in multiple myeloma
Affiliations
- PMID: 33664224
- PMCID: PMC7933144
- DOI: 10.1038/s41408-021-00442-2
Item in Clipboard
Novel molecular subgroups within the context of receptor tyrosine kinase and adhesion signalling in multiple myeloma
Blood Cancer J.
.
No abstract available
Conflict of interest statement
The authors declare no competing interests.
Figures
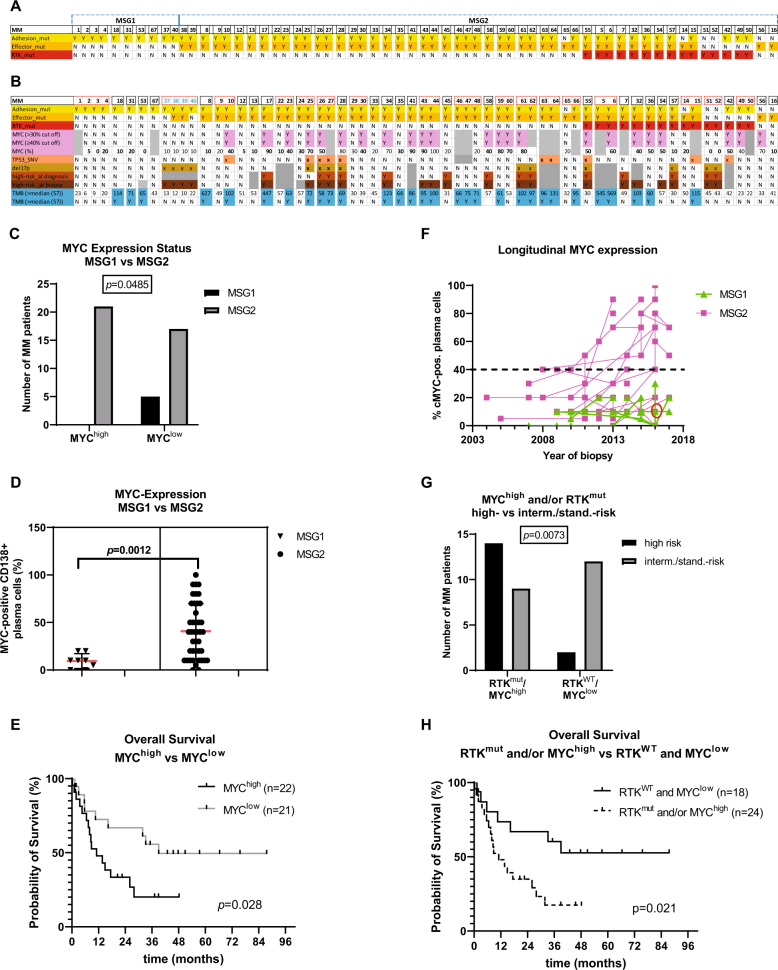
Visual overview of the molecular subgroups MSG1 and MSG2 and their correlation with MYC expression, TP53 mutations (TP53_SNV), deletions in 17p (del17p), and overall high-risk status. MM patients (x axis) were assigned to the subgroups MSG1 (mutations only in adhesion molecules (yellow)) and MSG2 (mutations in RTKs (red) and RTK effectors (orange)). The separation of the individual patients is indicated by small gaps (A). Of the MM patients with longitudinal information available (red rectangle) all but one ((MM37-40), T/N (71/52; 85/86; 99/-; 149/-, in blue)) retained their original subgroup designation (B). The frequency of MM with MYC expression ≥40% was higher in MSG2 (n = 42, grey bars) than in MSG1 (n = 8, black bars) (C) and the median MYC expression was significantly lower in MSG1 compared to MSG2 (10% vs 40%) (D). Median OS from the time of biopsy was 39.0 months for patients with MYC expression <40% (MYClow, n = 21, solid line) versus 11.1 months for patients with MYC expression ≥40% (MYChigh, n = 22, dashed line). E Longitudinal MYC expression in all sequential trephine biopsies of each MM patient included in the study. The majority of MSG2 MM (pink squares) were either MYChigh throughout the disease or were initially MYClow and became MYChigh later. MSG1 MM (green triangles) always remained MYClow throughout the disease. Please note that all samples of the patient with biopsies MM37-40 are labelled in green although this patient switched subgroups from MSG1 (MM37) to MSG2 in 2016 (MM38 and 39, red circle) and back to MSG1 (MM40) in 2017. F Integration of MYC expression and RTKmut status and subsequent correlation with risk status using Fisher’s exact test (G) and OS using the Kaplan Meier method (H). Median time of OS from biopsy for cases with RTKmut and/or MYChigh (1–2) was 11.1 months, while the median OS for cases with neither RTKmut nor MYChigh (0) was not reached yet. MSG: molecular subgroup, RTK: receptor tyrosine kinase, mut: mutation, SNV: single nucleotide variation, yellow: mutation in adhesion molecules, orange: mutation in effector molecules, red: mutation in RTKs, light purple: high MYC expression (≥40%/>30% of plasma cells), salmon: mutation in TP53, ochre: del17p, light brown: high-risk at diagnosis, dark brown: high-risk at biopsy, turquoise: TMB > 57 SNVs. Y: yes, N: no, grey: not available.
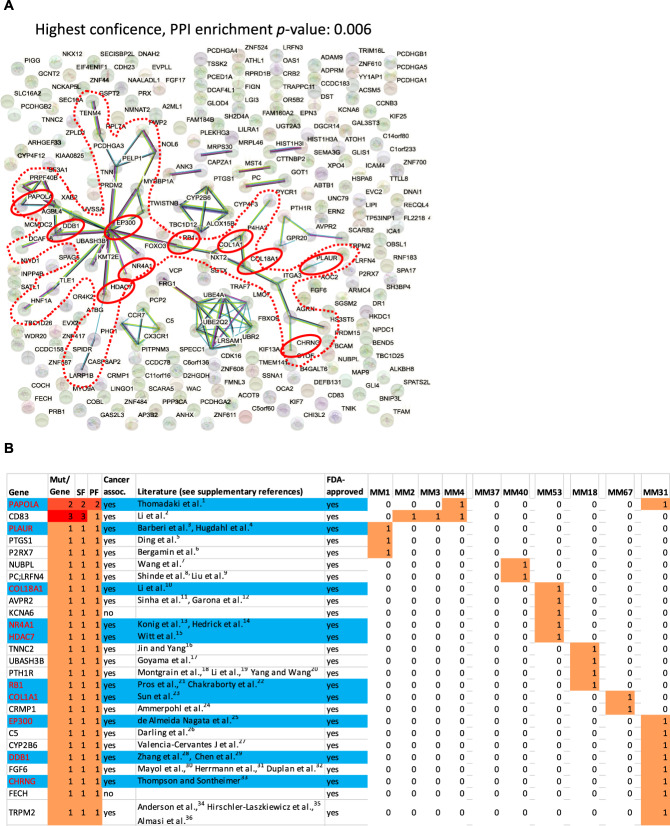
The red dotted frame highlights the “core-network” of 34 genes and the red circles depict drug-associated genes—according to the Drug Gene Interaction Database (DGIdb)—within the core network (n = 10) (A). Distribution of drug-associated MSG1 genes (26/241) among MSG1 MM and their possible association with cancer according to the literature (for reference details, see Supplementary References). The blue colour highlights the 10 drug-associated core-network genes that were highlighted by red circles in Figure 2A (B). SF sample frequency, PF patient frequency, mut mutation.
References
Publication types
MeSH terms
Substances
LinkOut - more resources
Full Text Sources
Other Literature Sources
Medical
