. 2021 Mar 4;12(3):243.
doi: 10.1038/s41419-021-03534-w.

Small intestinal immune-environmental changes induced by oral tolerance inhibit experimental atopic dermatitis

Affiliations

Small intestinal immune-environmental changes induced by oral tolerance inhibit experimental atopic dermatitis

Han-Na Um et al. Cell Death Dis. .

Abstract

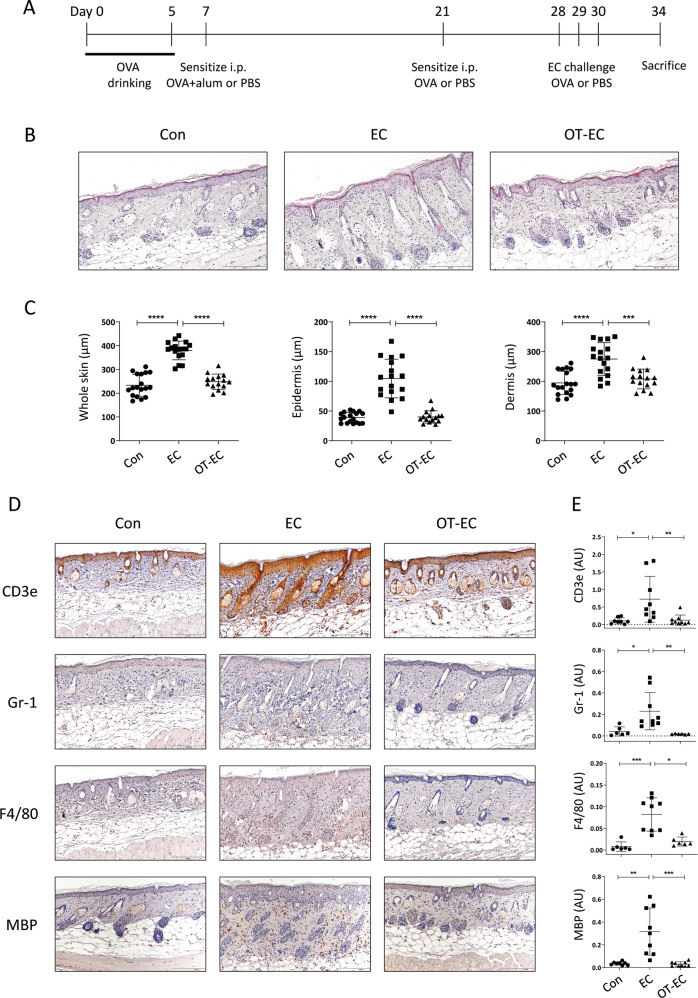
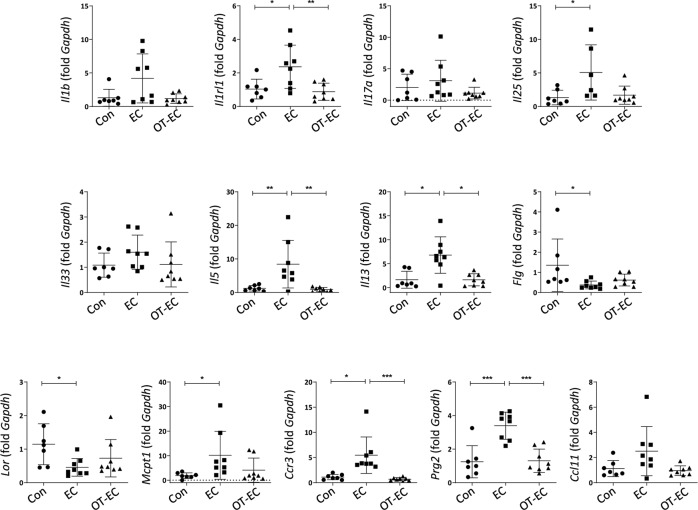
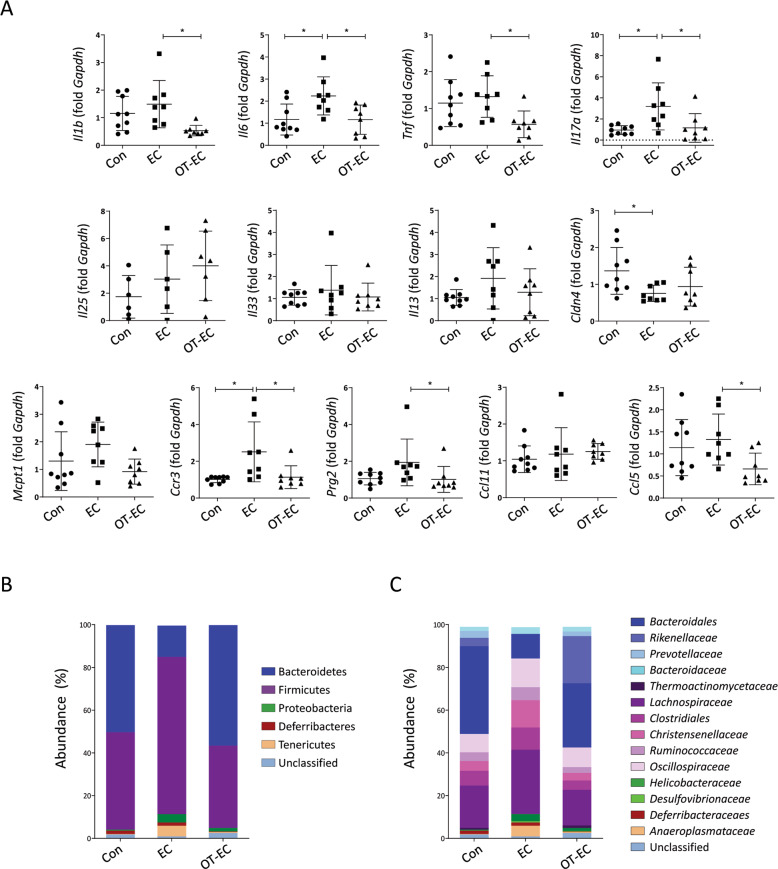
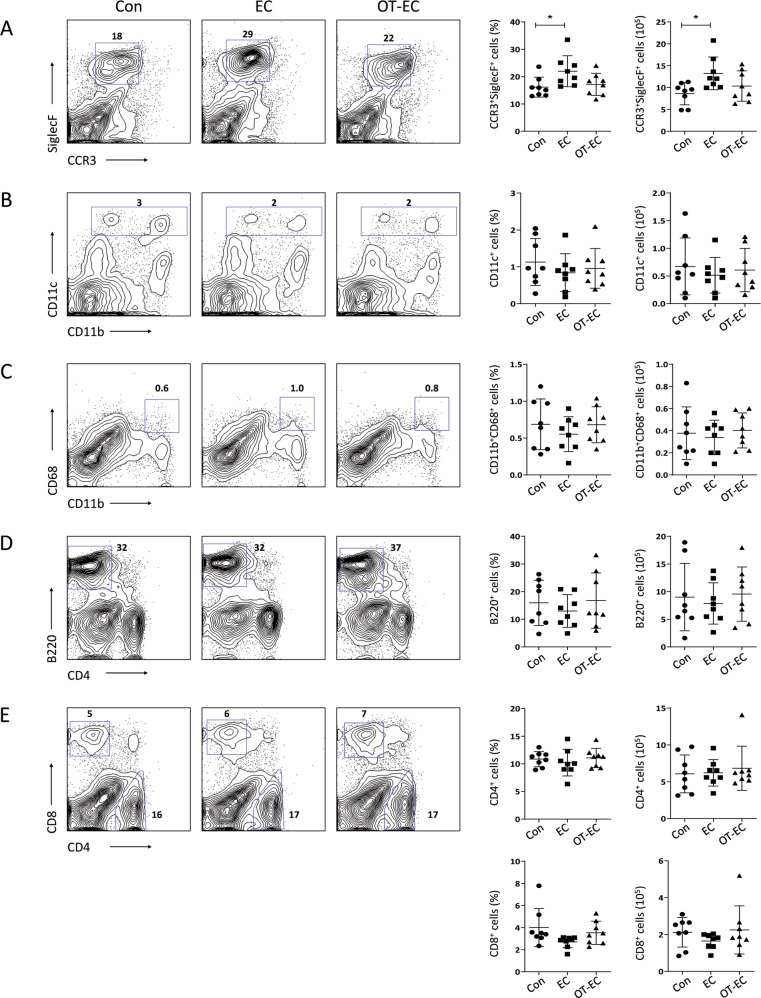
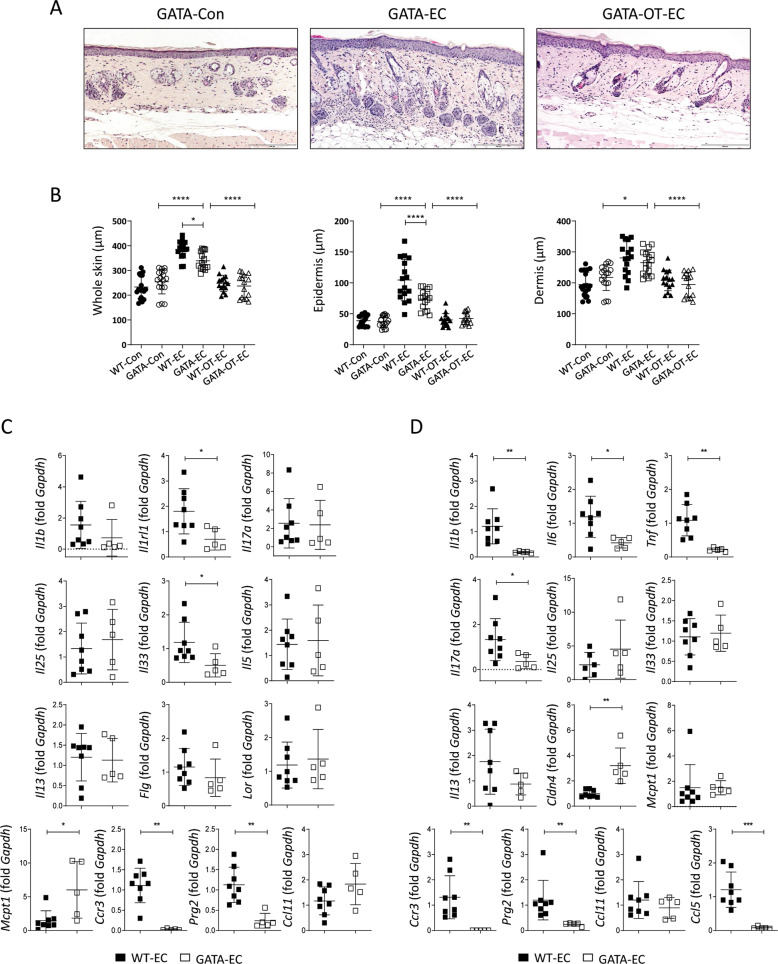
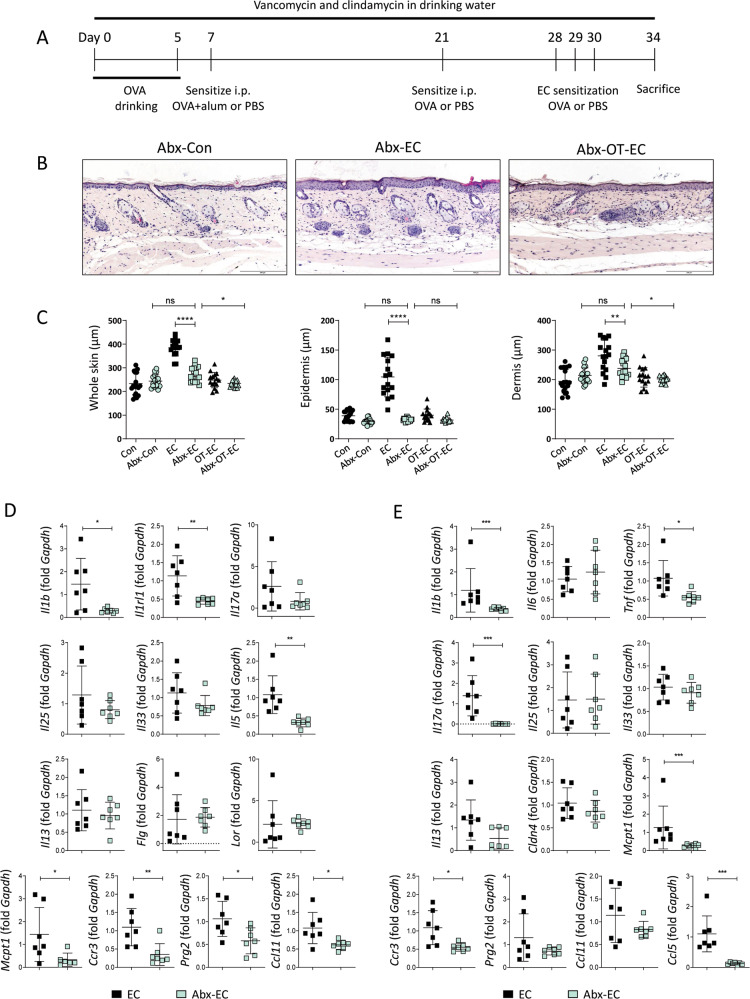
Atopic dermatitis is a chronic skin inflammatory disease mediated by Th2-type immune responses. Although intestinal immune responses have been shown to play a critical role in the development or prevention of atopic dermatitis, the precise influence of intestinal immunity on atopic dermatitis is incompletely understood. We show here that orally tolerized mice are protected from experimental atopic dermatitis induced by sensitization and epicutaneous (EC) challenge to ovalbumin. Although the expression of Th2-type cytokines in the small intestine of orally tolerized and EC-challenged mice did not change significantly, these mice showed decreased inflammatory responses in the small intestine with restoration of microbial change elicited by the EC challenge. Interestingly, an increase in small intestinal eosinophils was observed with the EC challenge, which was also inhibited by oral tolerance. The role of small intestinal eosinophils and microbiota in the pathogenesis of experimental atopic dermatitis was further substantiated by decreased inflammatory mediators in the small intestine and attenuated Th2-type inflammation in the skin of eosinophil-deficient and microbiota-ablated mice with EC challenges. Based on these data, we propose that the bidirectional interaction between the skin and the intestine has a role in the pathogenesis of atopic dermatitis and that modulation of the intestinal microenvironments could be a therapeutic approach to atopic dermatitis.


Conflict of interest statement

The authors declare no competing interests.

Figures

Fig. 1
Fig. 1. Histological inflammation and immune cell infiltration of the skin of EC-challenged mice was inhibited by oral tolerance induction.
A Experimental protocol. Mice were fed with or without 1% OVA in drinking water for 5 days prior to sensitization with two intraperitoneal injections of OVA-alum or OVA, followed by three consecutive EC challenges with OVA. The control mice were sensitized with PBS followed by EC challenge with PBS. B Hematoxylin and eosin staining of skin from the control (Con), EC-challenged (EC), and orally tolerized and EC-challenged (OT-EC) mice. The images are representative of two independent experiments. The scale bar represents 200 μm. C The thickness of the whole skin (left), epidermis (middle), and dermis (right) of the indicated mice group. The graphs show the mean ± SD values. ***P < 0.001, ****P < 0.0001 (one-way ANOVA). D and E Immunohistochemical staining D and intensity quantification E of T cells (CD3e), neutrophils (Gr-1), macrophages (F4/80), and eosinophils (MBP) in the skin of the indicated mice. Images are representative of two independent experiments. The scale bar represents 200 μm. The graphs show the mean ± SD values. *P < 0.05, **P < 0.01, ***P < 0.001 (Kruskal–Wallis test).
Fig. 2
Fig. 2. Skin expression of allergic inflammatory markers of EC-challenged mice was inhibited by oral tolerance induction.
mRNA expression of Il1b, Il1rl1, Il17a, Il25, Il33, Il5, Il13, Flg, Lor, Mcpt1, Ccr3, Prg2, and Ccl11 in the skin of the indicated mice. All data are representative of two independent experiments. The graphs show the mean ± SD values. *P < 0.05, **P < 0.01, ***P < 0.001 (one-way ANOVA for Il1rl1, Il5, Flg, and Prg2; Kruskal–Wallis test for Il25, Il13, Lor, Mcpt1, and Ccr3).
Fig. 3
Fig. 3. EC challenge and oral tolerance induction elicited immune microenvironmental changes in the small intestine.
A mRNA expression of Il1b, Il6, Tnf, Il17a, Il25, Il33, Il13, Cldn4, Mcpt1, Ccr3, Prg2, Ccl11, and Ccl5 in the small intestine of the indicated mice. All data are representative of two independent experiments. The graphs show the mean ± SD values. *P < 0.05 (one-way ANOVA for Il1b, Tnf, Il17a, and Cldn4; Kruskal–Wallis test for Il6, Ccr3, Prg2, and Ccl5). B and C shows relative abundance at the phylum B and family levels C of microbiota in the cecal contents of the indicated mice. Each column represents pooled samples from the indicated mice (n = 3 mice per group).
Fig. 4
Fig. 4. Oral tolerance inhibited the infiltration of the small intestinal eosinophils elicited by EC challenge.
AE Representative flow cytometric plots, percentage, and cell count of eosinophils A, dendritic cells B, macrophages C, B cells D, and CD4+ and CD8+ T cells E in the small intestine of the indicated mice. The plots are gated on CD45+ cells and are representative of two independent experiments. The graphs show the mean ± SD values. *P < 0.05 (one-way ANOVA).
Fig. 5
Fig. 5. Inflammatory changes in the skin and small intestine elicited by EC challenge were attenuated in eosinophil-deficient ΔdblGATA mice.
A Hematoxylin and eosin staining of skin from the control ΔdblGATA (GATA-Con), EC-challenged ΔdblGATA (GATA-EC), and orally tolerized and EC-challenged ΔdblGATA (GATA-OT-EC) mice. The images are representative of two independent experiments. The scale bar represents 200 μm. B The thickness of the whole skin (left), epidermis (middle), and dermis (right) of the indicated mice. The graphs show the mean ± SD values. *P < 0.05, ****P < 0.0001 (one-way ANOVA). C mRNA expression of Il1b, Il1rl1, Il17a, Il25, Il33, Il5, Il13, Flg, Lor, Mcpt1, Ccr3, Prg2, and Ccl11 in the skin of the indicated mice. All data are representative of two independent experiments. The graphs show the mean ± SD values. *P < 0.05, **P < 0.01 (Student’s t-test for Il1rl1 and Il33; Mann–Whitney test for Mcpt1, Ccr3, and Prg2). D mRNA expression of Il1b, Il6, Tnf, Il17a, Il25, Il33, Il13, Cldn4, Mcpt1, Ccr3, Prg2, Ccl11, and Ccl5 in the small intestine of the indicated mice. All data are representative of two independent experiments. The graphs show the mean ± SD values. *P < 0.05, **P < 0.01, ***P < 0.001 (Student’s t-test for Il1b, Il6, Tnf, Il17a, and Cldn4; Mann–Whitney test for Ccr3, Prg2, and Ccl5).
Fig. 6
Fig. 6. Inflammatory changes in the skin and small intestine elicited by EC challenge were attenuated in the antibiotic-treated mice.
A Schedule of antibiotic treatments. B Hematoxylin and eosin staining of skin from the antibiotic-treated control (Abx-Con), antibiotic-treated and EC-challenged (Abx-EC), and antibiotic-treated, orally tolerized, and EC-challenged (Abx-OT-EC) mice. The images are representative of two independent experiments. The scale bar represents 200 μm. C Whole skin thickness (left), epidermal thickness (middle), and dermal thickness (right) of the indicated mice. The graphs show the mean ± SD values. *P < 0.05, **P < 0.01, ****P < 0.0001 (one-way ANOVA). D mRNA expression of Il1b, Il1rl1, Il17a, Il25, Il33, Il5, Il13, Flg, Lor, Mcpt1, Ccr3, Prg2, and Ccl11 in the skin of the indicated mice. All data are representative of two independent experiments. The graphs show the mean ± SD values. *P < 0.05, **P < 0.01 (Student’s t-test for Il1b, I1rl1, Il5, Prg2, and Ccl11; Mann–Whitney test for Mcpt1 and Ccr3). E mRNA expression of Il1b, Il6, Tnf, Il17a, Il25, Il33, Il13, Cldn4, Mcpt1, Ccr3, Prg2, Ccl11, and Ccl5 in the small intestine of the indicated mice. All data are representative of two independent experiments. The graphs show the mean ± SD values. *P < 0.05, ***P < 0.001 (Student’s t-test for Tnf, Ccr3, and Ccl5; Mann–Whitney test for Il1b, Il17a, and Mcpt1).

Similar articles

Cited by

References

    1. Blauvelt A, Hwang ST, Udey MC. 11. Allergic and immunologic diseases of the skin. J. Allergy Clin. Immunol. 2003;111:S560–S570. doi: 10.1067/mai.2003.78. - DOI - PubMed
    1. Heratizadeh A, Wichmann K, Werfel T. Food allergy and atopic dermatitis: how are they connected? Curr. Allergy Asthma Rep. 2011;11:284–291. doi: 10.1007/s11882-011-0202-y. - DOI - PubMed
    1. Song H, Yoo Y, Hwang J, Na YC, Kim HS. Faecalibacterium prausnitzii subspecies-level dysbiosis in the human gut microbiome underlying atopic dermatitis. J. Allergy Clin. Immunol. 2016;137:852–860. doi: 10.1016/j.jaci.2015.08.021. - DOI - PubMed
    1. Bin L, Leung DY. Genetic and epigenetic studies of atopic dermatitis. Allergy Asthma Clin. Immunol. 2016;12:52. doi: 10.1186/s13223-016-0158-5. - DOI - PMC - PubMed
    1. Egawa G, Kabashima K. Multifactorial skin barrier deficiency and atopic dermatitis: Essential topics to prevent the atopic march. J. Allergy Clin. Immunol. 2016;138:350–358. doi: 10.1016/j.jaci.2016.06.002. - DOI - PubMed

MeSH terms

LinkOut - more resources