Comparative Study
. 2021 Mar 4;12(3):242.
doi: 10.1038/s41419-021-03531-z.

Inhibiting β-catenin disables nucleolar functions in triple-negative breast cancer

Affiliations
Comparative Study

Inhibiting β-catenin disables nucleolar functions in triple-negative breast cancer

Shannon E Weeks et al. Cell Death Dis. .

Abstract

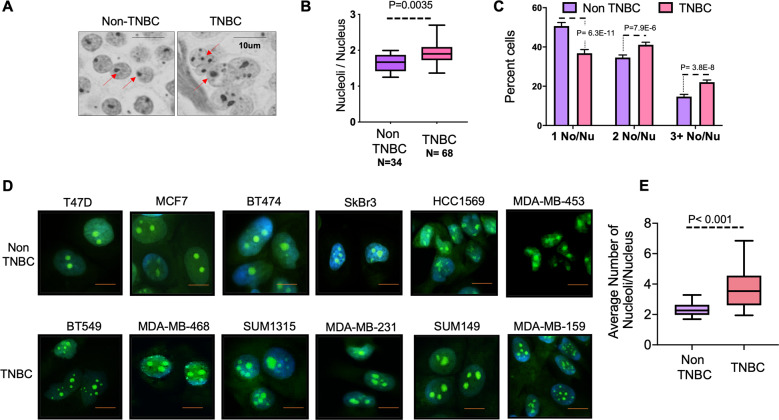
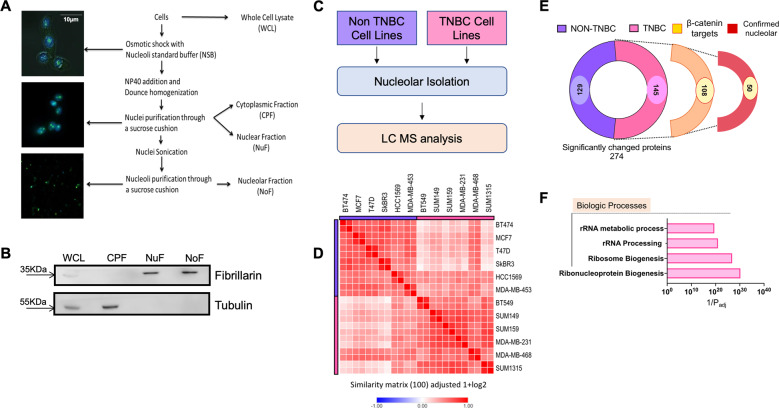
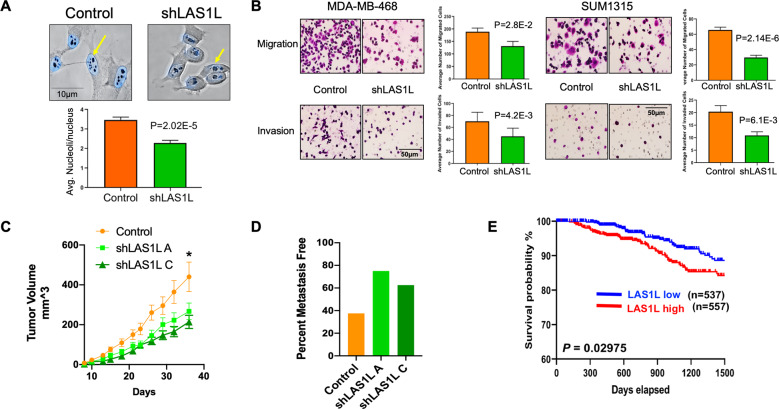
Triple-negative breast cancer (TNBC) patients with upregulated Wnt/β-catenin signaling often have poor clinical prognoses. During pathological examinations of breast cancer sections stained for β-catenin, we made the serendipitous observation that relative to non-TNBC, specimens from TNBC patients have a greater abundance of nucleoli. There was a remarkable direct relationship between nuclear β-catenin and greater numbers of nucleoli in TNBC tissues. These surprising observations spurred our investigations to decipher the differential functional relevance of the nucleolus in TNBC versus non-TNBC cells. Comparative nucleolar proteomics revealed that the majority of the nucleolar proteins in TNBC cells were potential targets of β-catenin signaling. Next, we undertook an analysis of the nucleolar proteome in TNBC cells in response to β-catenin inhibition. This effort revealed that a vital component of pre-rRNA processing, LAS1 like ribosome biogenesis factor (LAS1L) was significantly decreased in the nucleoli of β-catenin inhibited TNBC cells. Here we demonstrate that LAS1L protein expression is significantly elevated in TNBC patients, and it functionally is important for mammary tumor growth in xenograft models and enables invasive attributes. Our observations highlight a novel function for β-catenin in orchestrating nucleolar activity in TNBCs.


Conflict of interest statement

The authors declare no competing interests.

Figures

Fig. 1
Fig. 1. TNBC cells have more nucleoli than non-TNBC cells.
A Representative image of AgNOR stained human breast cancer tissue sections classified as TNBC or non-TNBC. Red arrows point at nucleoli. B Quantification of nucleolar number (using AgNOR staining) in human breast cancer tumor tissue sections classified as TNBC or Non-TNBC. Number of nucleoli per nucleus from cells in each specimen were counted. The data is represented as a box and whiskers plot. C Cells from each human breast cancer tumor tissue section, classified as TNBC or non-TNBC were separated into groups of cells with one nucleolus/nucleus, two nucleoli/nucleus, and three or more nucleoli/nucleus. These groups were represented as percent cells in each group. D Representative images of NucleolarIDTM stained cells from TNBC or Non-TNBC cell lines. Focused bright green staining demarcates nucleoli. DAPI staining (blue) marks the nucleus. E Quantification of nucleolar number (using NucleolarIDTM staining) in human breast cancer cell lines. The number of nucleoli per nucleus from six TNBC and six non-TNBC cell lines was counted. The data is represented as a box and whiskers plot and was significantly decreased in the non-TNBC cell lines (P < 0.001). Significance was determined using a T-test and all error bars indicate SEM.
Fig. 2
Fig. 2. Identification of differences in nucleolar proteomes of TNBC and non-TNBC cells.
A Graphical representation of the steps involved in isolating nucleoli from breast cancer cells. B Representative immunoblot showing verification of enrichment of nucleolar proteins. Fibrillarin is used as an indicator of nucleolar proteins. The absence of tubulin from the nuclear and nucleolar fractions was monitored to ensure purity. C Schematic summarizing workflow for nucleolar isolation and proteomic analysis to identify significantly altered proteins in the nucleolus between TNBC and non-TNBC cell lines. D Similarity matrix comparing nucleolar proteomes of TNBC cell lines with that of Non-TNBC cell lines. The proteomes were determined from two biological replicates. The matrix shows proteomes from both replicates of each cell line. E Graphical break-down of significantly altered proteins found in the nucleolar proteomics of the TNBC groups. Out of 145 proteins enriched in TNBC nucleoli, 108 were potential transcriptional targets of β-catenin. Out of these, 50 proteins were already reported to be nucleolar in one or more previously reported nucleolar proteomes from studies conducted in other (not breast cancer) cell types,,. F Gene ontology analysis of proteins enriched in the nucleolar proteome of TNBC compared to Non-TNBC for biologic processes. The analysis was performed using g:Profiler™.
Fig. 3
Fig. 3. Active β-catenin signaling in TNBC contributes to the increase in nucleolar number.
A Patient-derived breast cancer specimen was stained for β-catenin illustrating a reduction in nuclear to the membranous ratio of β-catenin indicating a reduction in active β-catenin signaling in non-TNBC patient tumor samples compared to TNBC patient tumor samples. Representative pictures of immunohistochemical staining for β-catenin in TNBC and non-TNBC specimens. Yellow arrows indicate intense staining locations for β-catenin. The staining was scored for nuclear β-catenin staining as well as membranous β-catenin staining. The ratio of nuclear vs. membranous β-catenin is depicted in the box and whiskers plot. Each dot indicates the ratios corresponding to each patient specimen. Statistical analysis was performed with a T-test and error bars indicate SEM. B A comparison of the ratio of nuclear vs. membranous β-catenin staining against the nucleolar number of each patient-derived specimen indicates the correlation between active Wnt signaling, nucleolar number, and breast cancer subtype. The tables below the plot summarize the details of specimens and statics. C TNBC cell lines were treated with β-catenin inhibitor iCRT14 at 5 µM for 48 h result in a significant reduction in the number of nucleoli per nucleus in TNBC cell lines. Representative photomicrographs of NucleolarIDTM stained cells are presented. The accompanying box plots present the average nucleoli/nucleus number for each cell line for the control and iCRT treated groups. Statistical analysis was performed using a T-test and error bars indicate SEM. D Graphical representation of Wnt signaling activity in HC11 cells throughout the process of differentiation. DIP = dexamethasone, insulin, prolactin cocktail for inducing differentiation. Total protein was isolated at 24, 48, and 72 h. Immunoblots for β-casein were used to verify the differentiation of HC11 cells. Immunoblots for active β-catenin (Phospho-Ser 552 is) and total β-catenin were performed to determine active β-catenin signaling. E Undifferentiated HC11 cells display higher numbers of nucleoli compared to differentiated HC11 cells based on AgNOR staining. Statistical significance was determined using a T-test and error bars represent SEM. F Treatment of HC11 cells with iCRT14 at 5 µM for 48 h resulted in a significant reduction in nucleolar number based on AgNOR staining. Statistical significance was determined using a T-test and error bars represent SEM.
Fig. 4
Fig. 4. Nucleolar protein LAS1L is a target of β-catenin signaling.
A Schematics of workflow for TNBC cells treated with 5 µM iCRT14 for 48 h for nucleolar isolation and proteomic analysis. B Nucleolar proteome of TNBC cells (SUM1315 and MDA-MB-468) was compared with and without iCRT14 treatment. Volcanoplot reveals 19 proteins (listed) significantly reduced in nucleoli of TNBC cells after iCRT14 treatment. Special attention is drawn to LAS1L, the only protein found to be significantly altered in both TNBC vs. non-TNBC proteomics as well as the iCRT14 nucleolar proteomics. C Immunofluorescent staining of LAS1L and Fibrillarin verifying the presence of LAS1L is a nucleolar protein in TNBC cells. D Immunohistochemical staining of TNBC vs. non-TNBC tumor samples for LAS1L verifies a significant increase in LAS1L staining in the TNBC tumor samples compared to Non-TNBC tumor samples. Statistical significance was determined by T-test and error bars to represent SEM. E Diagrammatic representation of the predicted TCF consensus sequence in the promoter region of the LAS1L gene. Is a tandem overlap of two TCR/LEF sites. CCTTTGAAC is the most preferred TCF/LEF binding cite. Most conserved bases are indicated with red color. Bases less conserved are indicated with blue and yellow colors. ChIP-qPCR analysis of β-catenin bound to the TCF consensus sequence in the promoter of the LAS1L gene. Statistical significance was determined by T-test and error bars to represent SEM.
Fig. 5
Fig. 5. Knockdown of LAS1L leads to a reduction in tumorigenic and metastatic properties in TNBC.
A Stable knockdown of LAS1L using short hairpin RNA results in a significant reduction in nucleolar number. Statistical significance was determined by T-test and error bars to represent SEM. B Knockdown of LAS1L in TNBC cells results in a significant reduction in the invasive and migratory capability of cells. Statistical significance was determined by T-test and error bars to represent SEM. C Growth of orthotopic xenografts of SUM1315 cells is significantly reduced following stable knockdown of LAS1L. Statistical significance was determined by two-way ANOVA followed by Dunnett’s post hoc test for tumor growth at respective time points and error bars represent SEM. *Represents significant statistical difference was reached for comparison of the control group compared to shLAS1 A as well as shLAS1L C growth curves for all days from day 18. D Lungs of mice with orthotopic xenografts of SUM1315 were examined for overt metastases. The incidence of metastasis was notably low for LAS1L knockout xenografts. E For survival analysis, the patient’s LAS1-L RNA expression data, measured by RNAseq—IlluminaHiSeq for 1101 breast cancer primary tumors (cohort: TCGA Breast Cancer BRCA) was accessed from a public data portal (https://xenabrowser.net) Sep. 2020. Data were extracted for analysis. Normalized RNA-seq data was used as LAS1-L gene expression values, and the median was used to classify samples into high and low expression groups for overall survival analysis. A Kaplan–Meier curve was generated, and a log-rank test applied.

Similar articles

Cited by

References

    1. Pederson T. The nucleolus. Cold Spring Harb. Perspect. Biol. 2011;3:3. - PMC - PubMed
    1. Nemeth A, Langst G. Genome organization in and around the nucleolus. Trends Genet. 2011;27:149–156. doi: 10.1016/j.tig.2011.01.002. - DOI - PubMed
    1. Baserga SJ, DiMario PJ. Emerging roles for the nucleolus 2017. Mol. Biol. Cell. 2018;29:773–775. doi: 10.1091/mbc.E17-12-0730. - DOI - PMC - PubMed
    1. Weeks SE, Metge BJ, Samant RS. The nucleolus: a central response hub for the stressors that drive cancer progression. Cell Mol. Life Sci. 2019;76:4511–4524. doi: 10.1007/s00018-019-03231-0. - DOI - PMC - PubMed
    1. Iarovaia OV, et al. Nucleolus: a central hub for nuclear functions. Trends Cell Biol. 2019;29:647–659. doi: 10.1016/j.tcb.2019.04.003. - DOI - PubMed

Publication types

MeSH terms