. 2021 Mar 4;12(1):1438.
doi: 10.1038/s41467-021-21644-z.

Epidermal growth factor receptor signaling uncouples germ cells from the somatic follicular compartment at ovulation

Affiliations

Epidermal growth factor receptor signaling uncouples germ cells from the somatic follicular compartment at ovulation

Laleh Abbassi et al. Nat Commun. .

Abstract

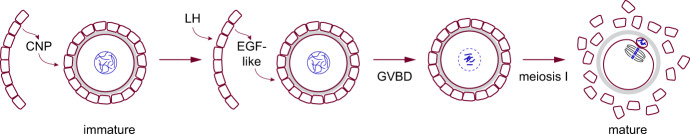
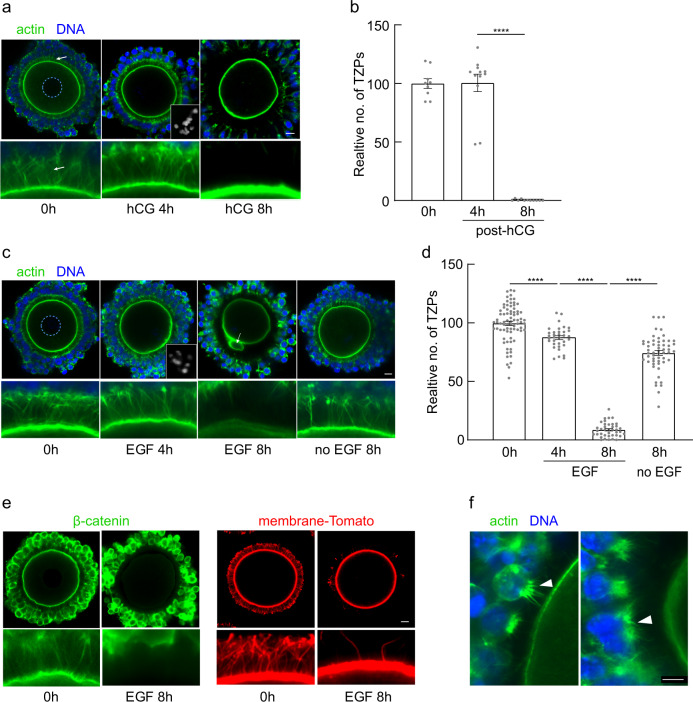
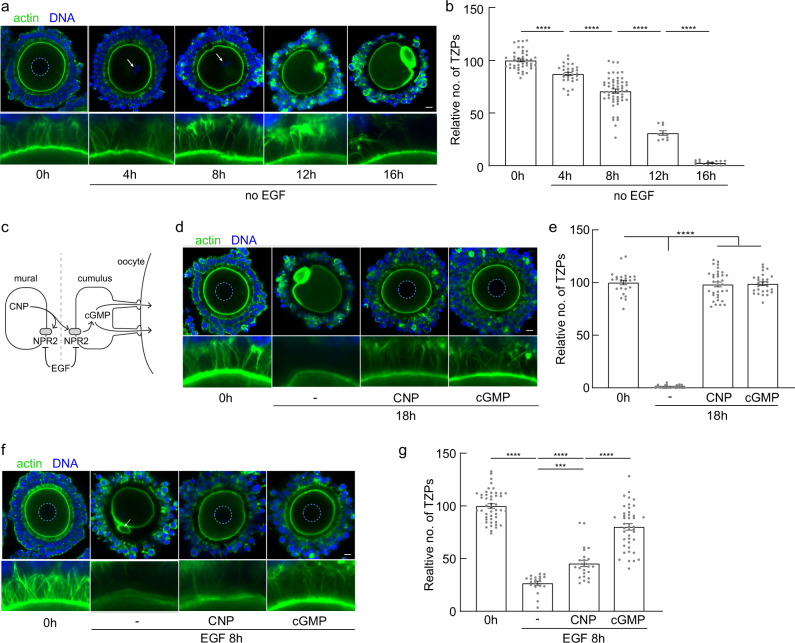
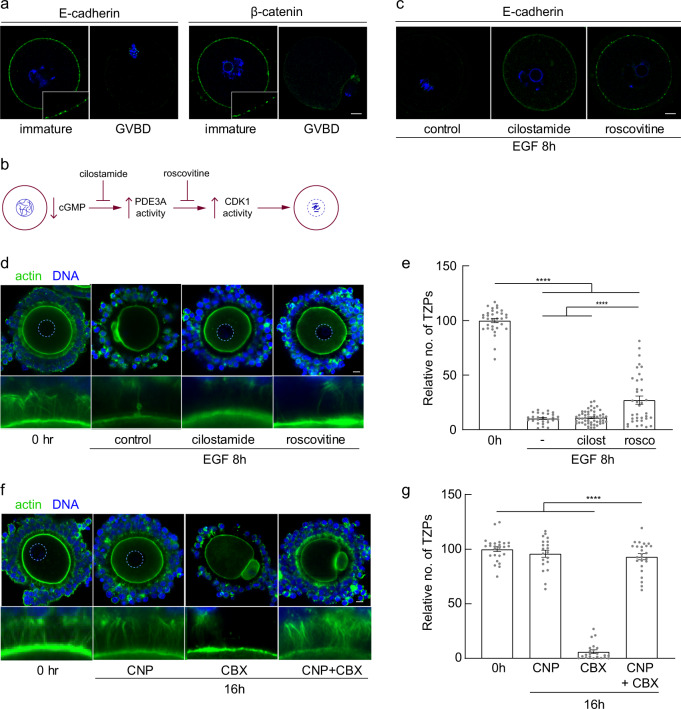
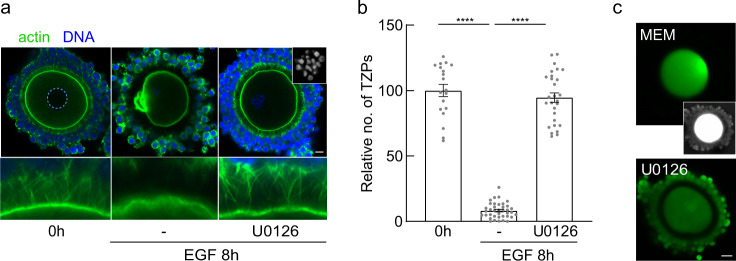
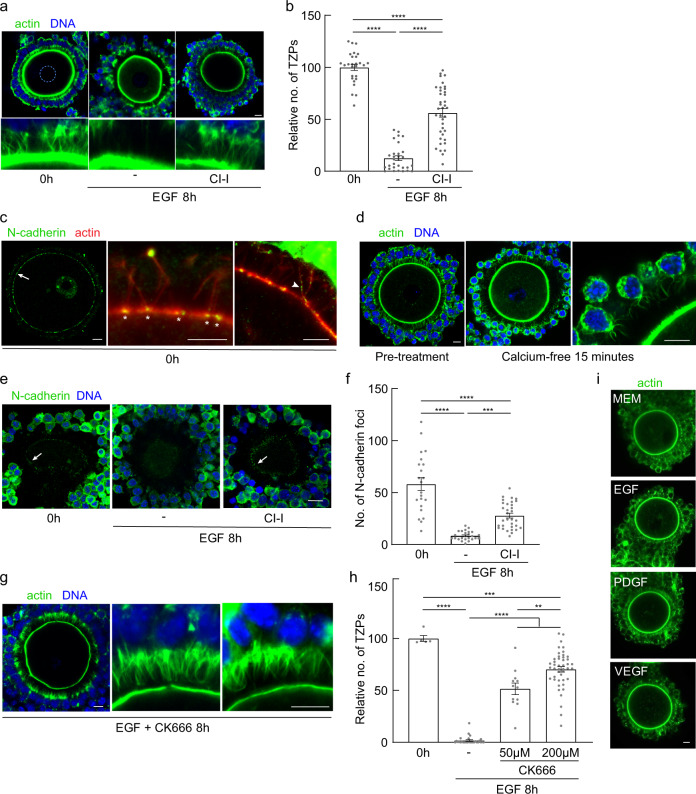
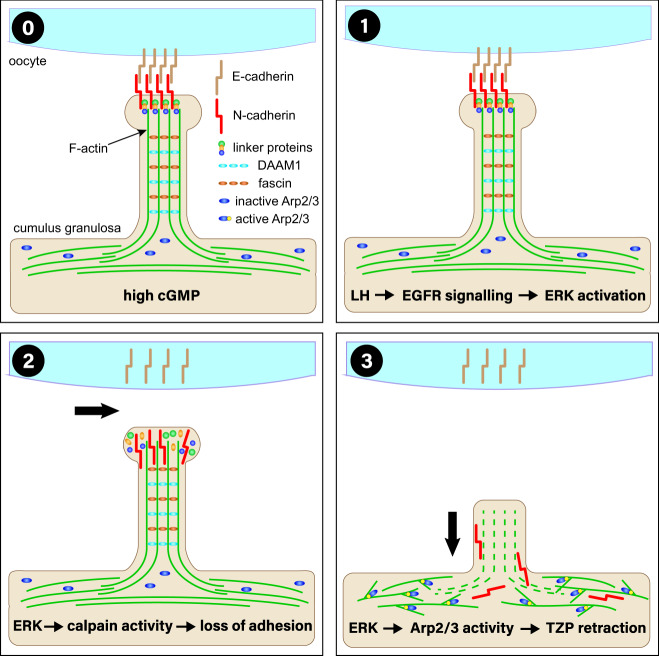
Germ cells are physically coupled to somatic support cells of the gonad during differentiation, but this coupling must be disrupted when they are mature, freeing them to participate in fertilization. In mammalian females, coupling occurs via specialized filopodia that project from the ovarian follicular granulosa cells to the oocyte. Here, we show that signaling through the epidermal growth factor receptor (EGFR) in the granulosa, which becomes activated at ovulation, uncouples the germ and somatic cells by triggering a massive and temporally synchronized retraction of the filopodia. Although EGFR signaling triggers meiotic maturation of the oocyte, filopodial retraction is independent of the germ cell state, being regulated solely within the somatic compartment, where it requires ERK-dependent calpain-mediated loss of filopodia-oocyte adhesion followed by Arp2/3-mediated filopodial shortening. By uncovering the mechanism regulating germ-soma uncoupling at ovulation, our results open a path to improving oocyte quality in human and animal reproduction.


Conflict of interest statement

The authors declare no competing interests.

Figures

Fig. 1
Fig. 1. Schematic of maturation.
The oocyte is surrounded by cumulus granulosa cells (one layer only shown for simplicity). Prior to maturation, C-type natriuretic peptide (CNP) produced by the mural granulosa cells of antral follicles maintains the immature state. At ovulation, LH binds to receptors on mural granulosa cells, triggering release of EGF-like peptides. These bind to EGFR on both the mural and the cumulus granulosa. LH and EGFR activity cooperatively trigger maturation, marked by germinal vesicle breakdown (GVBD), completion of the first meiotic division and alignment of the oocyte chromosomes on the metaphase II spindle. During maturation, the cumulus granulosa cells become displaced away from the oocyte.
Fig. 2
Fig. 2. EGF triggers retraction of TZPs.
a Confocal images of cumulus-oocyte complexes (COCs) during maturation in vivo. TZPs (arrows) are stained using the F-actin binding peptide, phalloidin. Lower panels show enlarged portion of corresponding upper panels. 0 h: Prior to maturation. Dashed circle outlines the oocyte nucleus (germinal vesicle). 4 h: 4 h after injection of hCG, an LH analogue. Inset shows condensed oocyte chromosomes, confirming that GVBD has occurred. 8 h: 8 h post-hCG. b Mean and SEM of number of TZPs at the indicated times after hCG injection, normalized to the number at 0 h. Each point represents an individual COC. n = 9 (0 h), 12 (4 h), 11 (8 h) COCs examined over three independent experiments. Statistical analysis using one-way ANOVA with Tukey multiple-comparison test. **** P < 0.0001. c Confocal images of COCs obtained from antral follicles of eCG-primed mice and incubated for the indicated periods of time in the presence of EGF or in its absence. Inset in EGF 4 h panel shows condensed chromosomes, confirming GVBD. Arrow in EGF 8 h panel shows a polar body, confirming completion of the 1st meiotic division. d Mean and SEM of number of TZPs at the indicated times after addition of EGF, normalized to the number at 0 h. Each point represents an individual COC. n = 77 (0 h), 34 (4 h EGF), 39 (8 h EGF) 55 (8 h no EGF) COCs examined over five independent experiments. Statistical analysis using one-way ANOVA with Tukey multiple-comparison test. **** P < 0.0001. e Confocal images of COCs of wild-type mice stained at the indicated times using anti-β-catenin or mTmG mice stained using anti-RFP to detect the cell membrane. Cumulus cells were removed prior to staining using anti-RFP to enable the signal in the TZPs to be detected. f Retracting TZPs cluster to form a bouquet of actin (arrowheads) at the oocyte-facing side of the granulosa cells. Scale bar = 10 µm (a, c, e); 5 µm (f).
Fig. 3
Fig. 3. Cyclic GMP maintains TZPs.
a Confocal images of COCs obtained from antral follicles of eCG-primed mice and incubated under the indicated conditions. Arrows indicate condensed chromosomes, confirming that GVBD has occurred. b Mean and SEM of number of TZPs following incubation under the indicated conditions, normalized to the number at 0 h. Each point represents an individual COC. n = 42 (0 h), 30 (4 h), 54 (8 h), 10 (12 h), 16 (16 h) COCs examined over four independent experiments. Statistical analysis using one-way ANOVA with Tukey multiple-comparison test. **** P < 0.0001. c Schematic showing CNP released by mural granulosa cells activates NPR2 receptor, which produces cGMP, on mural and cumulus granulosa cells. Gap junctions at the TZP tips permit cGMP to be transferred to the oocyte. Gap junctions also connect the mural and cumulus cells. EGF inhibits the activity of NPR2. The dotted line illustrates that COCs removed from antral follicles are deprived of CNP. d Confocal images of COCs obtained from antral follicles of eCG-primed mice and incubated under the indicated conditions. Dashed circles outline the nucleus of immature oocytes. e Mean and SEM of number of TZPs following incubation under the indicated conditions, normalized to the number at 0 h. Each point represents an individual COC. n = 25 (0 h), 31 (18 h), 34 (18 h CNP), 28 (18 h cGMP) COCs examined over three independent experiments. Statistical analysis using one-way ANOVA with Tukey multiple-comparison test. **** P < 0.0001. f Confocal images of COCs obtained from antral follicles of eCG-primed mice and incubated under the indicated conditions. Dashed circles outline the nucleus of immature oocytes; arrow indicates polar body of mature oocyte. g Mean and SEM of number of TZPs following incubation under the indicated conditions, normalized to the number at 0 h. Each point represents an individual COC. n = 47 (0 h), 20 (8 h EGF), 25 (8 h EGF CNP), 43 (8 h EGF cGMP) COCs examined over four independent experiments. Statistical analysis using one-way ANOVA with Tukey multiple-comparison test. **** P < 0.0001. *** P = 0.009. Scale bar (a, d, f) = 10 µm.
Fig. 4
Fig. 4. TZP retraction occurs independently of oocyte maturation.
a Confocal images of oocytes obtained at the indicated stages and stained using antibodies against E-cadherin or β-catenin. Both stain small foci at the cortex of immature oocytes, but not after GVBD (note oocyte on the right has emitted a polar body). b Schematic showing regulation of oocyte maturation. A decrease in cGMP within the oocyte releases PDE3A from inhibition, which by hydrolyzing cAMP enables CDK1 activity to increase, triggering maturation. Cilostamide and roscovitine inhibit the indicated steps in the pathway. c Immature oocytes were incubated in the presence of EGF and the indicated inhibitors. E-cadherin foci remain at the cortex. d Confocal images of COCs obtained from antral follicles of eCG-primed mice and incubated for 8 h in the presence of 10 ng/ml EGF and the indicated inhibitors. Dashed circle outlines oocyte nucleus. e Mean and SEM of number of TZPs following incubation under the indicated conditions, normalized to the number at 0 h. Each point represents an individual COC. n = 33 (0 h), 27 (8 h EGF), 52 (8 h EGF cilostamide), 36 (8 h EGF roscovitine) COCs examined over four independent experiments. Statistical analysis using one-way ANOVA with Tukey multiple-comparison test. **** P < 0.0001. f Confocal images of COCs obtained from antral follicles of eCG-primed mice and incubated for 16 h in the presence of the indicated inhibitors. Dashed circle outlines oocyte nucleus. TZPs remain even when the oocyte has undergone maturation (CNP + CBX). g Mean and SEM of number of TZPs following incubation under the indicated conditions, normalized to the number at 0 h. Each point represents an individual COC. n = 25 (0 h), 20 (16 h CNP), 22 (16 h CBX), 25 (16 h CNP CBX) COCs examined over three independent experiments. Statistical analysis using one-way ANOVA with Tukey multiple-comparison test. **** P < 0.0001. Scale bar (a, b, d, f) = 10 µm.
Fig. 5
Fig. 5. TZP retraction requires ERK activity.
a Confocal images of COCs obtained from antral follicles of eCG-primed mice and incubated under the indicated conditions. Dashed circle outlines oocyte nucleus. Inset in the U0126 image shows condensed chromosomes, confirming that GVBD has occurred. b Mean and SEM of number of TZPs following incubation under the indicated conditions, normalized to the number at 0 h. Each point represents an individual COC. n = 19 (0 h), 38 (8 h EGF), 28 (8 h EGF U0126) COCs examined over three independent experiments. Statistical analysis using one-way ANOVA with Tukey multiple-comparison test. **** P < 0.0001. c Following an 8 h exposure of COCs to EGF+/− U0126, Lucifer Yellow was injected into the oocyte and fluorescence was visualized 30 min later. Inset is an over-exposure to confirm that cumulus cells are present in the control group. Scale bar = 10 µm (a); 20 µm (c).
Fig. 6
Fig. 6. TZP retraction requires activity of calpain and Arp2/3.
a Confocal images of COCs from antral follicles of eCG-primed mice, incubated under the indicated conditions. Dashed circle outlines oocyte nucleus. b Mean and SEM of number of TZPs following incubation under the indicated conditions, normalized to the number at 0 h. Each point represents an individual COC. n = 27 (0 h), 30 (8 h EGF), 38 (8 h EGF CI-I) COCs examined over four independent experiments. Statistical analysis using one-way ANOVA with Tukey multiple-comparison test. ****P < 0.0001. c Confocal image of COC stained using anti-N-cadherin (green) and phalloidin (red). Arrow shows green foci associated with oocyte surface. Granulosa-cell bodies removed for clarity. High-magnification images show green foci at TZP-oocyte interface (asterisks) and on the TZP axis (arrowhead). d Confocal images of COCs before and after exposure to Ca-free medium. e Confocal images of COCs from antral follicles of eCG-primed mice, incubated under the indicated conditions and stained using anti-N-cadherin. Images recorded at a plane above the equator to enable N-cadherin foci to be detected. f Mean and SEM of number of cadherin foci following incubation under the indicated conditions. Each point represents an individual COC. n = 22 (0 h), 25 (8 h EGF), 32 (8 h EGF CI-I) COCs examined over three independent experiments. Statistical analysis using one-way ANOVA with Tukey multiple-comparison test. ****P < 0.0001 ***P = 0.002. g Confocal images of COCs from antral follicles of eCG-primed mice, incubated under the indicated conditions. First and second panels are the same COC; third panel is a different COC. h Mean and SEM of number of TZPs following incubation under the indicated conditions, normalized to the number at 0 h. Each point represents an individual COC. n = 5 (0 h), 28 (8 h EGF), 12 (8 h EGF 50 μM CK666), 45 (8 h EGF 200 μM CK666) COCs examined over three independent experiments. Statistical analysis using one-way ANOVA with Tukey multiple-comparison test. ****P < 0.0001 ***P = 0.0003 **P = 0.0011. i Confocal images of GOCs incubated for 1 h in the indicated growth factors. Scale bar = 10 µm.
Fig. 7
Fig. 7. Model of TZP retraction.
In antral follicles (stage 0), TZPs projecting from the cumulus granulosa cells to the oocyte contain a backbone of linear F-actin together with the formin, DAAM1, and fascin. N-cadherin (cumulus granulosa) and E-cadherin (oocyte) mediate adhesion between the two cell types. cGMP in the granulosa cells may maintain the TZPs. At the time of ovulation (stage 1), binding of LH to its receptor in the mural granulosa cells triggers release of EGFR ligands, which in turn activates ERK MAP kinase. Active ERK activates calpain (stage 2), which degrades proteins required to maintain N-cadherin at the cumulus granulosa cell membrane, thereby permanently breaking germ-soma contact. Increased activity of the branched chain actin nucleator complex, Arp2/3, which may also be regulated by ERK MAP kinase, reorganizes the actin cytoskeleton (stage 3) leading to a retraction of the TZPs into the granulosa cell body.

Similar articles

Cited by

References

    1. Gumbiner BM. Cell adhesion: the molecular basis of tissue architecture and morphogenesis. Cell. 1996;84:345–357. doi: 10.1016/S0092-8674(00)81279-9. - DOI - PubMed
    1. Paolillo M., Schinelli S. Extracellular matrix alterations in metastatic processes. Int. J. Mol. Sci.20, 4947 (2019). - PMC - PubMed
    1. Gungor-Ordueri NE, Tang EI, Celik-Ozenci C, Cheng CY. Ezrin is an actin binding protein that regulates Sertoli cell and spermatid adhesion during spermatogenesis. Endocrinology. 2014;155:3981–3995. doi: 10.1210/en.2014-1163. - DOI - PMC - PubMed
    1. Sakamoto S, et al. mDia1/3 generate cortical F-actin meshwork in Sertoli cells that is continuous with contractile F-actin bundles and indispensable for spermatogenesis and male fertility. PLoS Biol. 2018;16:e2004874. doi: 10.1371/journal.pbio.2004874. - DOI - PMC - PubMed
    1. Hannigan MM, Zagore LL, Licatalosi DD. Ptbp2 controls an alternative splicing network required for cell communication during spermatogenesis. Cell Rep. 2017;19:2598–2612. doi: 10.1016/j.celrep.2017.05.089. - DOI - PMC - PubMed

Publication types

Grants and funding