. 2021 Mar 4;12(1):1439.
doi: 10.1038/s41467-021-21572-y.

Virus-specific memory T cell responses unmasked by immune checkpoint blockade cause hepatitis

Affiliations

Virus-specific memory T cell responses unmasked by immune checkpoint blockade cause hepatitis

James A Hutchinson et al. Nat Commun. .

Abstract

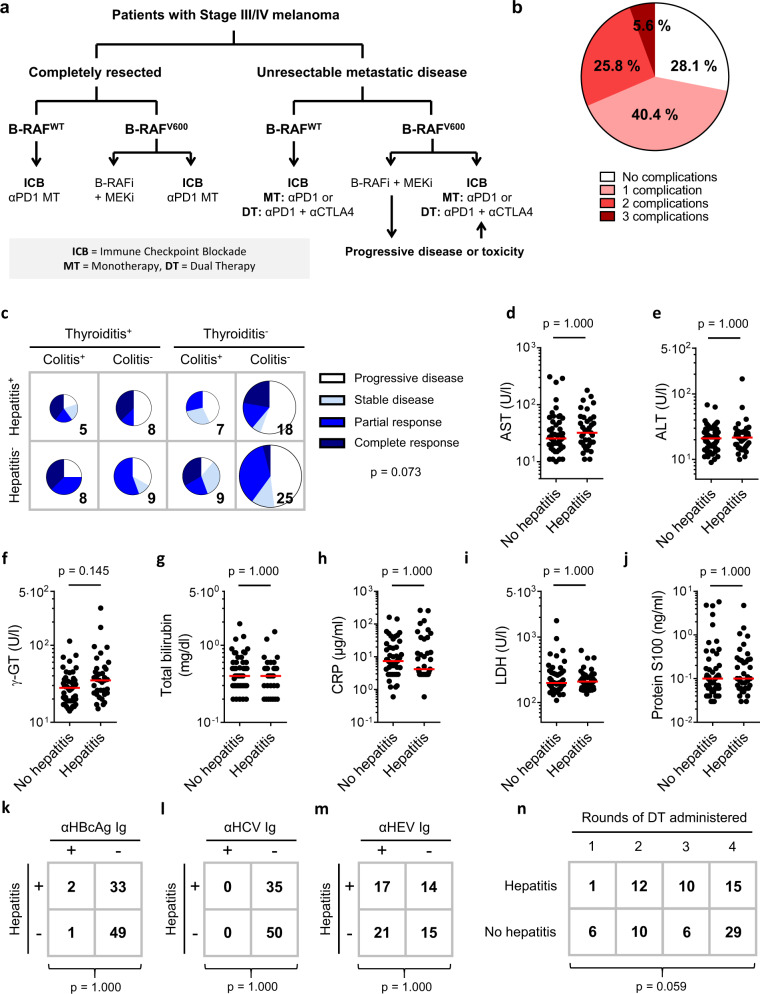
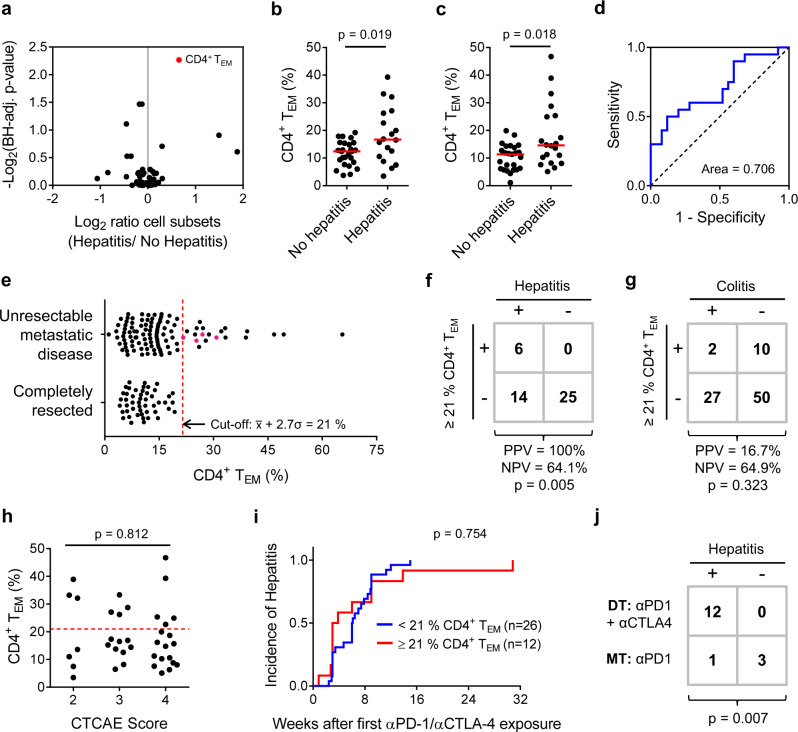
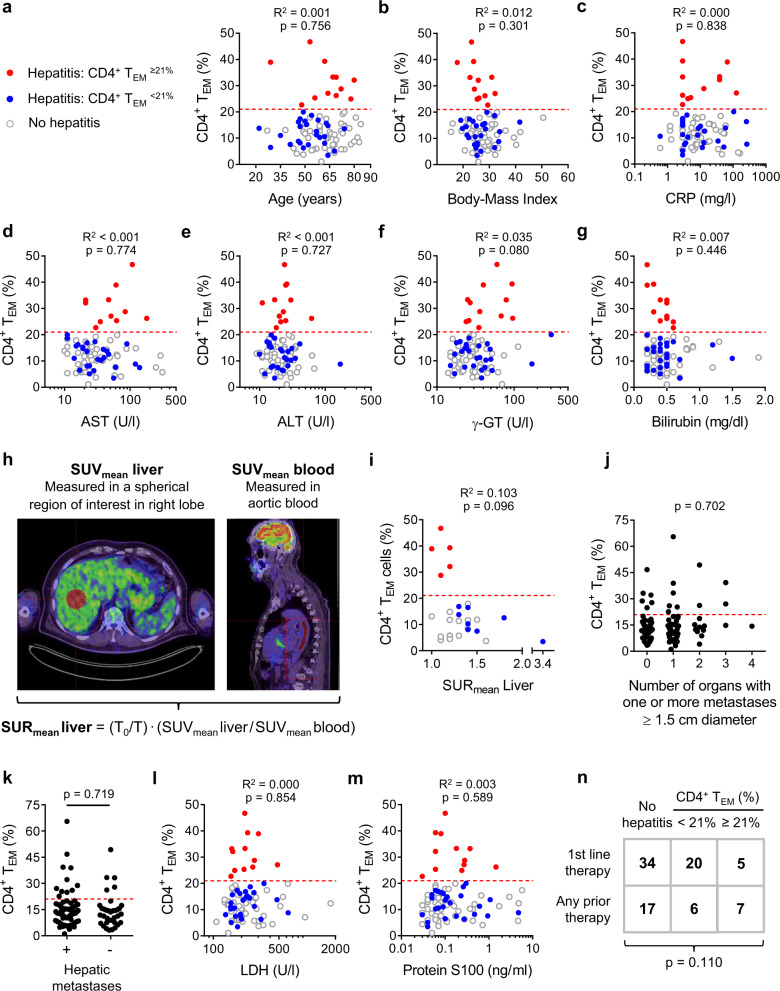
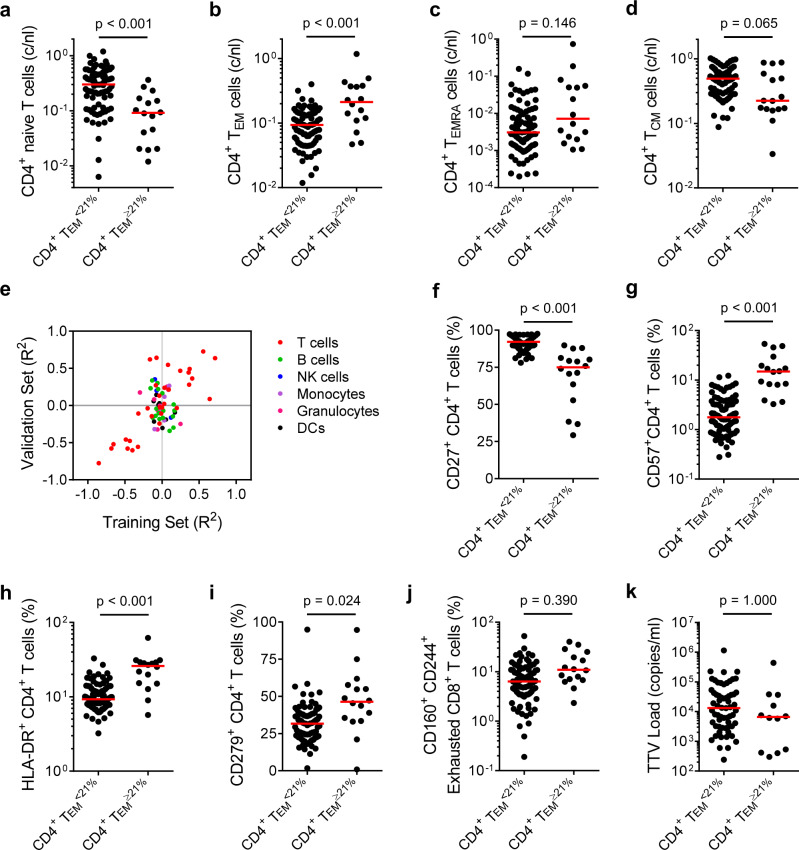
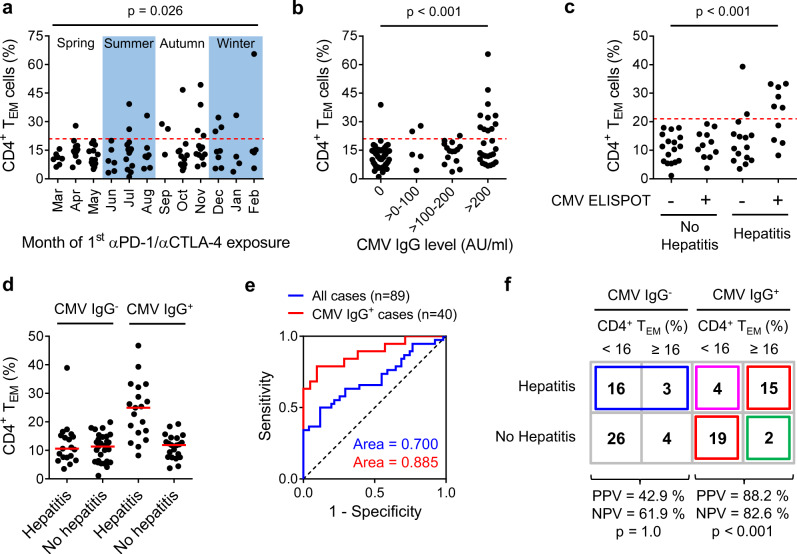
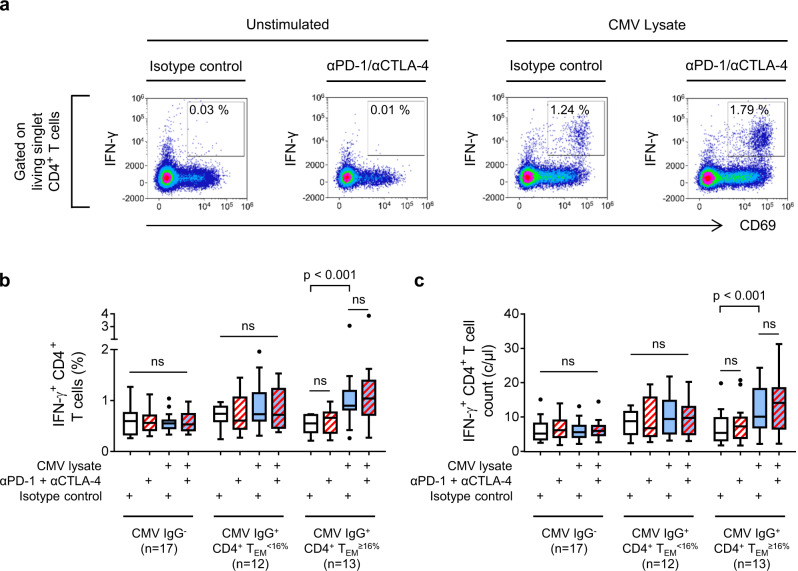
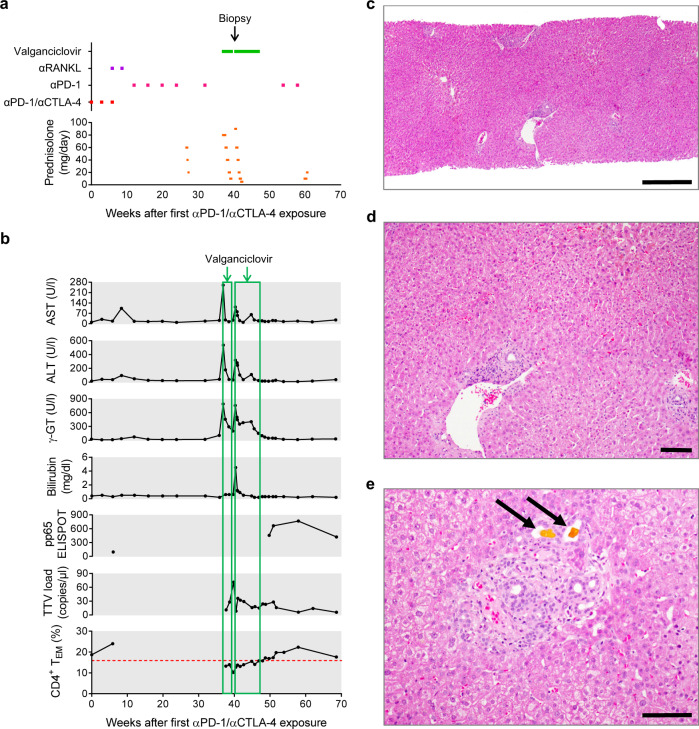
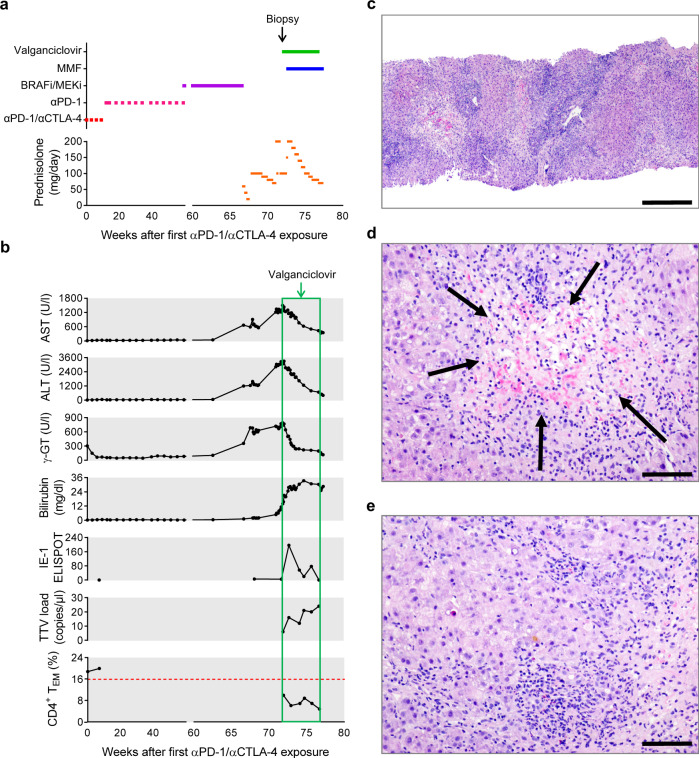
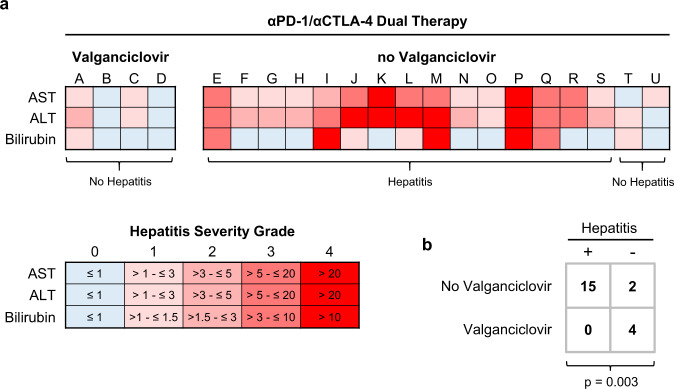
Treatment of advanced melanoma with combined PD-1/CTLA-4 blockade commonly causes serious immune-mediated complications. Here, we identify a subset of patients predisposed to immune checkpoint blockade-related hepatitis who are distinguished by chronic expansion of effector memory CD4+ T cells (TEM cells). Pre-therapy CD4+ TEM cell expansion occurs primarily during autumn or winter in patients with metastatic disease and high cytomegalovirus (CMV)-specific serum antibody titres. These clinical features implicate metastasis-dependent, compartmentalised CMV reactivation as the cause of CD4+ TEM expansion. Pre-therapy CD4+ TEM expansion predicts hepatitis in CMV-seropositive patients, opening possibilities for avoidance or prevention. 3 of 4 patients with pre-treatment CD4+ TEM expansion who received αPD-1 monotherapy instead of αPD-1/αCTLA-4 therapy remained hepatitis-free. 4 of 4 patients with baseline CD4+ TEM expansion given prophylactic valganciclovir and αPD-1/αCTLA-4 therapy remained hepatitis-free. Our findings exemplify how pathogen exposure can shape clinical reactions after cancer therapy and how this insight leads to therapeutic innovations.


Conflict of interest statement

S.H. declares he has received consulting fees and speaker’s honoraria from BMS and Merck Sharp & Dohme (MSD). All other authors declare no competing interests.

Figures

Fig. 1
Fig. 1. Individual predisposition to hepatitis after αPD-1/αCTLA-4 treatment.
a Individualised treatment of melanoma is guided by tumour staging, presence of B-RAF mutations and fitness-for-toxicity. b Colitis, hepatitis and thyroiditis are common immune-related complications of dual therapy with Nivolumab plus Ipilimumab; 31.4% of patients experienced two or more of these immune-related adverse reactions (n = 89). c Colitis, hepatitis and thyroiditis occurred independently and were not significantly associated with clinical response (n = 89; F.E). dh Patients who developed hepatitis of any grade following dual therapy lacked biochemical signs of liver inflammation before treatment. In particular, no clinically meaningful differences in plasma levels of d aspartate transaminase (AST; n = 87; M.W.; Bonferroni-corrected p-value, m = 5), e alanine transaminase (ALT; n = 89; M.W.; Bonferroni-corrected p-value, m = 5), f gamma glutamyl transaminase (γ-GT; n = 89; M.W.; Bonferroni-corrected p-value, m = 5), g total bilirubin (n = 87; M.W.; Bonferroni-corrected p-value, m = 5), or h C-reactive protein (CRP; n = 85; M.W.; Bonferroni-corrected p-value, m = 5) were observed between patients who developed hepatitis and those who did not. Median values are indicated by a red line. i, j Biochemical markers of tumour burden were not different between patients who developed hepatitis and those who did not. i Pre-treatment levels of lactate dehydrogenase (n = 89; M.W.; Bonferroni-corrected p-value, m = 4). Median values are indicated by a red line. j Pre-treatment levels of protein S100 (n = 89; M.W.; Bonferroni-corrected p-value, m = 4). km No association was observed between seropositivity for k hepatitis B virus core antigen (HBcAg; n = 85; F.E.; Bonferroni-corrected p-value, m = 3), l hepatitis C virus (HCV; n = 85; F.E.; Bonferroni-corrected p-value, m = 3), or m hepatitis E virus (HEV; n = 67; F.E.; Bonferroni-corrected p-value, m = 3) and development of hepatitis following dual therapy. n No association was observed between rounds of αPD-1/αCTLA-4 administered and development of hepatitis (n = 89; M.W.).
Fig. 2
Fig. 2. Circulating CD4+ T effector memory cell frequency predicts hepatitis after Nivolumab plus Ipilimumab treatment.
a Peripheral blood samples were collected from melanoma patients with metastatic disease receiving αPD-1/αCTLA-4 therapy immediately before administration of the first dose (n = 89). Leucocyte subsets differentially represented in patients with or without hepatitis were identified in a randomly assigned training set (B.H.-corrected t-tests; n = 44; m = 50; FDR = 0.25). Red dots indicate significantly differently represented subsets. Example gating strategies for analysis of flow cytometry data are provided as Supplementary Figs. 2–8. b CD4+ TEM % in training set patients with or without treatment-related hepatitis (n = 44; M.W.). Median values are indicated by a red line. c CD4+ TEM % in validation set patients with or without treatment-related hepatitis (n = 45; M.W.). d ROC analysis of CD4+ TEM % as a discriminatory marker for treatment-related hepatitis in the validation set (n = 45). e Comparison of the bimodal distribution of CD4+ TEM % in patients with unresectable metastatic disease (n = 107) and the normal distribution (n = 49; K2 = 2.79; p = 0.248) of CD4+ TEM % in patients with completely resected tumours. A cut-off of CD4+ TEM ≥ 21% was set (indicated by a dashed red line) below which 99% of completely resected tumour cases should fall. Four pink points represent CD4+ TEM≥21% patients with metastatic disease who were electively treated with αPD-1 monotherapy. f In the validation set, 68.9% patients were correctly classified using a cut-off of CD4+ TEM ≥ 21 %, whereas 55.6% were correctly classified under the no-information model (n = 45; F.E.). g CD4+ TEM ≥ 21 % is not a marker of predisposition to αPD-1/αCTLA-4-related colitis (n = 89; F.E.). h CD4+ TEM≥21% patients did not experience more severe hepatitis than CD4+ TEM<21% patients (n = 38; F.E.). Dashed red line indicates a cut-off of CD4+ TEM ≥ 21%. i Time-to-first presentation of hepatitis was not different between CD4+ TEM≥21% (n = 12) and TEM<21% (n = 26) patients (log-rank). j Twelve of 12 patients with unresectable metastatic melanoma and CD4+ TEM ≥ 21% developed hepatitis after αPD-1/αCTLA-4 dual therapy. By contrast, 3 of 4 CD4+ TEM≥21% patients treated with αPD-1 monotherapy did not develop hepatitis (F.E.; p = 0.007).
Fig. 3
Fig. 3. CD4+ TEM frequency is an independent predictor of αPD-1/αCTLA-4-related hepatitis.
a CD4+ TEM % did not correlate with age (n = 89; Pearson). Dashed red line indicates a cut-off of CD4+ TEM ≥ 21%. b CD4+ TEM % did not correlate with body mass index (n = 89; Pearson). c CD4+ TEM % did not correlate with C-reactive protein (CRP) levels (n = 85; Pearson). d CD4+ TEM % did not correlate with aspartate aminotransferase (AST) levels (n = 87; Pearson). e CD4+ TEM % did not correlate with alanine aminotransferase (AST) levels (n = 89; Pearson). f CD4+ TEM % did not correlate with gamma-glutamyltransferase (γ-GT) levels (n = 89; Pearson). g CD4+ TEM % did not correlate with total bilirubin levels (n = 89; Pearson). h Glucose metabolism measured by 18F-fluoro-2-deoxy-d-glucose (18F-FDG) uptake in PET/CT studies is a quantitative marker of liver inflammation. Calculating standard uptake ratio (SURmean Liver) allows accurate quantification of 18F-FDG uptake in liver by correcting for differential clearance of tracer from blood and liver parenchyma. Higher SURmean Liver values indicate more severe inflammation. T0 = reference time point at 75 min post-injection and T = actual scan time. i SURmean Liver was lower in CD4+ TEM≥21% patients than CD4+ TEM<21% patients who developed hepatitis indicating less inflammation at baseline in the CD4+ TEM≥21% subgroup (n = 28; Pearson). j CD4+ TEM≥21% was not associated with the number of organs containing one or more metastases ≥1.5 cm in diameter (n = 103; F.E.). k CD4+ TEM≥21% was not associated with the presence of hepatic metastases (n = 103; F.E.). l CD4+ TEM % did not correlate with lactate dehydrogenase (LDH) levels (n = 88; Pearson). m CD4+ TEM % did not correlate with protein S100 levels (n = 88; Pearson). n CD4+ TEM≥21% was not associated with any prior therapy (n = 89; F.E.).
Fig. 4
Fig. 4. CD4+ TEM cell enrichment is associated with chronic activation and increased numbers of effector memory CD4+ T cells.
ad Increased CD4+ TEM frequency before treatment reflects a decrease in circulating naïve CD4+ T cells and an increase in circulating numbers of CD4+ TEM cells. a Baseline naïve CD4+ T cell counts (n = 103; M.W.; Bonferroni correction: m = 4, p = 5.2 ⨯ 10−5). b Baseline CD4+ TEM cell counts (n = 103; M.W.; Bonferroni correction: m = 4, p = 8.0 ⨯ 10−4). c Baseline CD4+ TEMRA cell counts (n = 103; M.W.; Bonferroni-corrected p-value, m = 4). d Baseline CD4+ TCM cell counts (n = 103; M.W.; Bonferroni-corrected p-value, m = 4). Median values are indicated by a red line. e Pairwise correlations between CD4+ TEM cell frequency and other leucocyte subset frequencies in the training and validation sets (n = 103; Pearson). Example gating strategies for analysis of flow cytometry data are provided as Supplementary Figs. 2–8. f Baseline CD27+ CD4+ T cell frequencies (n = 103; M.W.; Bonferroni correction: m = 60, p = 4.2 ⨯ 10−10). g Baseline CD57+ CD4+ T cell frequencies (n = 103; M.W.; Bonferroni correction: m = 60, p = 2.0 ⨯ 10−9). h Baseline HLA-DR+ CD4+ T cell frequencies (n = 103; M.W.; Bonferroni correction: m = 60, p = 4.1 ⨯ 10−5). i Baseline CD279+ CD4+ T cell frequencies (n = 103; M.W.; Bonferroni-corrected p-value, m = 60). j Baseline CD160+ CD244+ CD8+ T cell frequencies (n = 103; M.W.; Bonferroni-corrected p-value, m = 60). k Baseline Torque Teno Virus (TTV) loads. Uninfected patients were censored from analysis (n = 74; M.W.; Bonferroni-corrected p-value, m = 60). Median values are indicated by a red line.
Fig. 5
Fig. 5. CD4+ TEM cell expansion correlates with immunity to cytomegalovirus.
a Seasonal presentation of CD4+ TEM≥21% patients between 2017 and 2020 (n = 103; F.E.). Dashed red line indicates a cut-off of CD4+ TEM ≥ 21%. b CD4+ TEM≥21% status was associated with high serum levels of anti-CMV IgG antibodies (n = 100; F.E.; p = 1.2 ⨯ 10−5). Dashed red line indicates a cut-off of CD4+ TEM ≥ 21%. c CD4+ TEM≥21% status was associated with CMV-reactivity in pp65 ELISPOT (n = 53; F.E.; p = 9.0 ⨯ 10−5). Dashed red line indicates a cut-off of CD4+ TEM ≥ 21%. d Development of hepatitis was associated with CMV-seropositivity and CD4+ TEM≥21% status (n = 89). Median values are indicated by a red line. e ROC analysis showing CD4+ TEM % is a superior discriminator of patients at risk of hepatitis when considering only CMV IgG+ cases as opposed to all cases. f Classification of patients with unresectable metastatic melanoma who did or did not develop αPD-1/αCTLA-4-related hepatitis according to CMV IgG status and baseline CD4+ TEM cell frequency using a revised cut-off of CD4+ TEM ≥ 16%. Red boxes indicate 34 of 40 (85%) cases correctly classified by our model (n = 40; F.E.; p = 1.4 ⨯ 10−5). Green box indicates 2 of 17 (11.7%) cases predicted to develop hepatitis who did not. Pink box indicates 4 of 23 (17.4%) cases predicted not to develop hepatitis who did. Blue box indicates 19 of 49 CMV IgG patients not considered by our model who developed hepatitis.
Fig. 6
Fig. 6. CMV-reactive CD4+ T cells are enriched in patients with CD4+ TEM cell expansion.
CMV-reactive CD4+ T cells in patients with unresectable metastatic melanoma were assayed by in vitro stimulation with CMV lysates (blue boxes). Neutralising antibodies (red hatching) were used to detect T cells unable to respond to CMV antigens owing to expression of PD-1 or CTLA-4. T cell responses were quantified by flow cytometry analysis of cytokine expression. a Example data from a CMV IgG+ CD4+ TEM≥16% patient who developed hepatitis. Gating of live, singlet, IFN-γ-producing CD4+ T cells is illustrated in Supplementary Fig. 11. b Frequencies of IFN-γ-producing CD4+ T cells in patients categorised according to CMV IgG serostatus and baseline CD4+ TEM frequency (n = 42; two-way ANOVA with Tukey correction for multiple comparisons; n.s. = not significant). Boxplots represent the median, 25th and 75th percentiles, and Tukey whiskers. c Absolute numbers of circulating IFN-γ-producing CD4+ T cells patients categorised according to CMV IgG serostatus and baseline CD4+ TEM frequency (n = 42; two-way ANOVA with Tukey correction for multiple comparisons; n.s. = not significant). Boxplots represent the median, 25th and 75th percentiles, and Tukey whiskers.
Fig. 7
Fig. 7. Case 1: valganciclovir treatment of late-onset αPD-1/αCTLA-4-related hepatitis.
A 54-year-old male patient who received αPD-1 (Nivolumab) plus αCTLA-4 (Ipilimumab) dual therapy for metastatic melanoma presented with late-onset hepatitis. a Course of treatment. b Change in hepatitis-related parameters over time and their association with introduction, withdrawal and re-introduction of valganciclovir treatment. c The patient presented at the end of week 40 with recrudescent hepatitis and was treated with 900 mg/day valganciclovir for 2 days prior to liver biopsy. Histopathological image of the liver biopsy (H&E staining; scale bar 500 µm). d Generally, the liver parenchyma appeared normal (H&E staining; scale bar 100 µm). e Only a few lymphocytes and sparse necrotic hepatocytes were observed in portal areas with small bile plugs (arrows) with no signs of hepatitis (H&E staining; scale bar 100 µm).
Fig. 8
Fig. 8. Case 2: valganciclovir treatment of late-onset αPD-1/αCTLA-4-related hepatitis.
A 49-year-old male patient who received αPD-1 (Nivolumab) plus αCTLA-4 (Ipilimumab) dual therapy for metastatic melanoma presented with late-onset hepatitis. a Course of treatment. b Change in hepatitis-related parameters over time and their association with introduction of valganciclovir treatment. c Histopathological image of a liver biopsy taken at the start of week 72 showing signs consistent with drug toxicity, autoimmunity or viral infection (H&E staining; scale bar 500 µm). d Extensive centrilobular necrosis (arrows) involving 30–40% of hepatocytes was observed (H&E staining; scale bar 100 µm). e Dense inflammatory infiltration of lymphocytes, eosinophils and neutrophils was seen in portal areas (H&E staining; scale bar 100 µm).
Fig. 9
Fig. 9. Valganciclovir prophylaxis prevents αPD-1/αCTLA-4-related hepatitis.
a Heatmaps showing peak values of AST, ALT and bilirubin expressed as multiples of sex-adjusted upper limit of normal ranges. Fifteen of 17 (88.2%) patients classified as CMV IgG+ CD4+ TEM≥16% at baseline subsequently developed hepatitis. In contrast, 4 of 4 CMV IgG+ CD4+ TEM≥16% patients treated with 900 mg/day prophylactic valganciclovir remained hepatitis free. b In four initial cases, prophylactic valganciclovir prevented development of hepatitis (n = 21; F.E.).

Comment in

Similar articles

Cited by

References

    1. Larkin, J. et al. Five-year survival with combined nivolumab and ipilimumab in advanced melanoma. N. Engl. J. Med.381, 1535–1546 (2019). - PubMed
    1. Robert C, et al. Pembrolizumab versus ipilimumab in advanced melanoma (KEYNOTE-006): post-hoc 5-year results from an open-label, multicentre, randomised, controlled, phase 3 study. Lancet Oncol. 2019;20:1239–1251. - PubMed
    1. Robert C, et al. Nivolumab in previously untreated melanoma without BRAF mutation. N. Engl. J. Med. 2015;372:320–330. - PubMed
    1. Postow MA, et al. Nivolumab and ipilimumab versus ipilimumab in untreated melanoma. N. Engl. J. Med. 2015;372:2006–2017. - PMC - PubMed
    1. Wolchok JD, et al. Overall survival with combined nivolumab and ipilimumab in advanced melanoma. N. Engl. J. Med. 2017;377:1345–1356. - PMC - PubMed

Publication types

MeSH terms