

3D Mueller matrix mapping of layered distributions of depolarisation degree for analysis of prostate adenoma and carcinoma diffuse tissues
- PMID: 33664274
- PMCID: PMC7933337
- DOI: 10.1038/s41598-021-83986-4
3D Mueller matrix mapping of layered distributions of depolarisation degree for analysis of prostate adenoma and carcinoma diffuse tissues
Abstract
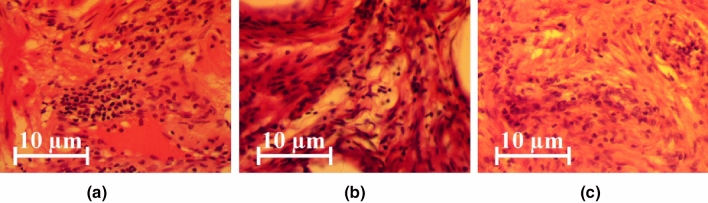
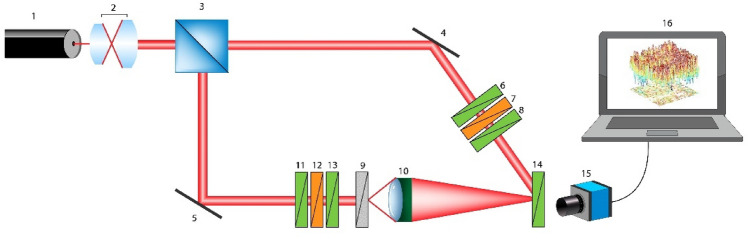
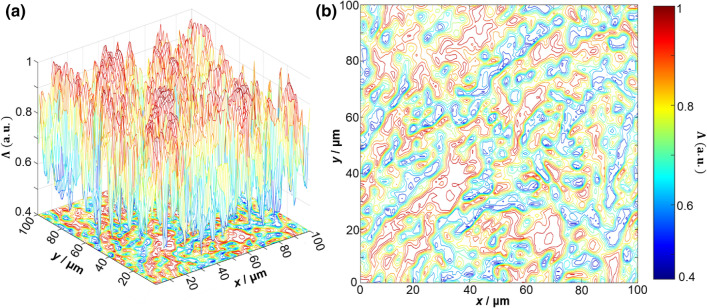
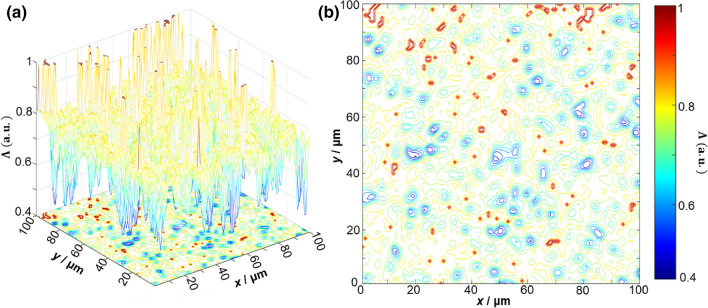
Prostate cancer is the second most common cancer globally in men, and in some countries is now the most diagnosed form of cancer. It is necessary to differentiate between benign and malignant prostate conditions to give accurate diagnoses. We aim to demonstrate the use of a 3D Mueller matrix method to allow quick and easy clinical differentiation between prostate adenoma and carcinoma tissues with different grades and Gleason scores. Histological sections of benign and malignant prostate tumours, obtained by radical prostatectomy, were investigated. We map the degree of depolarisation in the different prostate tumour tissues using a Mueller matrix polarimeter set-up, based on the superposition of a reference laser beam with the interference pattern of the sample in the image plane. The depolarisation distributions can be directly related to the morphology of the biological tissues. The dependences of the magnitude of the 1st to 4th order statistical moments of the depolarisation distribution are determined, which characterise the distributions of the depolarisation values. To determine the diagnostic potential of the method three groups of histological sections of prostate tumour biopsies were formed. The first group contained 36 adenoma tissue samples, while the second contained 36 carcinoma tissue samples of a high grade (grade 4: poorly differentiated-4 + 4 Gleason score), and the third group contained 36 carcinoma tissue samples of a low grade (grade 1: moderately differentiated-3 + 3 Gleason score). Using the calculated values of the statistical moments, tumour tissues are categorised as either adenoma or carcinoma. A high level (> 90%) accuracy of differentiation between adenoma and carcinoma samples was achieved for each group. Differentiation between the high-grade and low-grade carcinoma samples was achieved with an accuracy of 87.5%. The results demonstrate that Mueller matrix mapping of the depolarisation distribution of prostate tumour tissues can accurately differentiate between adenoma and carcinoma, and between different grades of carcinoma. This represents a first step towards the implementation of 3D Mueller matrix mapping for clinical analysis and diagnosis of prostate tumours.
Conflict of interest statement
The authors declare no competing interests.
Figures
Similar articles
-
Extended prostate needle biopsy improves concordance of Gleason grading between prostate needle biopsy and radical prostatectomy.J Urol. 2003 Jan;169(1):136-40. doi: 10.1016/S0022-5347(05)64053-0. J Urol. 2003. PMID: 12478121
-
Increasing the number of biopsies increases the concordance of Gleason scores of needle biopsies and prostatectomy specimens.Urol Oncol. 2007 Sep-Oct;25(5):376-82. doi: 10.1016/j.urolonc.2006.08.028. Urol Oncol. 2007. PMID: 17826653
-
Contemporary Gleason Grading of Prostatic Carcinoma: An Update With Discussion on Practical Issues to Implement the 2014 International Society of Urological Pathology (ISUP) Consensus Conference on Gleason Grading of Prostatic Carcinoma.Am J Surg Pathol. 2017 Apr;41(4):e1-e7. doi: 10.1097/PAS.0000000000000820. Am J Surg Pathol. 2017. PMID: 28177964
-
The ability of prostate-specific antigen (PSA) density to predict an upgrade in Gleason score between initial prostate biopsy and prostatectomy diminishes with increasing tumour grade due to reduced PSA secretion per unit tumour volume.BJU Int. 2012 Jul;110(1):36-42. doi: 10.1111/j.1464-410X.2011.10681.x. Epub 2011 Nov 15. BJU Int. 2012. PMID: 22085203
-
The 2014 International Society of Urological Pathology (ISUP) Consensus Conference on Gleason Grading of Prostatic Carcinoma: Definition of Grading Patterns and Proposal for a New Grading System.Am J Surg Pathol. 2016 Feb;40(2):244-52. doi: 10.1097/PAS.0000000000000530. Am J Surg Pathol. 2016. PMID: 26492179 Review.
Cited by
-
Polarization memory rate as a metric to differentiate benign and malignant tissues.Biomed Opt Express. 2022 Jan 6;13(2):620-632. doi: 10.1364/BOE.446094. eCollection 2022 Feb 1. Biomed Opt Express. 2022. PMID: 35284168 Free PMC article.
-
Reconstructing Three-Dimensional Optical Anisotropy with Tomographic Müller-Polarimetric Microscopy.Adv Sci (Weinh). 2025 Jul;12(27):e2502075. doi: 10.1002/advs.202502075. Epub 2025 May 8. Adv Sci (Weinh). 2025. PMID: 40344522 Free PMC article.
-
Lateral-Type Spin-Photonics Devices: Development and Applications.Micromachines (Basel). 2021 May 31;12(6):644. doi: 10.3390/mi12060644. Micromachines (Basel). 2021. PMID: 34072992 Free PMC article. Review.
-
Mueller Matrix Microscopy for In Vivo Scar Tissue Diagnostics and Treatment Evaluation.Sensors (Basel). 2022 Dec 1;22(23):9349. doi: 10.3390/s22239349. Sensors (Basel). 2022. PMID: 36502051 Free PMC article.
-
Recombinant Spidroin Microgel as the Base of Cell-Engineered Constructs Mediates Liver Regeneration in Rats.Polymers (Basel). 2022 Aug 4;14(15):3179. doi: 10.3390/polym14153179. Polymers (Basel). 2022. PMID: 35956695 Free PMC article.
References
-
- Tuchin VV. Tissue optics and photonics: light-tissue interaction. J. Biomed. Photonics Eng. 2015;1:98–134. doi: 10.18287/JBPE-2015-1-2-98. - DOI
Publication types
MeSH terms
LinkOut - more resources
Full Text Sources
Other Literature Sources
Medical
