. 2021 Mar 4;11(1):5267.
doi: 10.1038/s41598-021-84443-y.

Knocking out alpha-synuclein in melanoma cells dysregulates cellular iron metabolism and suppresses tumor growth

Affiliations

Knocking out alpha-synuclein in melanoma cells dysregulates cellular iron metabolism and suppresses tumor growth

Sahar Shekoohi et al. Sci Rep. .

Abstract

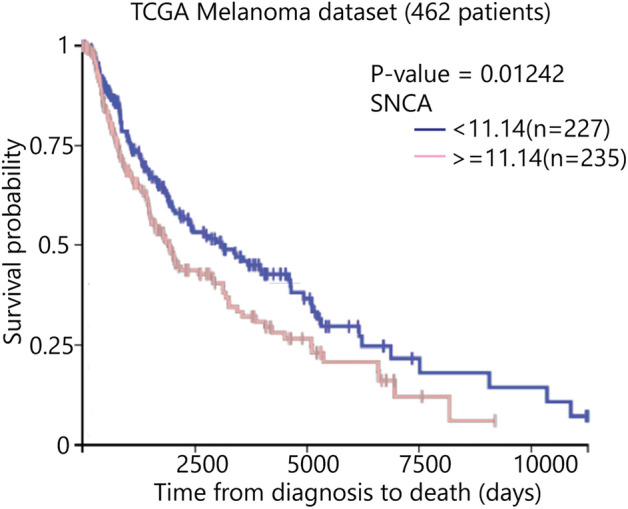
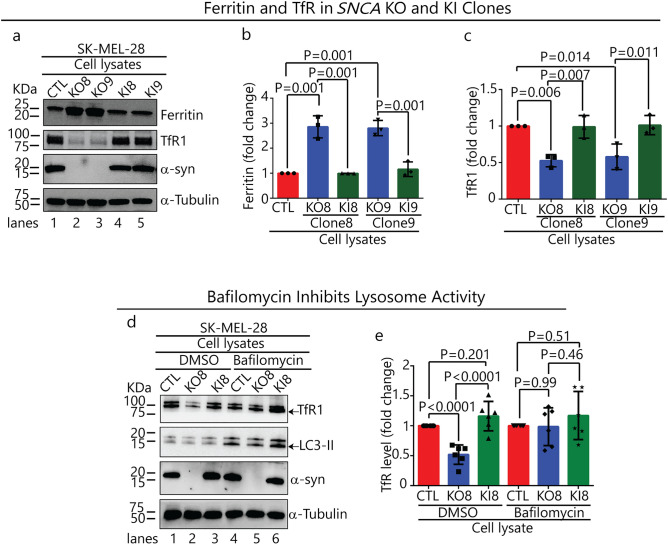
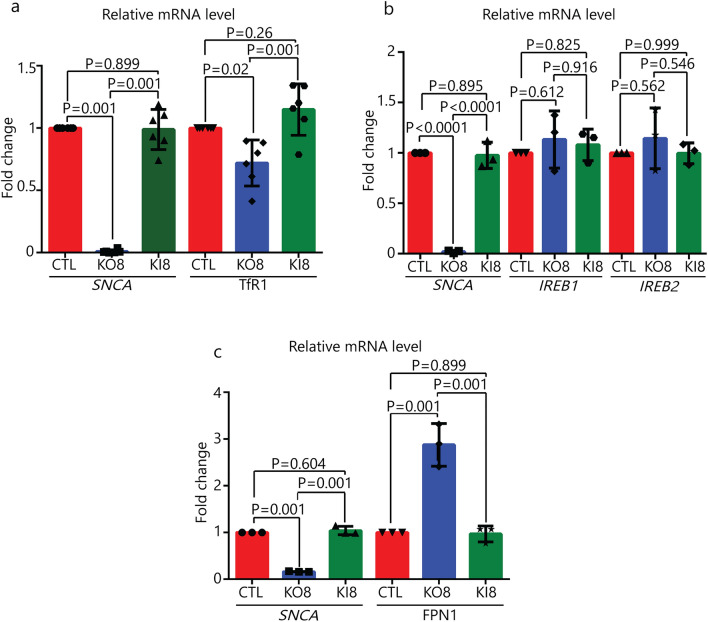
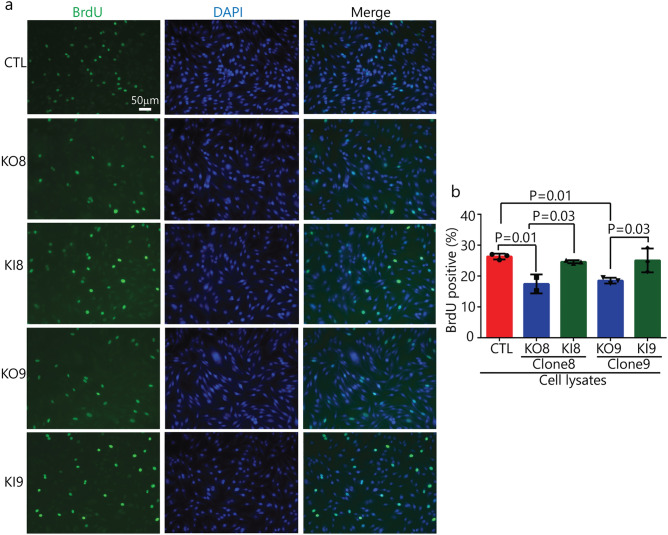
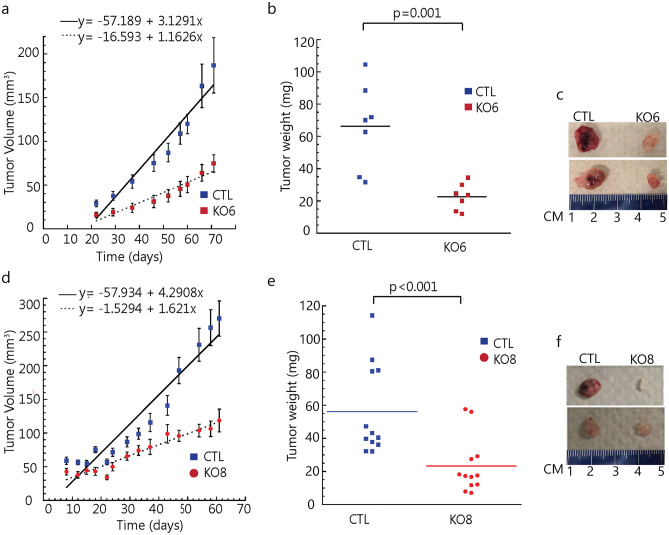
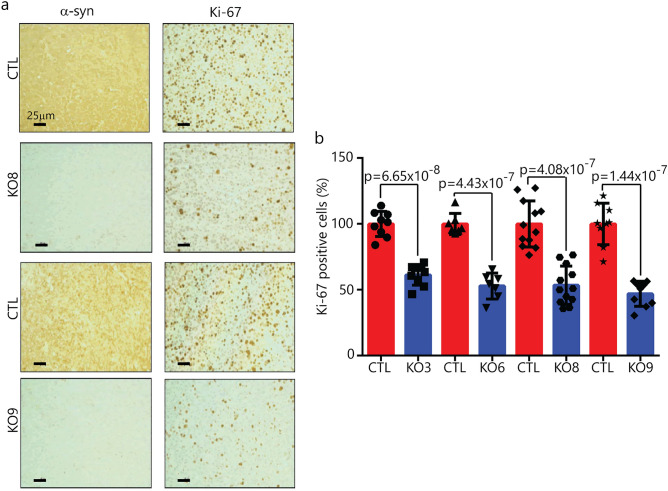
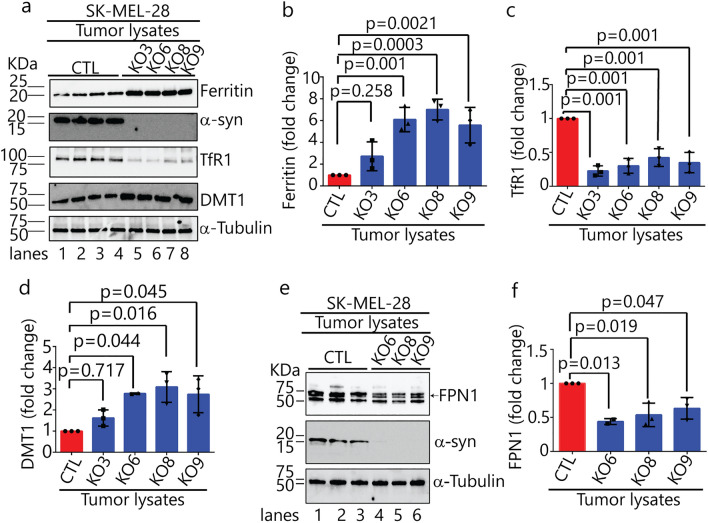
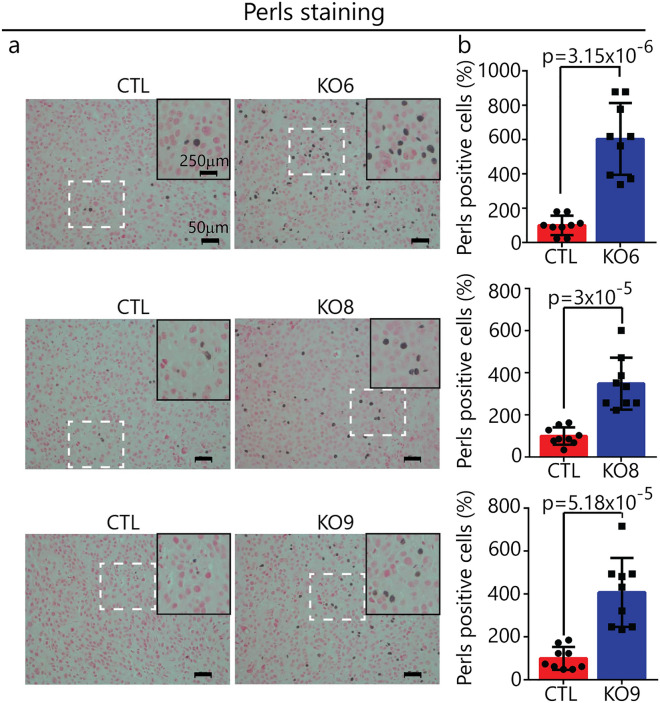
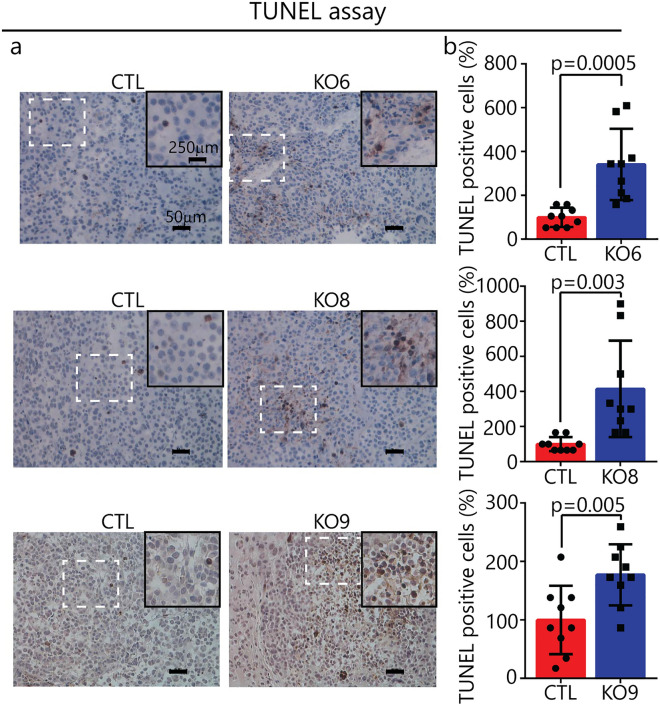
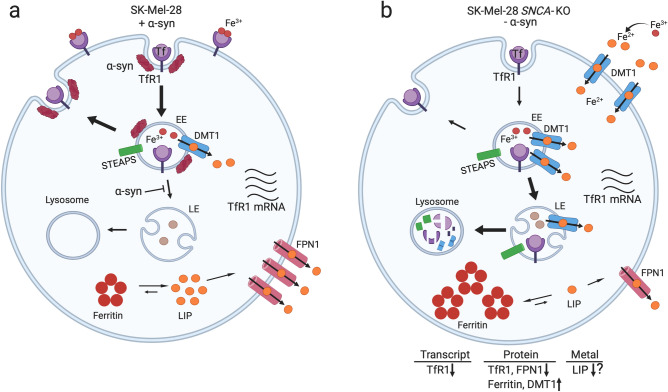
The protein alpha-synuclein (α-syn) is unusual because, depending on its conformation and the type of cell in which it is expressed, it is pro-death or pro-survival, triggering neurodegeneration in Parkinson's disease and enhancing cell survival of some melanomas. To probe the function of α-syn in melanoma, we used CRISPR/Cas9 to knockout SNCA, the gene that codes for α-syn, in SK-Mel-28 melanoma cells. The SNCA-knockout clones in culture exhibited a decrease in the transferrin receptor 1 (TfR1), an increase in ferritin, an increase of reactive oxygen species and proliferated slower than control cells. These SNCA-knockout clones grafted into SCID mice grew significantly slower than the SK-Mel-28 control cells that expressed α-syn. In the excised SNCA-knockout xenografts, TfR1 decreased 3.3-fold, ferritin increased 6.2-fold, the divalent metal ion transporter 1 (DMT1) increased threefold, and the iron exporter ferroportin (FPN1) decreased twofold relative to control xenografts. The excised SNCA-KO tumors exhibited significantly more ferric iron and TUNEL staining relative to the control melanoma xenografts. Collectively, depletion of α-syn in SK-Mel-28 cells dysregulates cellular iron metabolism, especially in xenografts, yielding melanoma cells that are deficient in TfR1 and FPN1, that accumulate ferric iron and ferritin, and that undergo apoptosis relative to control cells expressing α-syn.


Conflict of interest statement

The authors declare no competing interests.

Figures

Figure 1
Figure 1
Kaplan–Meier survival curves utilizing TCGA (The Cancer Genome Atlas) melanoma mRNA expression dataset. Analysis was performed, comparing patients with high SNCA expression (red line) to low SNCA expression (blue line). Xena Browser compared the two Kaplan–Meier survival curves using the log-rank test (p = 0.01242, n = 462).
Figure 2
Figure 2
Loss of α-syn decreases the level of the TfR1 and increases the level of ferritin. (a) Representative Western blots of ferritin, TfR1, α-syn in lysates of the control, KO and KI cells cultured in vitro. (b) and (c) Quantitative analysis of the fold change in ferritin and TfR1. The band intensities of ferritin and TfR1 are normalized to α-tubulin. A one-way ANOVA followed by post hoc Dunnett test was used to determine p values (n = 3). (d) Representative Western blots showing the effect of bafilomycin A1 on the levels of TfR1, LC3-II and α-syn. Indicated cells were treated with 50 nM bafilomycin A1 for 5 h and the lysates were probed for the indicated proteins. (e) Quantitative analysis of the fold change in TfR1. TfR1 was normalized to α-tubulin. A one-way ANOVA followed by post hoc Dunnett test was used to determine p values (n = 6). All data are mean ± s.d. Uncropped sections of the blots are shown in Supplementary Figure S2.
Figure 3
Figure 3
qRT-PCR analysis of iron related genes. Fold-change in mRNA level of SNCA and TfR1 (a), SNCA and IREB1/2 (b), and SNCA and FPN1 (c) in control, KO8 and KI8 cells. Error bars are ± s.d, n = 3 per group except for TfR1 (n = 6). P-values were determined by a one-way ANOVA with Dunnet post-hoc test.
Figure 4
Figure 4
Loss of α-syn expression suppresses cell proliferation in vitro. (a) BrdU cell proliferation assay for control, KO and KI clones. Cells were probed with anti-BrdU antibody followed by FITC-conjugated secondary antibody (green) and counter staining the nuclei with DAPI (blue). Scale bar 50 μm magnification ×20 (n = 3). (b) Quantitative data expressing BrdU positive cells (in green) was evaluated by counting the positively stained cells in a blinded fashion by an unbiased observer utilizing Image J software. The average number of BrdU positive cells across 3 fields/slide was used to denote the total number of positively stained cells and expressed as percentage of BrdU positive cells. A one-way ANOVA with Dunnett test was performed to calculate p values.
Figure 5
Figure 5
Loss of α-syn expression suppresses cell growth in a mouse xenograft model. (a) and (d) Tumor volume over time for the control, SNCA, KO6 and KO8 mice xenografts. Tumor volume was assessed every 2 days, and average tumor weight was determined after the mice were sacrificed at the end of 72-day experiment. (b) and (e) Weight of the excised tumors are shown. (c) and (f) Representative photographs of xenograft mice tumors. Tumor volume and weight were analyzed using two-tailed Student's t test (n = 7 for KO6 and n = 12 for KO8).
Figure 6
Figure 6
α-Syn and Ki-67 staining of tumor tissue from SK-Mel-28 xenografts. (a) Representative images of immunostained sections of xenografts generated from subcutaneous injection of the SNCA KO clone 8, 9 and control cells into mice. Tumor sections were probed with antibodies specific for α-syn and Ki-67. Magnification 20 × , scale bar = 25 μm. (b) Plot of the number of Ki-67 immunopositive cells per ×20 field. For each condition, n = 3 (KO3, 6, 9) and n = 4 (KO8) xenografts, with 1–3 fields counted for each slide. The two tailed student's t test was performed to calculate p values. Data for clones KO3 and 6 are given in the Supplementary section. Error bars are ± s.d.
Figure 7
Figure 7
Loss of α-syn alters levels of proteins involved in iron-homeostasis. (a) Representative Western blots of iron-related proteins (ferritin, α-syn, TfR1, and DMT1) in the indicated xenograft lysates. (bd) Quantitative analysis of fold changes in ferritin, TfR1 and DMT1, derived from densitometric analysis of band intensities normalized to α-tubulin. P-values were determined using a one-way ANOVA with Dunnett posthoc test (n = 3). (e) Representative Western blots of ferroportin (FPN1) and α-syn in the indicated xenograft lysates. (f) Quantitative analysis of the fold change in FPN1, derived from densitometric analysis of band intensities normalized to α-tubulin. P-values were determined using a one-way ANOVA with Dunnett posthoc test (n = 3). Error bars in each plot are ± s.d. Uncropped sections of blots are shown in Supplementary Figure S5.
Figure 8
Figure 8
Iron accumulation in SNCA KO xenografts. (a) Representative images of Pearl’s stained xenograft tissue sections. Inner panel shows zoomed in region of interest from each section for better illustration. Histological sections stained with Perls Prussian blue and Nuclear fast red indicate the presence of hemosiderin (blue-black stain). Iron in hemosiderin (an iron-storage complex) turns blue to black when exposed to potassium ferrocyanide (Prussian blue stain). Magnification: ×20, Scale bar: 50 μm. (b) Plots of the average number of black puncta (hemosiderin) per unit area (×20 field) for control and KO xenografts. For each condition, n = 3 xenografts, with 3 fields counted for each slide (= 9 fields). A two tailed student's t test was used to calculate p values. Error bars are ± s.d.
Figure 9
Figure 9
Apoptosis in in SNCA KO xenografts. (a) Representative xenograft tissue sections from control and KO tumors following the TUNEL assay. Magnification: ×20, Scale bar: 50 μm. (b) Plots of average number of TUNEL positive cells per unit area (×20 field) in control and KOs. For each condition, n = 3 xenografts, with 3 fields counted for each slide (= 9 fields). A two tailed student's t test was used to calculate p values. Error bars are ± s.d.
Figure 10
Figure 10
Model for the dysregulation of iron metabolic proteins in SNCA-KO melanoma cells. (a) To acquire iron for the enzymes of respiration, DNA synthesis and repair and cluster iron-sulphur production, cancer cells often exhibit an “iron-seeking phenotype,” i.e., increased levels of transferrin receptor 1 (TFR1), six-transmembrane epithelial antigen of prostate (STEAP) proteins, divalent metal ion transporter 1 (DMT1), and hepcidin (HP) (not shown here) and decreased level of ferroportin (FPN1) compared with normal cells of the same tissue. (b) SK-Mel-28 SNCA-KO melanoma clones exhibit an increase in ferric iron and ferritin and a decrease in TfR1 receptors relative to control cells. DMT1 protein level is increased relative to control cells, and FPN1 is transcriptionally upregulated (Fig. 3) although its expression is lower than in control cells (Fig. 7e,f). SNCA-KO melanoma cells are overloaded with ferritin-ferric iron and likely have a low level of useable ferrous iron (labile iron pool, LIP) relative to SK-Mel-28 control cells. Such SNCA-KO cells are functionally iron deficient. The question mark (?) indicates that we have not proved that LIP is low. The red arrows show the direction of change relative to the SK-Mel-28 control cells.

Similar articles

Cited by

References

    1. Olsen JH, Friis S, Frederiksen K. Malignant melanoma and other types of cancer preceding Parkinson disease. Epidemiology. 2006;17:582–587. doi: 10.1097/01.ede.0000229445.90471.5e. - DOI - PubMed
    1. Gao X, Simon KC, Han J, Schwarzschild MA, Ascherio A. Family history of melanoma and Parkinson disease risk. Neurology. 2009;73:1286–1291. doi: 10.1212/WNL.0b013e3181bd13a1. - DOI - PMC - PubMed
    1. Bertoni JM, et al. Increased melanoma risk in Parkinson disease a prospective clinicopathological study. Arch. Neurol. 2010;67:347–352. doi: 10.1001/archneurol.2010.1. - DOI - PubMed
    1. Bose A, Petsko GA, Eliezer D. Parkinson's disease and melanoma: Co-occurrence and mechanisms. J. Parkinsons Dis. 2018;8:385–398. doi: 10.3233/jpd-171263. - DOI - PMC - PubMed
    1. Pan T, Li X, Jankovic J. The association between Parkinson's disease and melanoma. Int. J. Cancer. 2011;128:2251–2260. doi: 10.1002/ijc.25912. - DOI - PubMed

Publication types

MeSH terms