

Differences in clinical severity of respiratory viral infections in hospitalized children
- PMID: 33664311
- PMCID: PMC7933285
- DOI: 10.1038/s41598-021-84423-2
Differences in clinical severity of respiratory viral infections in hospitalized children
Abstract
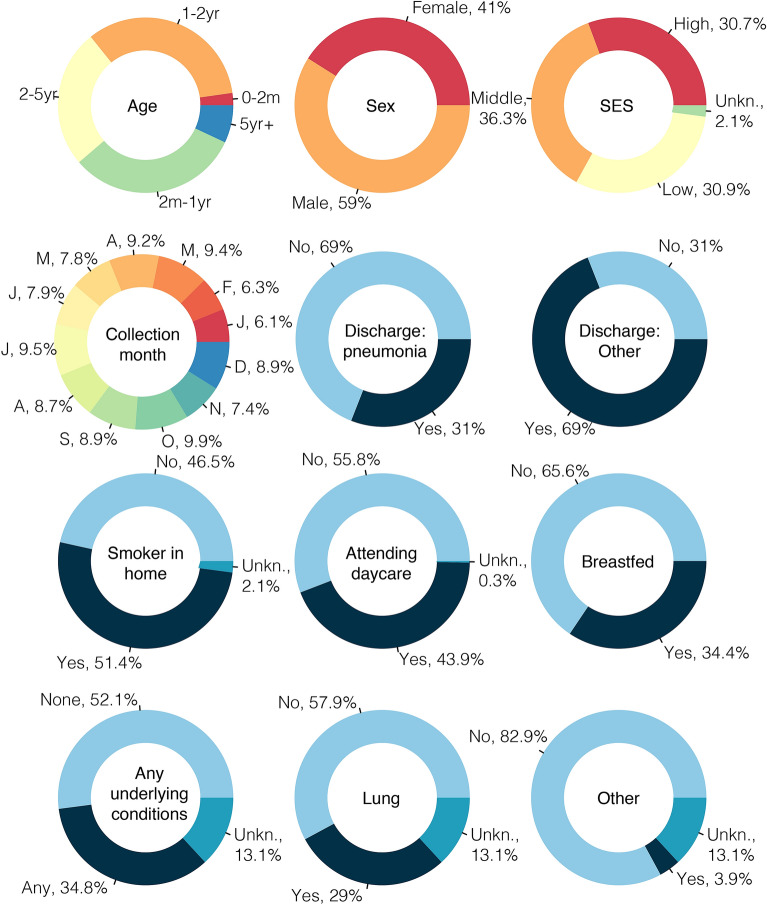
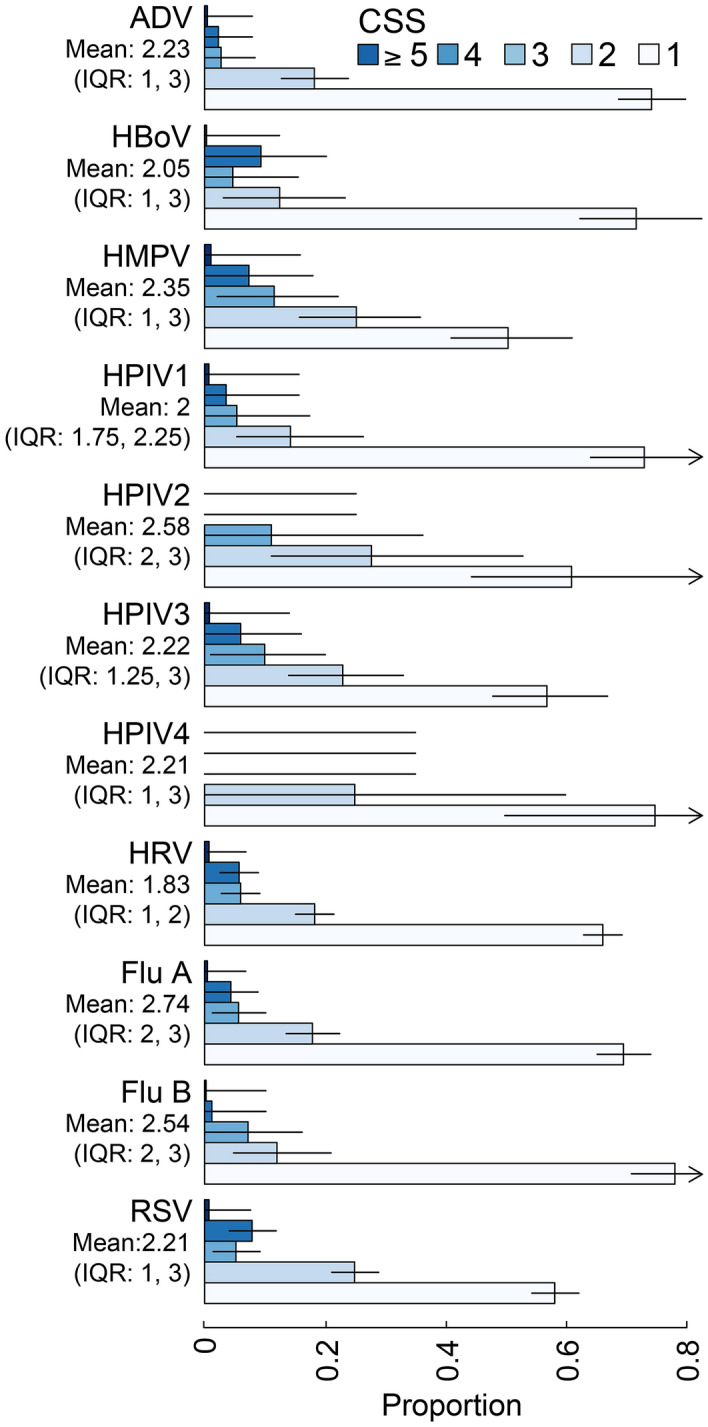
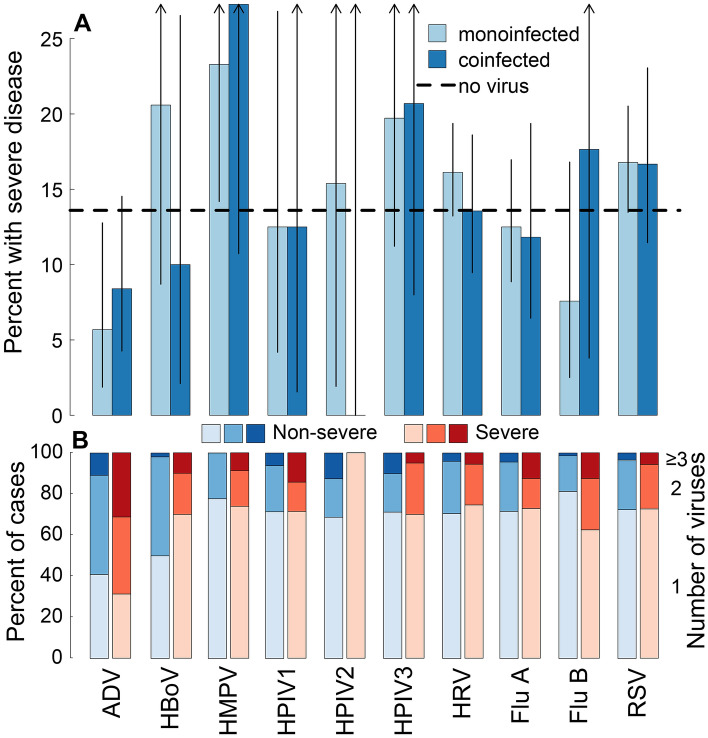
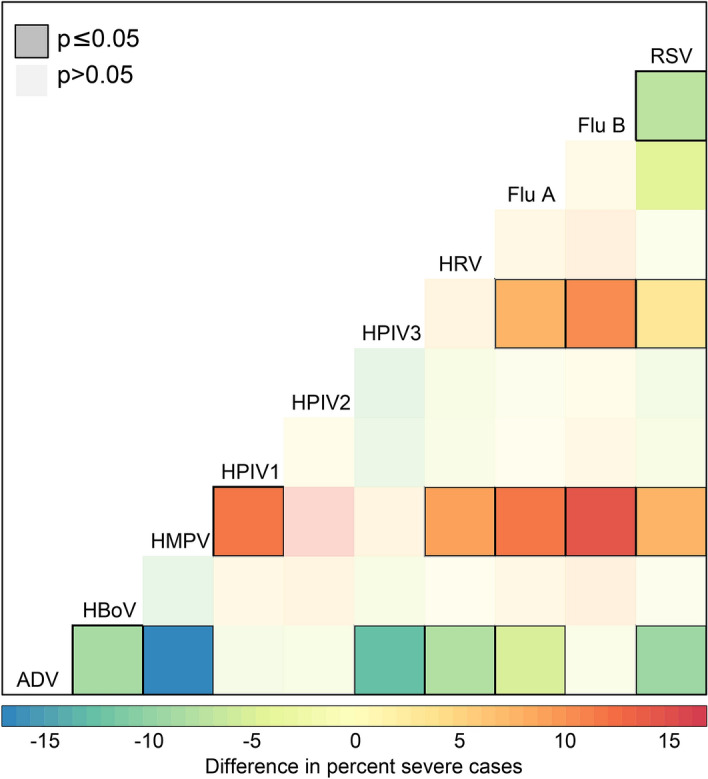
It is uncertain whether clinical severity of an infection varies by pathogen or by multiple infections. Using hospital-based surveillance in children, we investigate the range of clinical severity for patients singly, multiply, and not infected with a group of commonly circulating viruses in Nha Trang, Vietnam. RT-PCR was performed to detect 13 respiratory viruses in nasopharyngeal samples from enrolled patients. We apply a novel clinical severity score and examine associations with the odds of being severe and differences in raw severity scores. We find no difference in severity between 0-, 1-, and 2-concurrent infections and little differences in severity between specific viruses. We find RSV and HMPV infections to be associated with 2- and 1.5-fold increase in odds of being severe, respectively, and that infection with ADV is consistently associated with lower risk of severity. Clinically, based on the results here, if RSV or HMPV virus is suspected, PCR testing for confirmatory diagnosis and for detection of multiple coinfecting viruses would be fruitful to assess whether a patient's disease course is going to be severe.
Conflict of interest statement
The authors declare no competing interests.
Figures
Similar articles
-
Comparing Human Metapneumovirus and Respiratory Syncytial Virus: Viral Co-Detections, Genotypes and Risk Factors for Severe Disease.PLoS One. 2017 Jan 17;12(1):e0170200. doi: 10.1371/journal.pone.0170200. eCollection 2017. PLoS One. 2017. PMID: 28095451 Free PMC article.
-
Clinical characteristics and viral load of respiratory syncytial virus and human metapneumovirus in children hospitaled for acute lower respiratory tract infection.J Med Virol. 2017 Apr;89(4):589-597. doi: 10.1002/jmv.24687. Epub 2016 Sep 28. J Med Virol. 2017. PMID: 27632796 Free PMC article.
-
Comparison of human metapneumovirus, respiratory syncytial virus and Rhinovirus respiratory tract infections in young children admitted to hospital.J Med Virol. 2015 Feb;87(2):275-80. doi: 10.1002/jmv.24025. Epub 2014 Jul 30. J Med Virol. 2015. PMID: 25074284 Free PMC article.
-
Etiology, seasonality, and clinical characterization of viral respiratory infections among hospitalized children in Beirut, Lebanon.J Med Virol. 2016 Nov;88(11):1874-81. doi: 10.1002/jmv.24544. Epub 2016 May 19. J Med Virol. 2016. PMID: 27061822 Free PMC article.
-
Elucidation and clinical role of emerging viral respiratory tract infections in children.Adv Exp Med Biol. 2013;764:191-204. doi: 10.1007/978-1-4614-4726-9_16. Adv Exp Med Biol. 2013. PMID: 23654068 Free PMC article. Review.
Cited by
-
Presence and Significance of Multiple Respiratory Viral Infections in Children Admitted to a Tertiary Pediatric Hospital in Italy.Viruses. 2024 May 9;16(5):750. doi: 10.3390/v16050750. Viruses. 2024. PMID: 38793631 Free PMC article.
-
The burden of hospital-attended influenza in Norwegian children.Front Pediatr. 2022 Sep 7;10:963274. doi: 10.3389/fped.2022.963274. eCollection 2022. Front Pediatr. 2022. PMID: 36160779 Free PMC article.
-
Potential Neurocognitive Symptoms Due to Respiratory Syncytial Virus Infection.Pathogens. 2021 Dec 31;11(1):47. doi: 10.3390/pathogens11010047. Pathogens. 2021. PMID: 35055995 Free PMC article. Review.
-
Influenza versus other respiratory viruses - assessing severity among hospitalised children, Belgium, 2011 to 2020.Euro Surveill. 2023 Jul;28(29):2300056. doi: 10.2807/1560-7917.ES.2023.28.29.2300056. Euro Surveill. 2023. PMID: 37470740 Free PMC article.
-
Bacterial and Viral Coinfections with the Human Respiratory Syncytial Virus.Microorganisms. 2021 Jun 13;9(6):1293. doi: 10.3390/microorganisms9061293. Microorganisms. 2021. PMID: 34199284 Free PMC article. Review.
References
-
- Scotta MC, Chakr VCBG, de Moura A, Becker RG, de Souza APD, Jones MH, Pinto LA, Sarria EE, Pitrez PM, Stein RT, et al. Respiratory viral coinfection and disease severity in children: A systematic review and meta-analysis. J. Clin. Virol. 2016;80:45–56. doi: 10.1016/j.jcv.2016.04.019. - DOI - PMC - PubMed
-
- Yoshida L.-M, Suzuki M, Nguyen H. A, Le M. N, Vu T. D, Yoshino H, Schmidt W.-P, Nguyen T. T. A, Le H. T, Morimoto K, Duc Anh D, Ariyoshi K. Respiratory syncytial virus: Co-infection and paediatric lower respiratory tract infections. Eur. Respir. J. 2013;42(2):461–469. doi: 10.1183/09031936.00101812. - DOI - PubMed
Publication types
MeSH terms
Grants and funding
LinkOut - more resources
Full Text Sources
Other Literature Sources
Medical
