

Global, regional and national epidemiology and prevalence of child stunting, wasting and underweight in low- and middle-income countries, 2006-2018
- PMID: 33664313
- PMCID: PMC7933191
- DOI: 10.1038/s41598-021-84302-w
Global, regional and national epidemiology and prevalence of child stunting, wasting and underweight in low- and middle-income countries, 2006-2018
Abstract
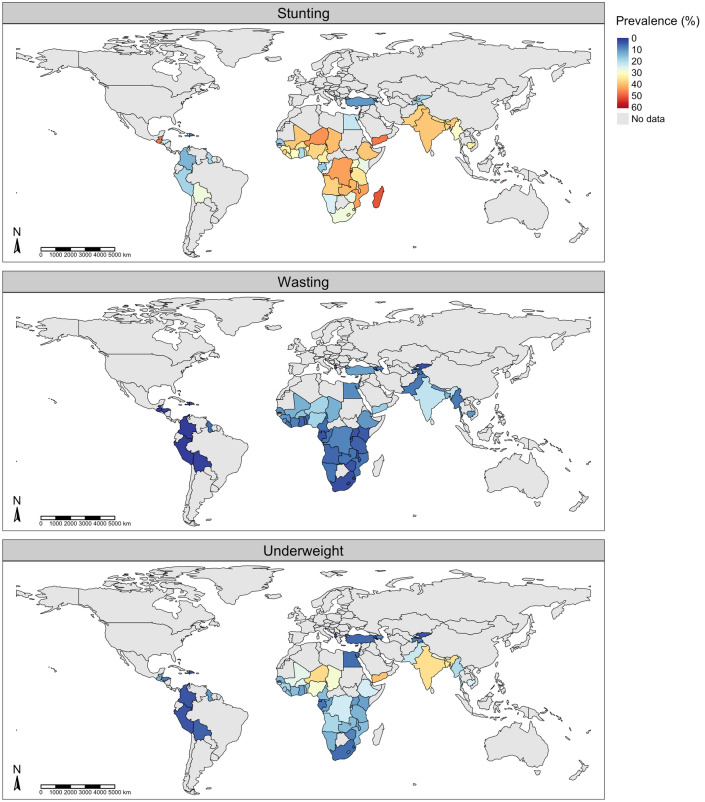
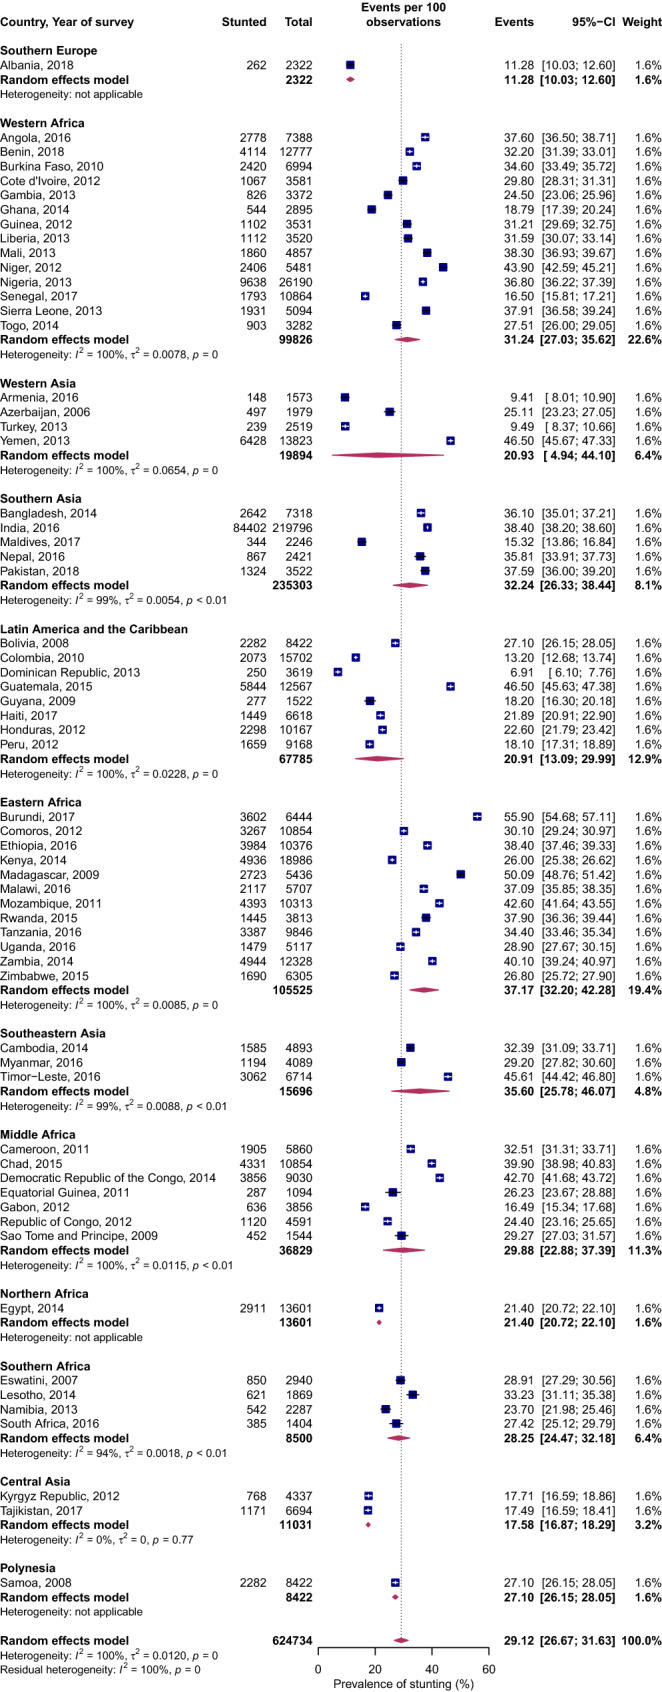
In 2016, undernutrition, as manifested in childhood stunting, wasting, and underweight were estimated to cause over 1.0 million deaths, 3.9% of years of life lost, and 3.8% of disability-adjusted life years globally. The objective of this study is to estimate the prevalence of undernutrition in low- and middle-income countries (LMICs) using the 2006-2018 cross-sectional nationally representative demographic and health surveys (DHS) data and to explore the sources of regional variations. Anthropometric measurements of children 0-59 months of age from DHS in 62 LMICs worldwide were used. Complete information was available for height-for-age (n = 624,734), weight-for-height (n = 625,230) and weight-for-age (n = 626,130). Random-effects models were fit to estimate the pooled prevalence of stunting, wasting, and underweight. Sources of heterogeneity in the prevalence estimates were explored through subgroup meta-analyses and meta-regression using generalized linear mixed-effects models. Human development index (a country-specific composite index based on life expectancy, literacy, access to education and per capita gross domestic product) and the United Nations region were explored as potential sources of variation in undernutrition. The overall prevalence was 29.1% (95% CI 26.7%, 31.6%) for stunting, 6.3% (95% CI 4.6%, 8.2%) for wasting, and 13.7% (95% CI 10.9%, 16.9%) for underweight. Subgroup analyses suggested that Western Africa, Southern Asia, and Southeastern Asia had a substantially higher estimated prevalence of undernutrition than global average estimates. In multivariable meta-regression, a combination of human development index and United Nations region (a proxy for geographical variation) explained 54%, 56%, and 66% of the variation in stunting, wasting, and underweight prevalence, respectively. Our findings demonstrate that regional, subregional, and country disparities in undernutrition remain, and the residual gaps to close towards achieving the second sustainable development goal-ending undernutrition by 2030.
Conflict of interest statement
The authors declare no competing interests.
Figures


References
-
- Gakidou E, et al. Global, regional, and national comparative risk assessment of 84 behavioural, environmental and occupational, and metabolic risks or clusters of risks, 1990–2016: A systematic analysis for the Global Burden of Disease Study 2016. The Lancet. 2017;390:1345–1422. doi: 10.1016/S0140-6736(17)32366-8. - DOI - PMC - PubMed
-
- Lim SS, et al. A comparative risk assessment of burden of disease and injury attributable to 67 risk factors and risk factor clusters in 21 regions, 1990–2010: A systematic analysis for the Global Burden of Disease Study 2010. The Lancet. 2012;380:2224–2260. doi: 10.1016/S0140-6736(12)61766-8. - DOI - PMC - PubMed
-
- United Nations Children’s Fund (UNICEF), W. H. O., International Bank for Reconstruction and Development/The World Bank. Levels and trends in child malnutrition: key findings of the 2019 Edition of the Joint Child Malnutrition Estimates. Geneva: World Health Organization. https://www.who.int/nutgrowthdb/jme-2019-key-findings.pdf?ua=1 (2019).
Publication types
MeSH terms
Grants and funding
LinkOut - more resources
Full Text Sources
Other Literature Sources
Medical
