Machine learning-based classification of mitochondrial morphology in primary neurons and brain
- PMID: 33664336
- PMCID: PMC7933342
- DOI: 10.1038/s41598-021-84528-8
Machine learning-based classification of mitochondrial morphology in primary neurons and brain
Abstract
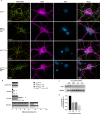
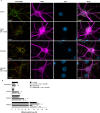
The mitochondrial network continually undergoes events of fission and fusion. Under physiologic conditions, the network is in equilibrium and is characterized by the presence of both elongated and punctate mitochondria. However, this balanced, homeostatic mitochondrial profile can change morphologic distribution in response to various stressors. Therefore, it is imperative to develop a method that robustly measures mitochondrial morphology with high accuracy. Here, we developed a semi-automated image analysis pipeline for the quantitation of mitochondrial morphology for both in vitro and in vivo applications. The image analysis pipeline was generated and validated utilizing images of primary cortical neurons from transgenic mice, allowing genetic ablation of key components of mitochondrial dynamics. This analysis pipeline was further extended to evaluate mitochondrial morphology in vivo through immunolabeling of brain sections as well as serial block-face scanning electron microscopy. These data demonstrate a highly specific and sensitive method that accurately classifies distinct physiological and pathological mitochondrial morphologies. Furthermore, this workflow employs the use of readily available, free open-source software designed for high throughput image processing, segmentation, and analysis that is customizable to various biological models.
Conflict of interest statement
The authors declare no competing interests.
Figures


Similar articles
-
3D Reconstruction of the Mitochondrial Network within the Neuronal Soma from SBF-SEM Volume Data.Methods Mol Biol. 2024;2831:145-177. doi: 10.1007/978-1-0716-3969-6_11. Methods Mol Biol. 2024. PMID: 39134849
-
Acute focal brain damage alters mitochondrial dynamics and autophagy in axotomized neurons.Cell Death Dis. 2014 Nov 27;5(11):e1545. doi: 10.1038/cddis.2014.511. Cell Death Dis. 2014. PMID: 25429622 Free PMC article.
-
Mito Hacker: a set of tools to enable high-throughput analysis of mitochondrial network morphology.Sci Rep. 2020 Nov 3;10(1):18941. doi: 10.1038/s41598-020-75899-5. Sci Rep. 2020. PMID: 33144635 Free PMC article.
-
Mitochondrial fusion/fission dynamics in neurodegeneration and neuronal plasticity.Neurobiol Dis. 2016 Jun;90:3-19. doi: 10.1016/j.nbd.2015.10.011. Epub 2015 Oct 19. Neurobiol Dis. 2016. PMID: 26494254 Review.
-
New developments in electron microscopy for serial image acquisition of neuronal profiles.Microscopy (Oxf). 2015 Feb;64(1):27-36. doi: 10.1093/jmicro/dfu111. Epub 2015 Jan 5. Microscopy (Oxf). 2015. PMID: 25564566 Review.
Cited by
-
Agent-based modeling of neuronal mitochondrial dynamics using intrinsic variables of individual mitochondria.iScience. 2025 Apr 8;28(5):112390. doi: 10.1016/j.isci.2025.112390. eCollection 2025 May 16. iScience. 2025. PMID: 40330889 Free PMC article.
-
DRP1, fission and apoptosis.Cell Death Discov. 2025 Apr 7;11(1):150. doi: 10.1038/s41420-025-02458-0. Cell Death Discov. 2025. PMID: 40195359 Free PMC article. Review.
-
Meshed neuronal mitochondrial networks empowered by AI-powered classifiers and immersive VR reconstruction.Front Neurosci. 2023 Feb 2;17:1059965. doi: 10.3389/fnins.2023.1059965. eCollection 2023. Front Neurosci. 2023. PMID: 36816131 Free PMC article.
-
Serine 39 in the GTP-binding domain of Drp1 is involved in shaping mitochondrial morphology.FEBS Open Bio. 2024 Jul;14(7):1147-1165. doi: 10.1002/2211-5463.13820. Epub 2024 May 17. FEBS Open Bio. 2024. PMID: 38760979 Free PMC article.
-
Cholic and deoxycholic acids induce mitochondrial dysfunction, impaired biogenesis and autophagic flux in skeletal muscle cells.Biol Res. 2023 Jun 8;56(1):30. doi: 10.1186/s40659-023-00436-3. Biol Res. 2023. PMID: 37291645 Free PMC article.
References
Publication types
MeSH terms
Grants and funding
LinkOut - more resources
Full Text Sources
Other Literature Sources
Molecular Biology Databases

