

Multinuclear MRI to disentangle intracellular sodium concentration and extracellular volume fraction in breast cancer
- PMID: 33664340
- PMCID: PMC7933187
- DOI: 10.1038/s41598-021-84616-9
Multinuclear MRI to disentangle intracellular sodium concentration and extracellular volume fraction in breast cancer
Abstract
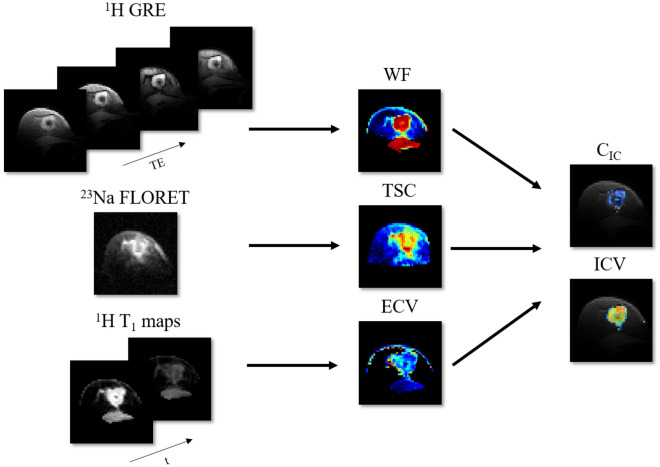
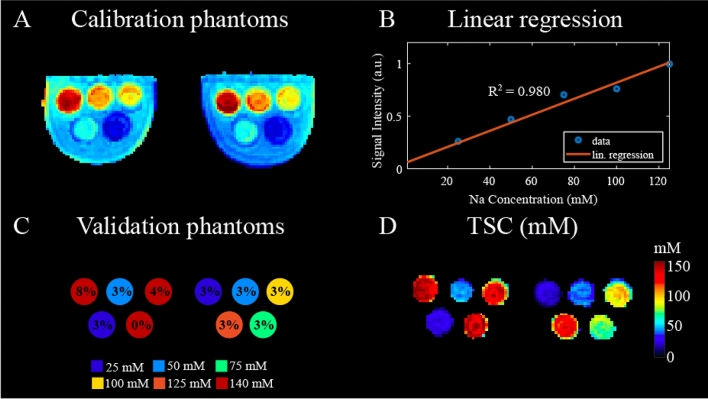
The purpose of this work was to develop a novel method to disentangle the intra- and extracellular components of the total sodium concentration (TSC) in breast cancer from a combination of proton ([Formula: see text]H) and sodium ([Formula: see text]) magnetic resonance imaging (MRI) measurements. To do so, TSC is expressed as function of the intracellular sodium concentration ([Formula: see text]), extracellular volume fraction (ECV) and the water fraction (WF) based on a three-compartment model of the tissue. TSC is measured from [Formula: see text] MRI, ECV is calculated from baseline and post-contrast [Formula: see text]H [Formula: see text] maps, while WF is measured with a [Formula: see text]H chemical shift technique. [Formula: see text] is then extrapolated from the model. Proof-of-concept was demonstrated in three healthy subjects and two patients with triple negative breast cancer. In both patients, TSC was two to threefold higher in the tumor than in normal tissue. This alteration mainly resulted from increased [Formula: see text] ([Formula: see text] 30 mM), which was [Formula: see text] 130% greater than in healthy conditions (10-15 mM) while the ECV was within the expected range of physiological values (0.2-0.25). Multinuclear MRI shows promise for disentangling [Formula: see text] and ECV by taking advantage of complementary [Formula: see text]H and [Formula: see text] measurements.
Conflict of interest statement
The authors declare no competing interests.
Figures


Similar articles
-
Improved T*₂ determination in 23Na, 35Cl, and 17O MRI using iterative partial volume correction based on 1H MRI segmentation.MAGMA. 2017 Dec;30(6):519-536. doi: 10.1007/s10334-017-0623-2. Epub 2017 May 26. MAGMA. 2017. PMID: 28550649
-
Accelerating multi-echo water-fat MRI with a joint locally low-rank and spatial sparsity-promoting reconstruction.MAGMA. 2017 Apr;30(2):189-202. doi: 10.1007/s10334-016-0595-7. Epub 2016 Nov 7. MAGMA. 2017. PMID: 27822655
-
Accelerated quantification of tissue sodium concentration in skeletal muscle tissue: quantitative capability of dictionary learning compressed sensing.MAGMA. 2020 Aug;33(4):495-505. doi: 10.1007/s10334-019-00819-2. Epub 2020 Jan 16. MAGMA. 2020. PMID: 31950390
-
Multipulse sodium magnetic resonance imaging for multicompartment quantification: Proof-of-concept.Sci Rep. 2017 Dec 12;7(1):17435. doi: 10.1038/s41598-017-17582-w. Sci Rep. 2017. PMID: 29234043 Free PMC article.
-
Changes in Diffuse Optical Tomography Images During Early Stages of Neoadjuvant Chemotherapy Correlate with Tumor Response in Different Breast Cancer Subtypes.Clin Cancer Res. 2021 Apr 1;27(7):1949-1957. doi: 10.1158/1078-0432.CCR-20-1108. Epub 2021 Jan 15. Clin Cancer Res. 2021. PMID: 33451976 Free PMC article.
Cited by
-
Engineering in vitro immune-competent tissue models for testing and evaluation of therapeutics.Adv Drug Deliv Rev. 2022 Mar;182:114111. doi: 10.1016/j.addr.2022.114111. Epub 2022 Jan 11. Adv Drug Deliv Rev. 2022. PMID: 35031388 Free PMC article. Review.
-
Acid-base Homeostasis and Implications to the Phenotypic Behaviors of Cancer.Genomics Proteomics Bioinformatics. 2023 Dec;21(6):1133-1148. doi: 10.1016/j.gpb.2022.06.003. Epub 2022 Jul 1. Genomics Proteomics Bioinformatics. 2023. PMID: 35787947 Free PMC article.
-
23Na-MRI for Breast Cancer Diagnosis and Treatment Monitoring: A Scoping Review.Bioengineering (Basel). 2025 Feb 6;12(2):158. doi: 10.3390/bioengineering12020158. Bioengineering (Basel). 2025. PMID: 40001678 Free PMC article. Review.
-
23Na MRI: inter-reader reproducibility of normal fibroglandular sodium concentration measurements at 3 T.Eur Radiol Exp. 2024 Jun 10;8(1):75. doi: 10.1186/s41747-024-00465-x. Eur Radiol Exp. 2024. PMID: 38853182 Free PMC article.
-
The modulatory effect of high salt on immune cells and related diseases.Cell Prolif. 2022 Sep;55(9):e13250. doi: 10.1111/cpr.13250. Epub 2022 Jun 23. Cell Prolif. 2022. PMID: 35747936 Free PMC article. Review.
References
-
- Shahid H, Wiedenhoefer JF, Dornbluth C, Otto P, Kist KA. An overview of breast MRI. Appl. Radiol. 2016;45:7.
Publication types
MeSH terms
Substances
Grants and funding
LinkOut - more resources
Full Text Sources
Other Literature Sources
Medical
