

Meta-analysis of grey matter changes and their behavioral characterization in patients with alcohol use disorder
- PMID: 33664372
- PMCID: PMC7933165
- DOI: 10.1038/s41598-021-84804-7
Meta-analysis of grey matter changes and their behavioral characterization in patients with alcohol use disorder
Abstract
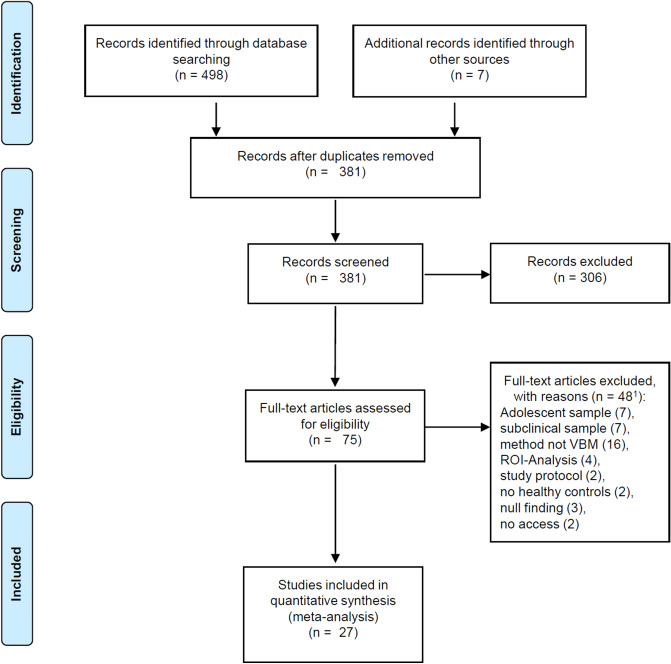
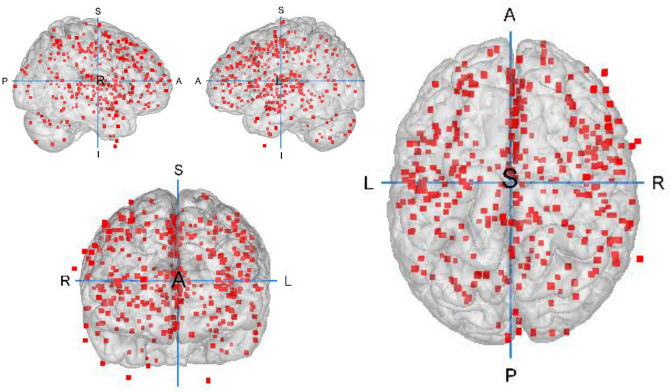
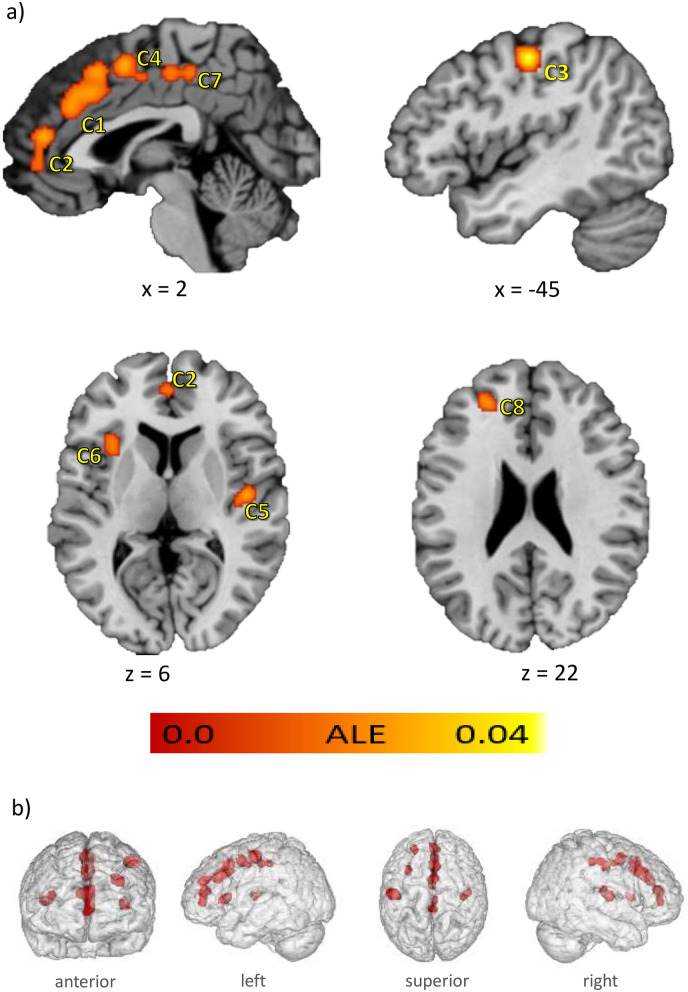
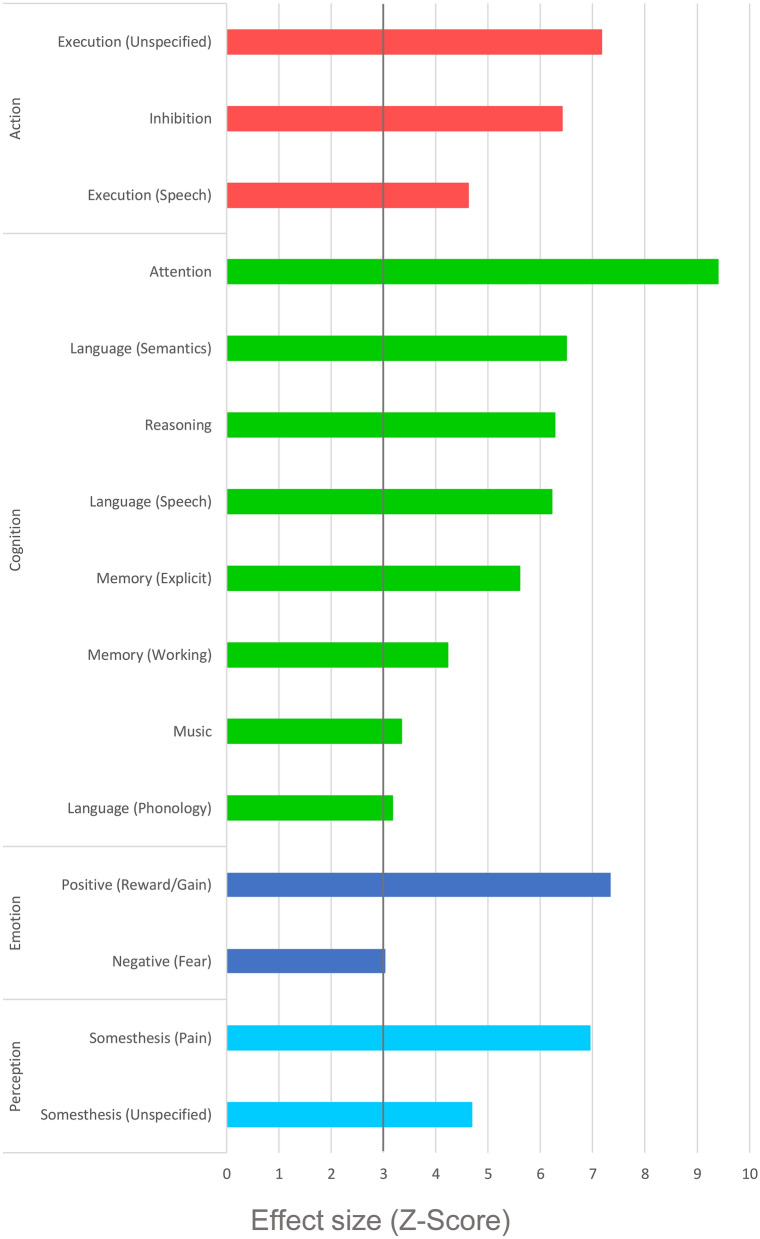
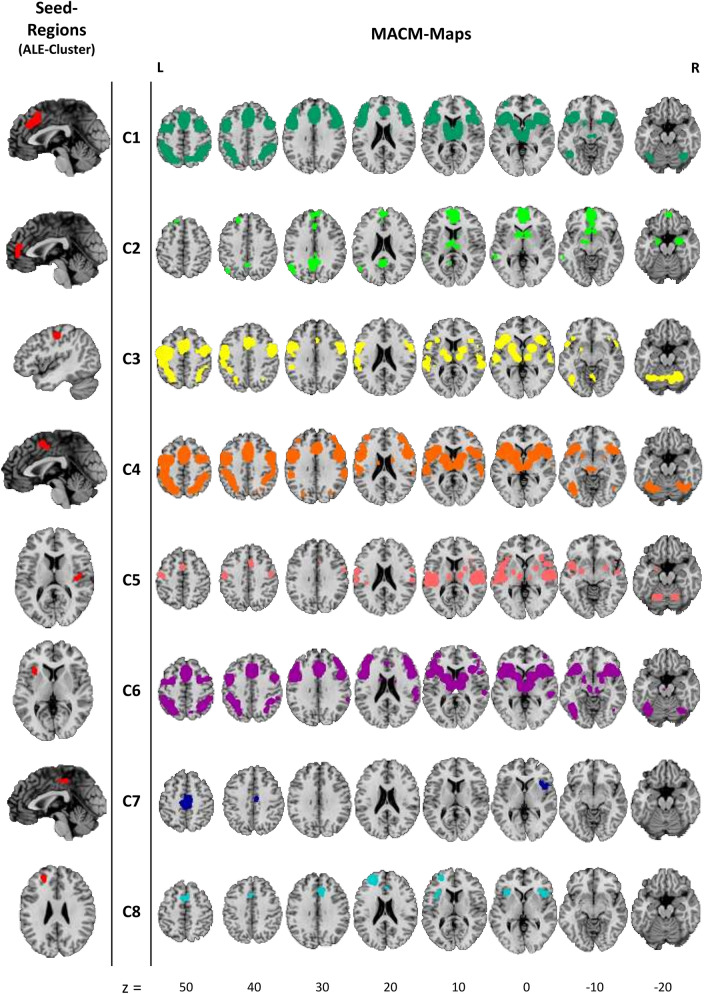
Alcohol Use Disorder (AUD) is associated with reductions in grey matter (GM) volume which can lead to changes in numerous brain functions. The results of previous studies on altered GM in AUD differ considerably in the regions identified. Three meta-analyses carried out between 2014 and 2017 yielded different results. The present study includes the considerable amount of newer research and delivers a state-of-the art meta-analysis in line with recently published guidelines. Additionally, we behaviorally characterized affected regions using fMRI metadata and identified related brain networks by determining their meta-analytic connectivity patterns. Twenty-seven studies with 1,045 AUD patients and 1,054 healthy controls were included in the analysis and analyzed by means of Anatomical Likelihood Estimation (ALE). GM alterations were identified in eight clusters covering different parts of the cingulate and medial frontal gyri, paracentral lobes, left post- and precentral gyri, left anterior and right posterior insulae and left superior frontal gyrus. The behavioral characterization associated these regions with specific cognitive, emotional, somatosensory and motor functions. Moreover, the clusters represent nodes within behaviorally relevant brain networks. Our results suggest that GM reduction in AUD could disrupt network communication responsible for the neurocognitive impairments associated with high chronic alcohol consumption.
Conflict of interest statement
The authors declare no competing interests.
Figures
Similar articles
-
Lower regional grey matter in alcohol use disorders: evidence from a voxel-based meta-analysis.BMC Psychiatry. 2021 May 11;21(1):247. doi: 10.1186/s12888-021-03244-9. BMC Psychiatry. 2021. PMID: 33975595 Free PMC article.
-
Where alcohol use disorder meets interoception: A meta-analytic view on structural and functional neuroimaging data.J Neurochem. 2024 Sep;168(9):2515-2531. doi: 10.1111/jnc.16104. Epub 2024 Mar 25. J Neurochem. 2024. PMID: 38528368
-
Voxel-based morphometry meta-analysis of gray and white matter finds significant areas of differences in bipolar patients from healthy controls.Bipolar Disord. 2017 Mar;19(2):74-83. doi: 10.1111/bdi.12488. Epub 2017 Apr 26. Bipolar Disord. 2017. PMID: 28444949
-
Cortical and subcortical gray matter shrinkage in alcohol-use disorders: a voxel-based meta-analysis.Neurosci Biobehav Rev. 2016 Jul;66:92-103. doi: 10.1016/j.neubiorev.2016.03.034. Epub 2016 Apr 21. Neurosci Biobehav Rev. 2016. PMID: 27108216 Review.
-
Morphological and regional spontaneous functional aberrations in the brain associated with Crohn's disease: a systematic review and coordinate-based meta-analyses.Cereb Cortex. 2024 Apr 1;34(4):bhae116. doi: 10.1093/cercor/bhae116. Cereb Cortex. 2024. PMID: 38566507
Cited by
-
The Brain Salience Network at the Intersection of Pain and Substance use Disorders: Insights from Functional Neuroimaging Research.Curr Addict Rep. 2024;11(5):797-808. doi: 10.1007/s40429-024-00593-9. Epub 2024 Jul 29. Curr Addict Rep. 2024. PMID: 39156196 Free PMC article. Review.
-
Functional and Structural Alteration of Default Mode, Executive Control, and Salience Networks in Alcohol Use Disorder.Front Psychiatry. 2021 Oct 20;12:742228. doi: 10.3389/fpsyt.2021.742228. eCollection 2021. Front Psychiatry. 2021. PMID: 34744834 Free PMC article.
-
Brain structural magnetic resonance imaging predictors of brief intervention response in individuals with alcohol use disorder.Alcohol Alcohol. 2025 Mar 25;60(3):agaf009. doi: 10.1093/alcalc/agaf009. Alcohol Alcohol. 2025. PMID: 40151142 Free PMC article.
-
Neuroimaging Biomarkers in Addiction.medRxiv [Preprint]. 2024 Sep 3:2024.09.02.24312084. doi: 10.1101/2024.09.02.24312084. medRxiv. 2024. PMID: 39281741 Free PMC article. Preprint.
-
The effects of alcohol use severity and polygenic risk on gray matter volumes in young adults.medRxiv [Preprint]. 2025 Jan 20:2025.01.20.25320842. doi: 10.1101/2025.01.20.25320842. medRxiv. 2025. Update in: Front Psychiatry. 2025 May 13;16:1560053. doi: 10.3389/fpsyt.2025.1560053. PMID: 39974144 Free PMC article. Updated. Preprint.
References
Publication types
MeSH terms
LinkOut - more resources
Full Text Sources
Other Literature Sources
Medical
