

Origin and variability of statistical dependencies between peak, volume, and duration of rainfall-driven flood events
- PMID: 33664378
- PMCID: PMC7970848
- DOI: 10.1038/s41598-021-84664-1
Origin and variability of statistical dependencies between peak, volume, and duration of rainfall-driven flood events
Abstract
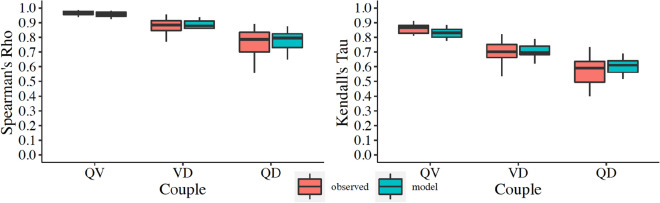
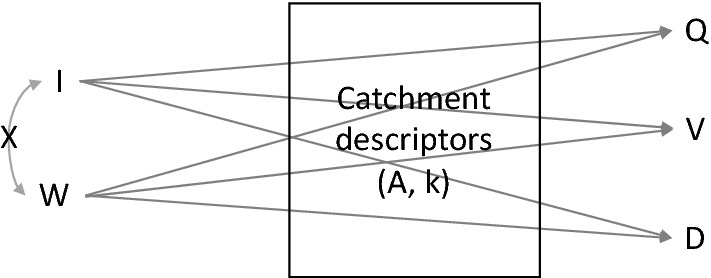
Floods are among the most common and impactful natural events. The hazard of a flood event depends on its peak (Q), volume (V) and duration (D), which are interconnected to each other. Here, we used a worldwide dataset of daily discharge, two statistics (Kendall's tau and Spearman's rho) and a conceptual hydrological rainfall-runoff model as model-dependent realism, to investigate the factors controlling and the origin of the dependence between each couple of flood characteristics, with the focus to rainfall-driven events. From the statistical analysis of worldwide dataset, we found that the catchment area is ineffective in controlling the dependence between Q and V, while the dependencies between Q and D, and V and D show an increasing behavior with the catchment area. From the modeling activity, on the U.S. subdataset, we obtained that the conceptual hydrological model is able to represent the observed dependencies between each couple of variables for rainfall-driven flood events, and for such events, the pairwise dependence of each couple is not causal, is of spurious kind, coming from the "Principle of Common Cause".
Conflict of interest statement
The authors declare no competing interests.
Figures

Similar articles
-
Measurement of flood peak effects as a result of soil and land management, with focus on experimental issues and scale.J Environ Manage. 2014 Jan;132:304-12. doi: 10.1016/j.jenvman.2013.11.027. Epub 2013 Dec 8. J Environ Manage. 2014. PMID: 24325823
-
Spatial dependence of floods shaped by extreme rainfall under the influence of urbanization.Sci Total Environ. 2023 Jan 20;857(Pt 1):159134. doi: 10.1016/j.scitotenv.2022.159134. Epub 2022 Sep 30. Sci Total Environ. 2023. PMID: 36183765
-
Exploration of severities of rainfall and runoff extremes in ungauged catchments: A case study of Lai Chi Wo in Hong Kong, China.Sci Total Environ. 2018 Sep 1;634:640-649. doi: 10.1016/j.scitotenv.2018.04.024. Epub 2018 Apr 7. Sci Total Environ. 2018. PMID: 29635206
-
Temporal variability of nitrate transport through hydrological response during flood events within a large agricultural catchment in south-west France.Sci Total Environ. 2010 Dec 1;409(1):140-9. doi: 10.1016/j.scitotenv.2010.09.006. Epub 2010 Oct 15. Sci Total Environ. 2010. PMID: 20951409
-
A real-time hourly water index for flood risk monitoring: Pilot studies in Brisbane, Australia, and Dobong Observatory, South Korea.Environ Monit Assess. 2018 Jul 4;190(8):450. doi: 10.1007/s10661-018-6806-0. Environ Monit Assess. 2018. PMID: 29974256
Cited by
-
A copula-based multivariate flood frequency analysis under climate change effects.Sci Rep. 2025 Jan 2;15(1):146. doi: 10.1038/s41598-024-84543-5. Sci Rep. 2025. PMID: 39748023 Free PMC article.
References
-
- Flores-Montoya I, Sordo-Ward Á, Mediero L, Garrote L. Fully stochastic distributed methodology for multivariate flood frequency analysis. Water. 2016;8:1–20. doi: 10.3390/w8060225. - DOI
-
- Pingping L, Bin H, Kaoru T, Xiong-Yin E, Daniel N, Weili D, Kensuke F. Historical assessment of Chinese and Japanese flood management policies and implications for managing future floods. Environ. Sci. Policy. 2015;48:265–277. doi: 10.1016/j.envsci.2014.12.015. - DOI
-
- Klein B, Pahlow M, Hundecha Y, Schumann A. Probability analysis of hydrological loads for the design of flood control systems using copulas. J. Hydrol. Eng. 2010;15:360–369. doi: 10.1061/(ASCE)HE.1943-5584.0000204. - DOI
-
- De Michele C, Salvadori G, Canossi M, Petaccia A, Rosso R. Bivariate statistical approach to check adequacy of dam spillway. J. Hydrol. Eng. 2005;10:50–57. doi: 10.1061/(ASCE)1084-0699(2005)10:1(50). - DOI
-
- Wagener T, Sivapalan M, Troch P, Woods R. Catchment classification and hydrologic similarity. Geogr. Compass. 2007;1:901–931. doi: 10.1111/j.1749-8198.2007.00039.x. - DOI
LinkOut - more resources
Full Text Sources
Other Literature Sources
