

Effect of captopril on post-infarction remodelling visualized by light sheet microscopy and echocardiography
- PMID: 33664407
- PMCID: PMC7933438
- DOI: 10.1038/s41598-021-84812-7
Effect of captopril on post-infarction remodelling visualized by light sheet microscopy and echocardiography
Abstract
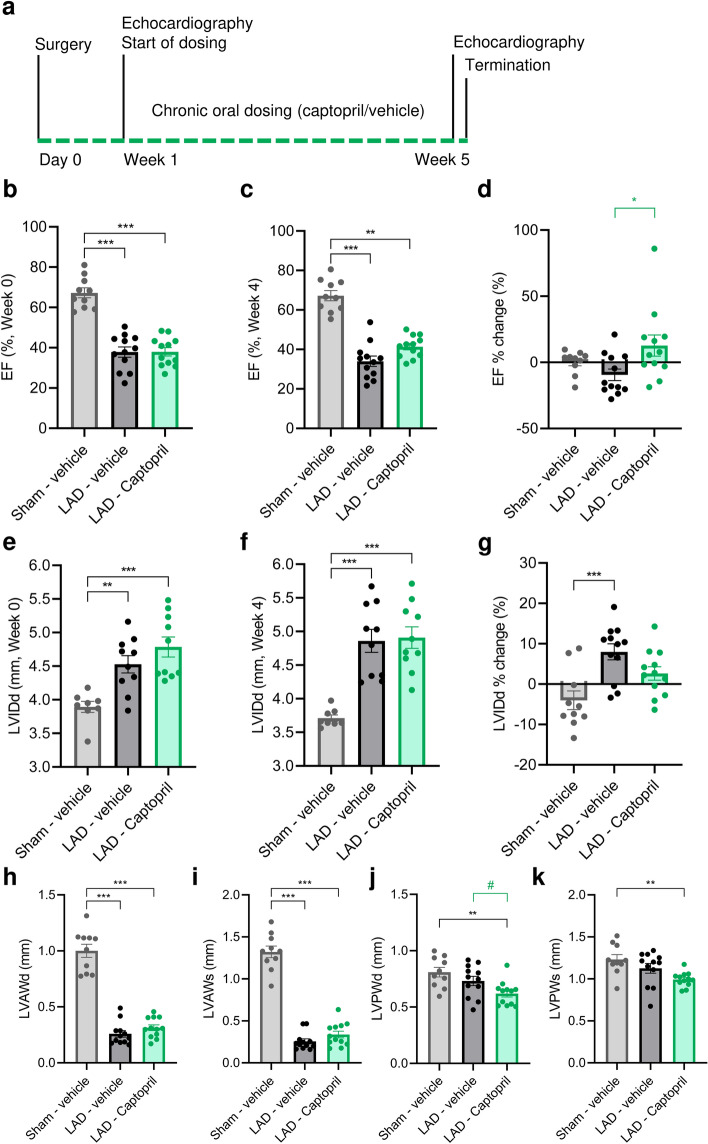
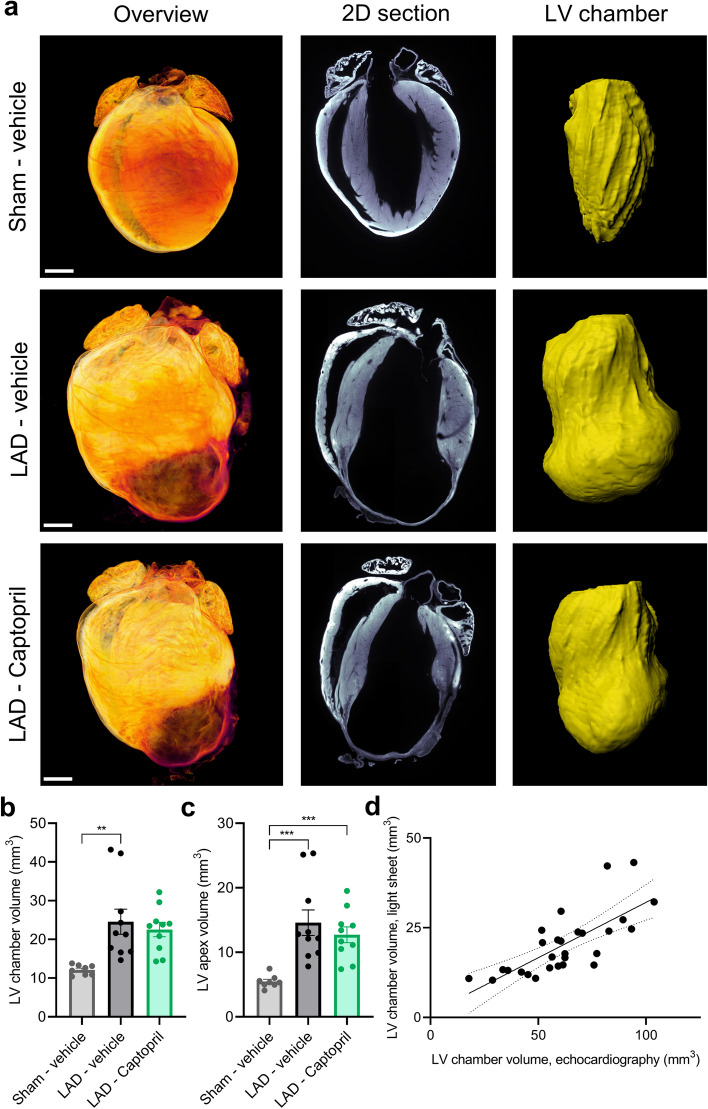
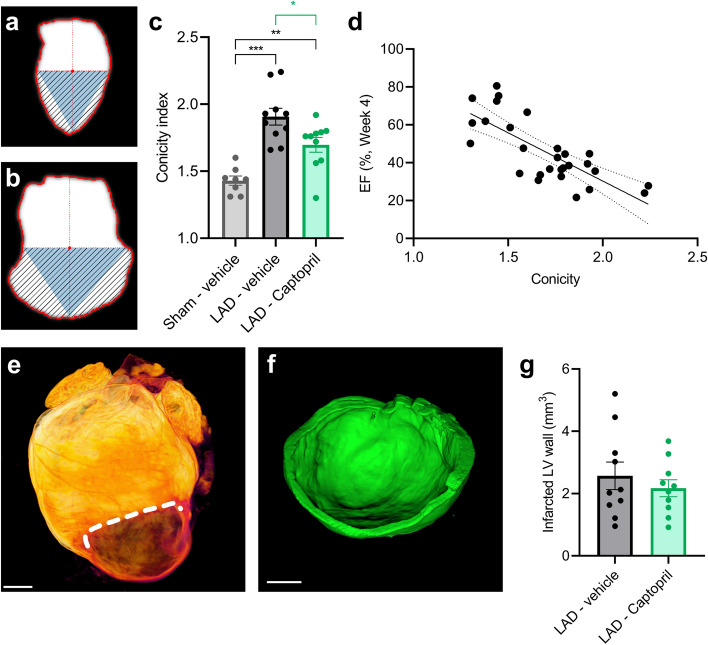
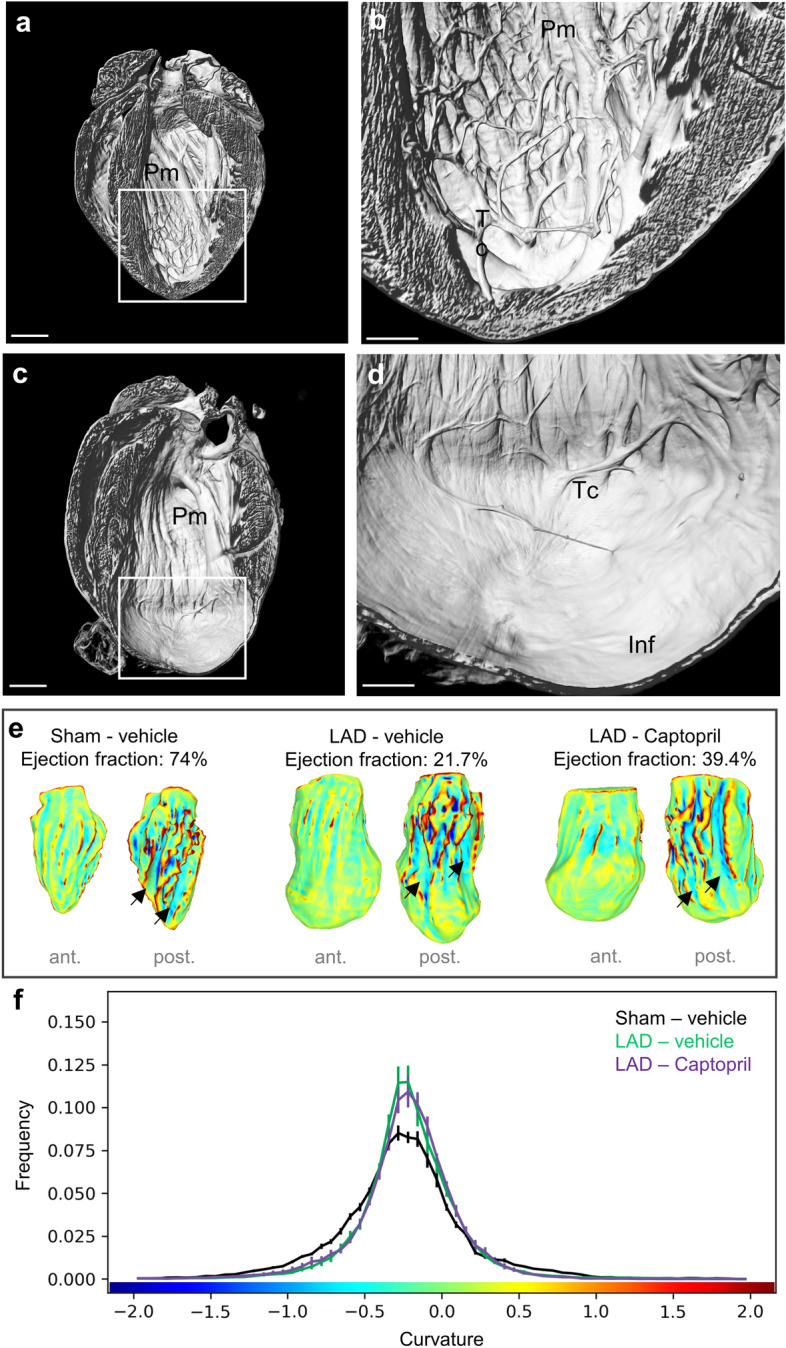
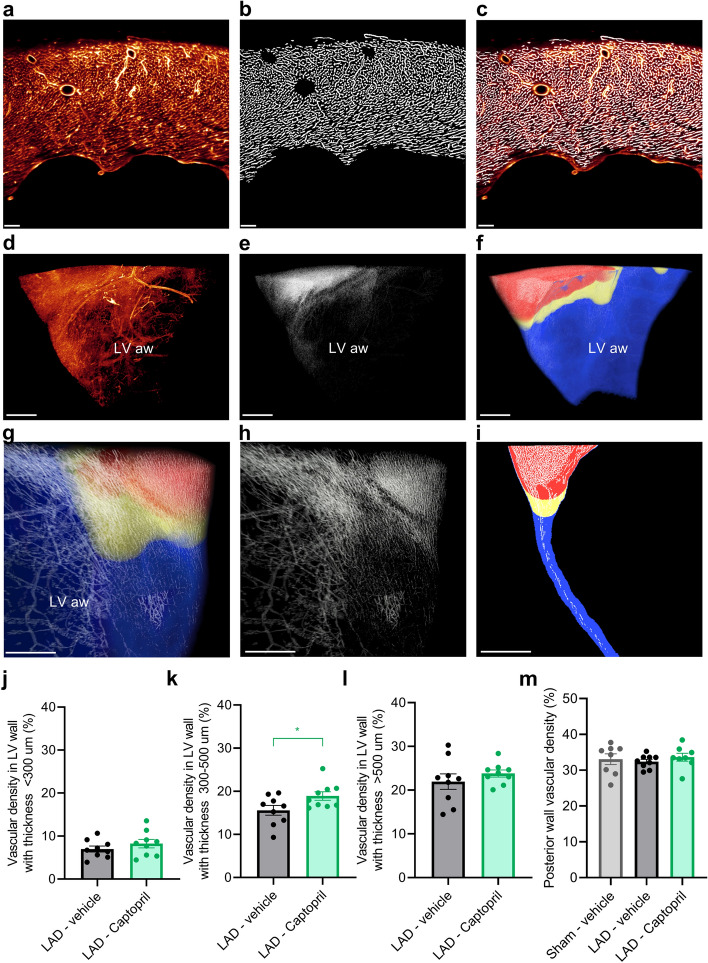
Angiotensin converting enzyme inhibitors, among them captopril, improve survival following myocardial infarction (MI). The mechanisms of captopril action remain inadequately understood due to its diverse effects on multiple signalling pathways at different time periods following MI. Here we aimed to establish the role of captopril in late-stage post-MI remodelling. Left anterior descending artery (LAD) ligation or sham surgery was carried out in male C57BL/6J mice. Seven days post-surgery LAD ligated mice were allocated to daily vehicle or captopril treatment continued over four weeks. To provide comprehensive characterization of the changes in mouse heart following MI a 3D light sheet imaging method was established together with automated image analysis workflow. The combination of echocardiography and light sheet imaging enabled to assess cardiac function and the underlying morphological changes. We show that delayed captopril treatment does not affect infarct size but prevents left ventricle dilation and hypertrophy, resulting in improved ejection fraction. Quantification of lectin perfused blood vessels showed improved vascular density in the infarct border zone in captopril treated mice in comparison to vehicle dosed control mice. These results validate the applicability of combined echocardiographic and light sheet assessment of drug mode of action in preclinical cardiovascular research.
Conflict of interest statement
U.R., L.T., J.L.S., C.G.S, P.J.P, J.H.S., H.B.H. and N.E.Z. are employees of Gubra. N.V. and J.J. are owners of Gubra. J.G.M. and R.M.C. are employees of Eli Lilly. B.R. is employee of Novo Nordisk.
Figures
Similar articles
-
Changes in ventricular size and function in patients treated with valsartan, captopril, or both after myocardial infarction.Circulation. 2005 Jun 28;111(25):3411-9. doi: 10.1161/CIRCULATIONAHA.104.508093. Epub 2005 Jun 20. Circulation. 2005. PMID: 15967846 Clinical Trial.
-
Effect of angiotensin-converting enzyme inhibition on infarct collagen deposition and remodelling during healing after transmural canine myocardial infarction.Can J Cardiol. 1997 Jul;13(7):657-68. Can J Cardiol. 1997. PMID: 9251578
-
Effects of angiotensin converting enzyme inhibition on cardiac innervation and ventricular arrhythmias after myocardial infarction.Clin Invest Med. 2008;31(4):E198-205. doi: 10.25011/cim.v31i4.4780. Clin Invest Med. 2008. PMID: 18682043
-
Captopril. A review of its pharmacology and therapeutic efficacy after myocardial infarction and in ischaemic heart disease.Drugs Aging. 1995 Sep;7(3):226-53. doi: 10.2165/00002512-199507030-00007. Drugs Aging. 1995. PMID: 8535052 Review.
-
Effect of angiotensin-converting enzyme inhibitors on ventricular remodeling and survival following myocardial infarction.Ann Pharmacother. 1993 Jun;27(6):755-66. doi: 10.1177/106002809302700617. Ann Pharmacother. 1993. PMID: 8329800 Review.
Cited by
-
Dach1 Extends Artery Networks and Protects Against Cardiac Injury.Circ Res. 2021 Sep 17;129(7):702-716. doi: 10.1161/CIRCRESAHA.120.318271. Epub 2021 Aug 12. Circ Res. 2021. PMID: 34383559 Free PMC article.
-
In Vitro Models of Cardiovascular Disease: Embryoid Bodies, Organoids and Everything in Between.Biomedicines. 2024 Nov 27;12(12):2714. doi: 10.3390/biomedicines12122714. Biomedicines. 2024. PMID: 39767621 Free PMC article. Review.
-
Oxidation-reduction imaging of myoglobin reveals two-phase oxidation in the reperfused myocardium.Basic Res Cardiol. 2024 Jun;119(3):435-451. doi: 10.1007/s00395-024-01040-6. Epub 2024 Mar 18. Basic Res Cardiol. 2024. PMID: 38499702 Free PMC article.
-
Cardioprotective Role of Captopril: From Basic to Applied Investigations.Int J Mol Sci. 2025 Jul 25;26(15):7215. doi: 10.3390/ijms26157215. Int J Mol Sci. 2025. PMID: 40806350 Free PMC article. Review.
-
CXCL12 drives natural variation in coronary artery anatomy across diverse populations.medRxiv [Preprint]. 2024 Jul 5:2023.10.27.23297507. doi: 10.1101/2023.10.27.23297507. medRxiv. 2024. Update in: Cell. 2025 Apr 03;188(7):1784-1806.e22. doi: 10.1016/j.cell.2025.02.005. PMID: 37961706 Free PMC article. Updated. Preprint.
References
MeSH terms
Substances
LinkOut - more resources
Full Text Sources
Other Literature Sources
Medical
