

Prolonged cetuximab treatment promotes p27Kip1-mediated G1 arrest and autophagy in head and neck squamous cell carcinoma
- PMID: 33664437
- PMCID: PMC7933308
- DOI: 10.1038/s41598-021-84877-4
Prolonged cetuximab treatment promotes p27Kip1-mediated G1 arrest and autophagy in head and neck squamous cell carcinoma
Abstract
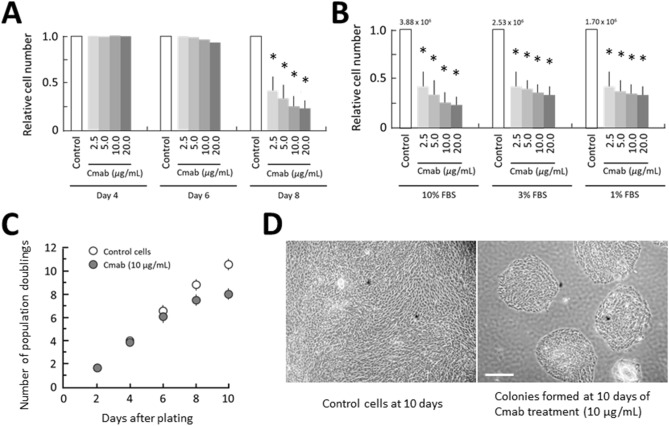
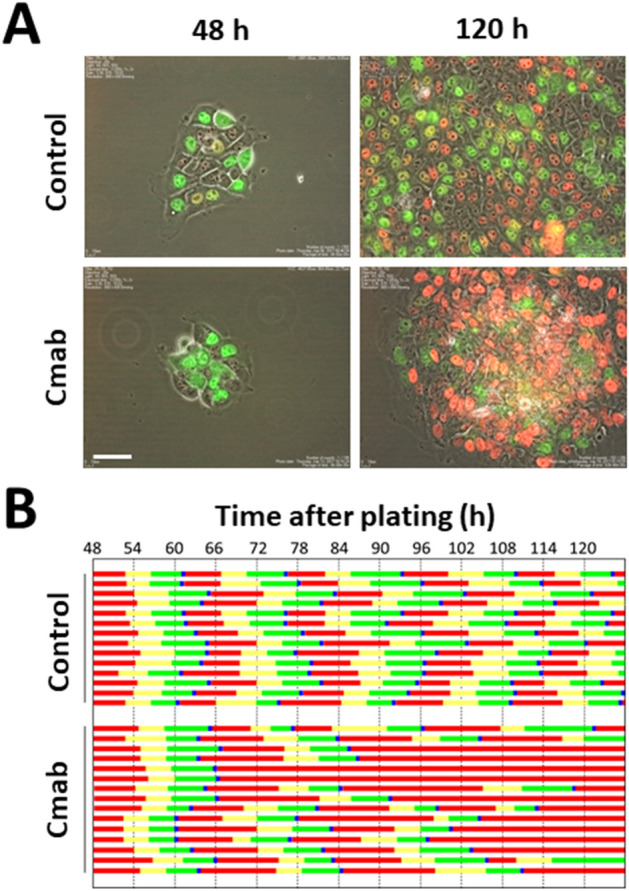
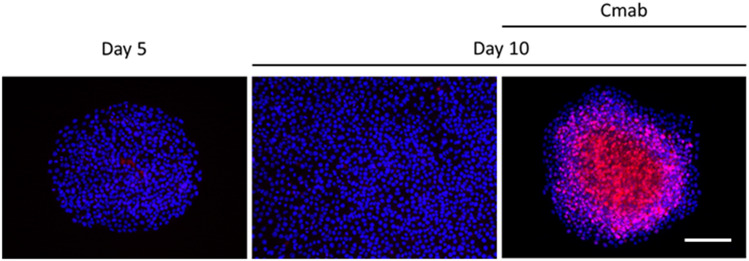
Cetuximab, an anti-epidermal growth factor receptor (EGFR) monoclonal antibody, is an efficient anti-tumor therapeutic agent that inhibits the activation of EGFR; however, data related to the cellular effects of prolonged cetuximab treatment are limited. In this study, the long-term cellular outcome of prolonged cetuximab treatment and the related molecular mechanism were explored in a head and neck squamous cell carcinoma cell line constitutively expressing a fluorescent ubiquitination-based cell cycle indicator. Fluorescent time-lapse imaging was used to assess clonal growth, cell motility, and cell-cycle progression. Western blot analysis was performed to measure the level of phosphorylation and protein-expression following cetuximab treatment. Over 5 days cetuximab treatment decreased cell motility and enhanced G1 phase cell arrest in the central region of the colonies. Significantly decreased phosphorylation of retinoblastoma, Skp2, and Akt-mTOR proteins, accumulation of p27Kip1, and induction of type II LC3B were observed over 8 days cetuximab treatment. Results of the present study elucidate the cetuximab-dependent inhibition of cell migration, resulting in high cell density-related stress and persistent cell-cycle arrest at G1 phase culminating in autophagy. These findings provide novel molecular insights related to the anti-tumor effects of prolonged cetuximab treatment with the potential to improve future therapeutic strategy.
Conflict of interest statement
The authors declare no competing interests.
Figures


Similar articles
-
Nicotine promotes lymph node metastasis and cetuximab resistance in head and neck squamous cell carcinoma.Int J Oncol. 2019 Jan;54(1):283-294. doi: 10.3892/ijo.2018.4631. Epub 2018 Nov 12. Int J Oncol. 2019. PMID: 30431077
-
ABT-751 Induces Multiple Anticancer Effects in Urinary Bladder Urothelial Carcinoma-Derived Cells: Highlighting the Induction of Cytostasis through the Inhibition of SKP2 at Both Transcriptional and Post-Translational Levels.Int J Mol Sci. 2021 Jan 19;22(2):945. doi: 10.3390/ijms22020945. Int J Mol Sci. 2021. PMID: 33478005 Free PMC article.
-
Honokiol inhibits in vitro and in vivo growth of oral squamous cell carcinoma through induction of apoptosis, cell cycle arrest and autophagy.J Cell Mol Med. 2018 Mar;22(3):1894-1908. doi: 10.1111/jcmm.13474. Epub 2018 Jan 24. J Cell Mol Med. 2018. PMID: 29363886 Free PMC article.
-
Predictive Value of EGFR-PI3K-AKT-mTOR-Pathway Inhibitor Biomarkers for Head and Neck Squamous Cell Carcinoma: A Systematic Review.Mol Diagn Ther. 2021 Mar;25(2):123-136. doi: 10.1007/s40291-021-00518-6. Epub 2021 Mar 8. Mol Diagn Ther. 2021. PMID: 33686517 Free PMC article.
-
Molecular targeted therapies in the management of head and neck squamous cell carcinoma: recent developments and perspectives.Anticancer Agents Med Chem. 2013 Mar;13(3):389-402. Anticancer Agents Med Chem. 2013. PMID: 23092267 Review.
Cited by
-
D-arabinose induces cell cycle arrest by promoting autophagy via p38 MAPK signaling pathway in breast cancer.Sci Rep. 2024 May 16;14(1):11219. doi: 10.1038/s41598-024-61309-7. Sci Rep. 2024. PMID: 38755221 Free PMC article.
-
Procaine induces cell cycle arrest, apoptosis and autophagy through the inhibition of the PI3K/AKT and ERK pathways in human tongue squamous cell carcinoma.Oncol Lett. 2024 Jun 28;28(3):408. doi: 10.3892/ol.2024.14541. eCollection 2024 Sep. Oncol Lett. 2024. PMID: 38988444 Free PMC article.
-
Dyskerin Downregulation Can Induce ER Stress and Promote Autophagy via AKT-mTOR Signaling Deregulation.Biomedicines. 2022 May 8;10(5):1092. doi: 10.3390/biomedicines10051092. Biomedicines. 2022. PMID: 35625829 Free PMC article.
-
Exploring Dynamic Metabolome of the HepG2 Cell Line: Rise and Fall.Cells. 2022 Nov 10;11(22):3548. doi: 10.3390/cells11223548. Cells. 2022. PMID: 36428976 Free PMC article.
-
Dual inhibition of autophagy and PI3K/mTOR pathway as a potential therapeutic strategy against laryngeal squamous cell carcinoma.Transl Cancer Res. 2022 May;11(5):1076-1088. doi: 10.21037/tcr-21-2325. Transl Cancer Res. 2022. PMID: 35706786 Free PMC article.
References
MeSH terms
Substances
LinkOut - more resources
Full Text Sources
Other Literature Sources
Molecular Biology Databases
Research Materials
Miscellaneous
