

Clot waveform of APTT has abnormal patterns in subjects with COVID-19
- PMID: 33664450
- PMCID: PMC7933409
- DOI: 10.1038/s41598-021-84776-8
Clot waveform of APTT has abnormal patterns in subjects with COVID-19
Abstract
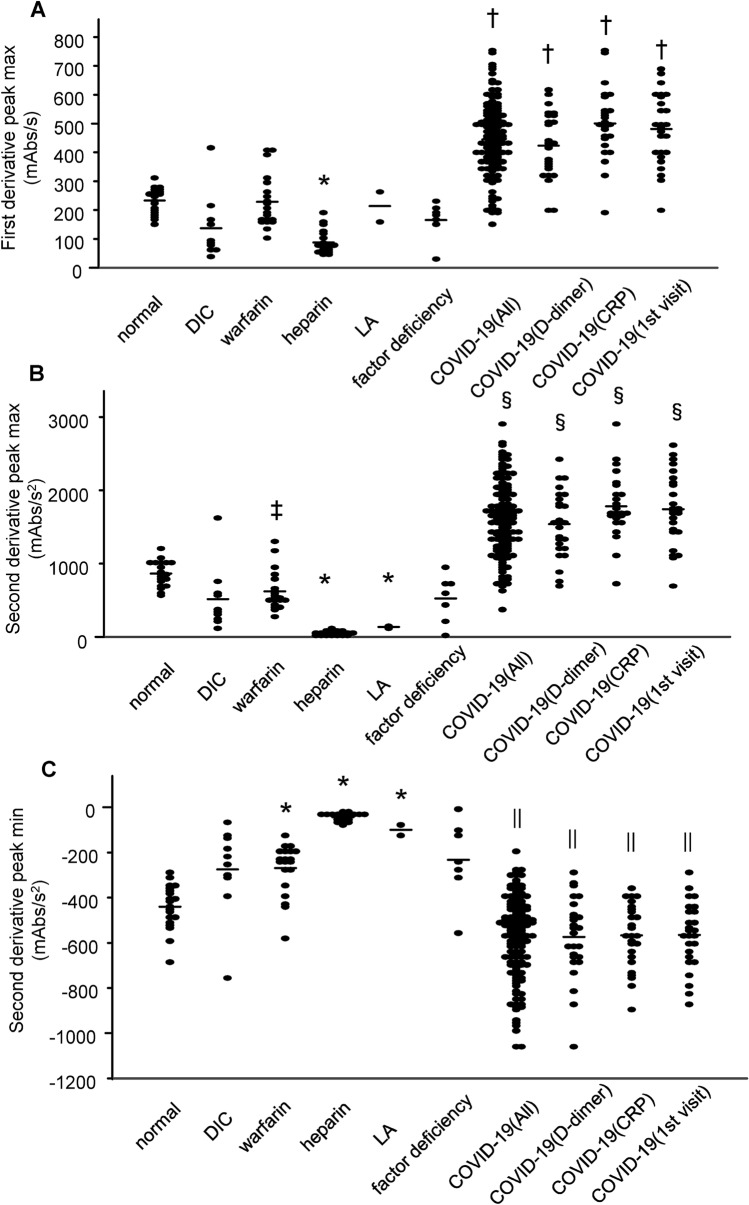
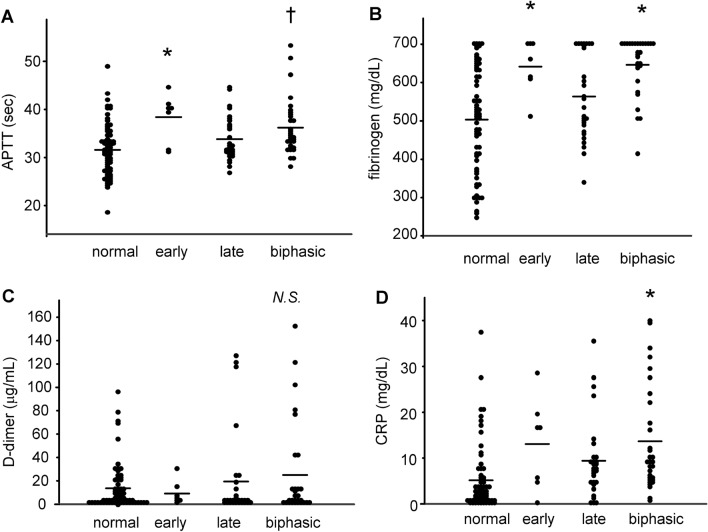
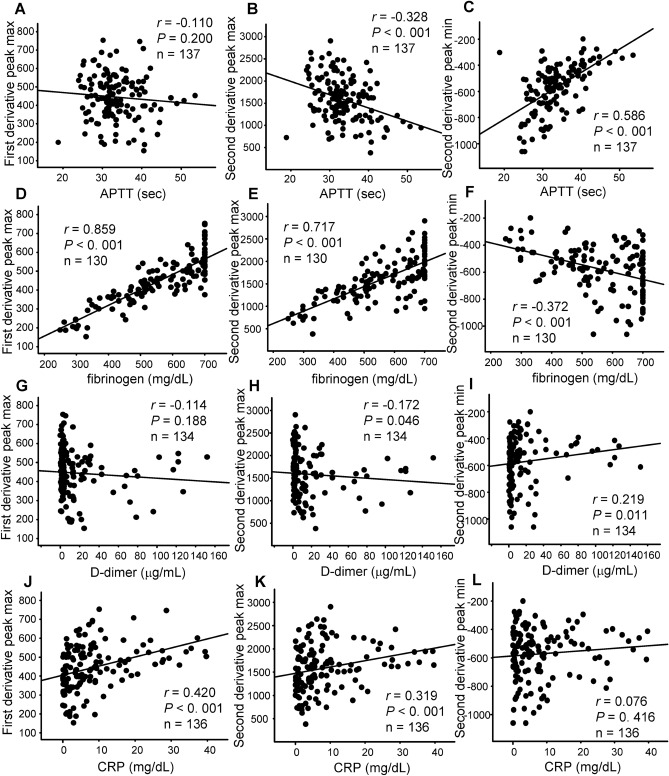
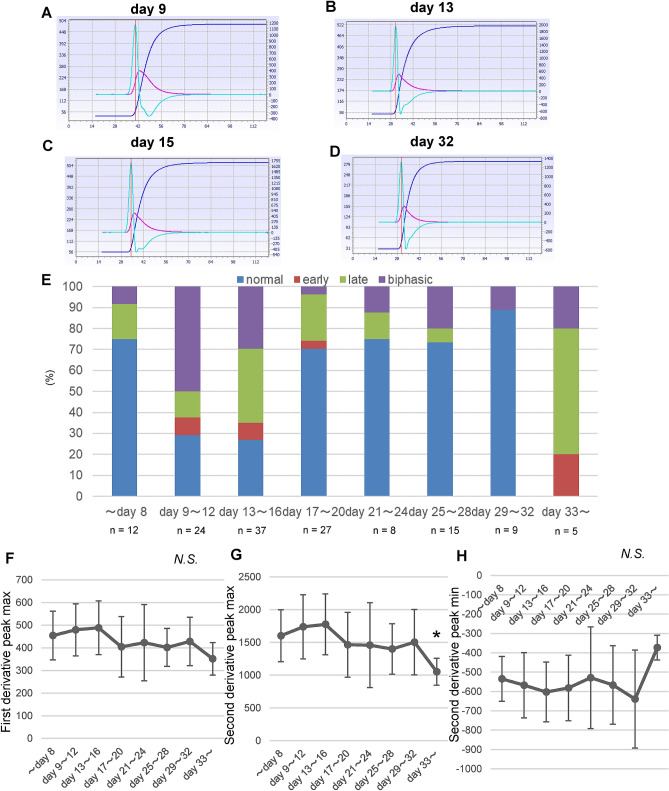
In Coronavirus disease 2019 (COVID-19) subjects, recent evidence suggests the presence of unique coagulation abnormalities. In this study, we performed clot waveform analyses to investigate whether specific modulations are observed in COVID-19 subjects. We analyzed the second derivative of the absorbance in routine APTT tests performed using an ACL-TOP system. We observed high frequencies of abnormal patterns in APTT second-derivative curves that could be classified into an early shoulder type, a late shoulder type, or a biphasic type, high maximum first-derivative and second-derivative peak levels, and a low minimum second-derivative peak level in COVID-19 subjects. These modulations were not observed in subjects with disseminated intravascular coagulation. These abnormal patterns are also observed in patients with lupus anticoagulant, hemophilia, or factor IX deficiency. The plasma fibrinogen levels might also be involved in the abnormal APTT waveforms, especially the high maximum first-derivative and second-derivative peak levels. The abnormal patterns in the APTT second-derivative curves appear with highest frequency at around 2 weeks after the onset of COVID-19 and were not associated with the severity of COVID-19. These results suggest the possible presence of a specific abnormal coagulopathy in COVID-19.
Conflict of interest statement
The authors declare no competing interests.
Figures

Similar articles
-
A study of atypical APTT derivative curves on the ACL TOP coagulation analyser.Int J Lab Hematol. 2011 Feb;33(1):67-78. doi: 10.1111/j.1751-553X.2010.01248.x. Int J Lab Hematol. 2011. PMID: 20649909
-
COVID-19 associated coagulopathy in critically ill patients: A hypercoagulable state demonstrated by parameters of haemostasis and clot waveform analysis.J Thromb Thrombolysis. 2021 Apr;51(3):663-674. doi: 10.1007/s11239-020-02318-x. Epub 2020 Oct 24. J Thromb Thrombolysis. 2021. PMID: 33098540 Free PMC article.
-
Update on the Clot Waveform Analysis.Clin Appl Thromb Hemost. 2020 Jan-Dec;26:1076029620912027. doi: 10.1177/1076029620912027. Clin Appl Thromb Hemost. 2020. PMID: 32862666 Free PMC article.
-
Coagulation Testing in the Core Laboratory.Lab Med. 2017 Nov 8;48(4):295-313. doi: 10.1093/labmed/lmx050. Lab Med. 2017. PMID: 29126301 Review.
-
Systemic Coagulopathy in Hospitalized Patients With Coronavirus Disease 2019: A Systematic Review and Meta-Analysis.Clin Appl Thromb Hemost. 2021 Jan-Dec;27:1076029620987629. doi: 10.1177/1076029620987629. Clin Appl Thromb Hemost. 2021. PMID: 33443456 Free PMC article.
Cited by
-
Differences in the Composition of Activated Partial Thromboplastin Time (APTT) Reagents Affect Clot Waveform Analysis.Yonago Acta Med. 2022 Aug 29;65(3):226-230. doi: 10.33160/yam.2022.08.013. eCollection 2022 Aug. Yonago Acta Med. 2022. PMID: 36061578 Free PMC article.
-
SARS-CoV-2 triggered oxidative stress and abnormal energy metabolism in gut microbiota.MedComm (2020). 2022 Jan 17;3(1):e112. doi: 10.1002/mco2.112. eCollection 2022 Mar. MedComm (2020). 2022. PMID: 35281785 Free PMC article.
-
Global haemostatic tests demonstrate the absence of parameters of hypercoagulability in non-hypoxic mild COVID-19 patients: a prospective matched study.J Thromb Thrombolysis. 2022 Apr;53(3):646-662. doi: 10.1007/s11239-021-02575-4. Epub 2021 Sep 28. J Thromb Thrombolysis. 2022. PMID: 34581945 Free PMC article.
-
Dynamic modulations of urinary sphingolipid and glycerophospholipid levels in COVID-19 and correlations with COVID-19-associated kidney injuries.J Biomed Sci. 2022 Nov 10;29(1):94. doi: 10.1186/s12929-022-00880-5. J Biomed Sci. 2022. PMID: 36357929 Free PMC article.
-
Urine sediment findings were milder in patients with COVID-19-associated renal injuries than in those with non-COVID-19-associated renal injuries.Int J Infect Dis. 2022 Apr;117:302-311. doi: 10.1016/j.ijid.2022.02.024. Epub 2022 Feb 17. Int J Infect Dis. 2022. PMID: 35182739 Free PMC article.
References
Publication types
MeSH terms
Substances
LinkOut - more resources
Full Text Sources
Other Literature Sources
Medical
