. 2021 Apr;40(13):2395-2406.
doi: 10.1038/s41388-021-01702-y. Epub 2021 Mar 4.

BCDIN3D RNA methyltransferase stimulates Aldolase C expression and glycolysis through let-7 microRNA in breast cancer cells

Affiliations

BCDIN3D RNA methyltransferase stimulates Aldolase C expression and glycolysis through let-7 microRNA in breast cancer cells

Calder W Reinsborough et al. Oncogene. 2021 Apr.

Abstract

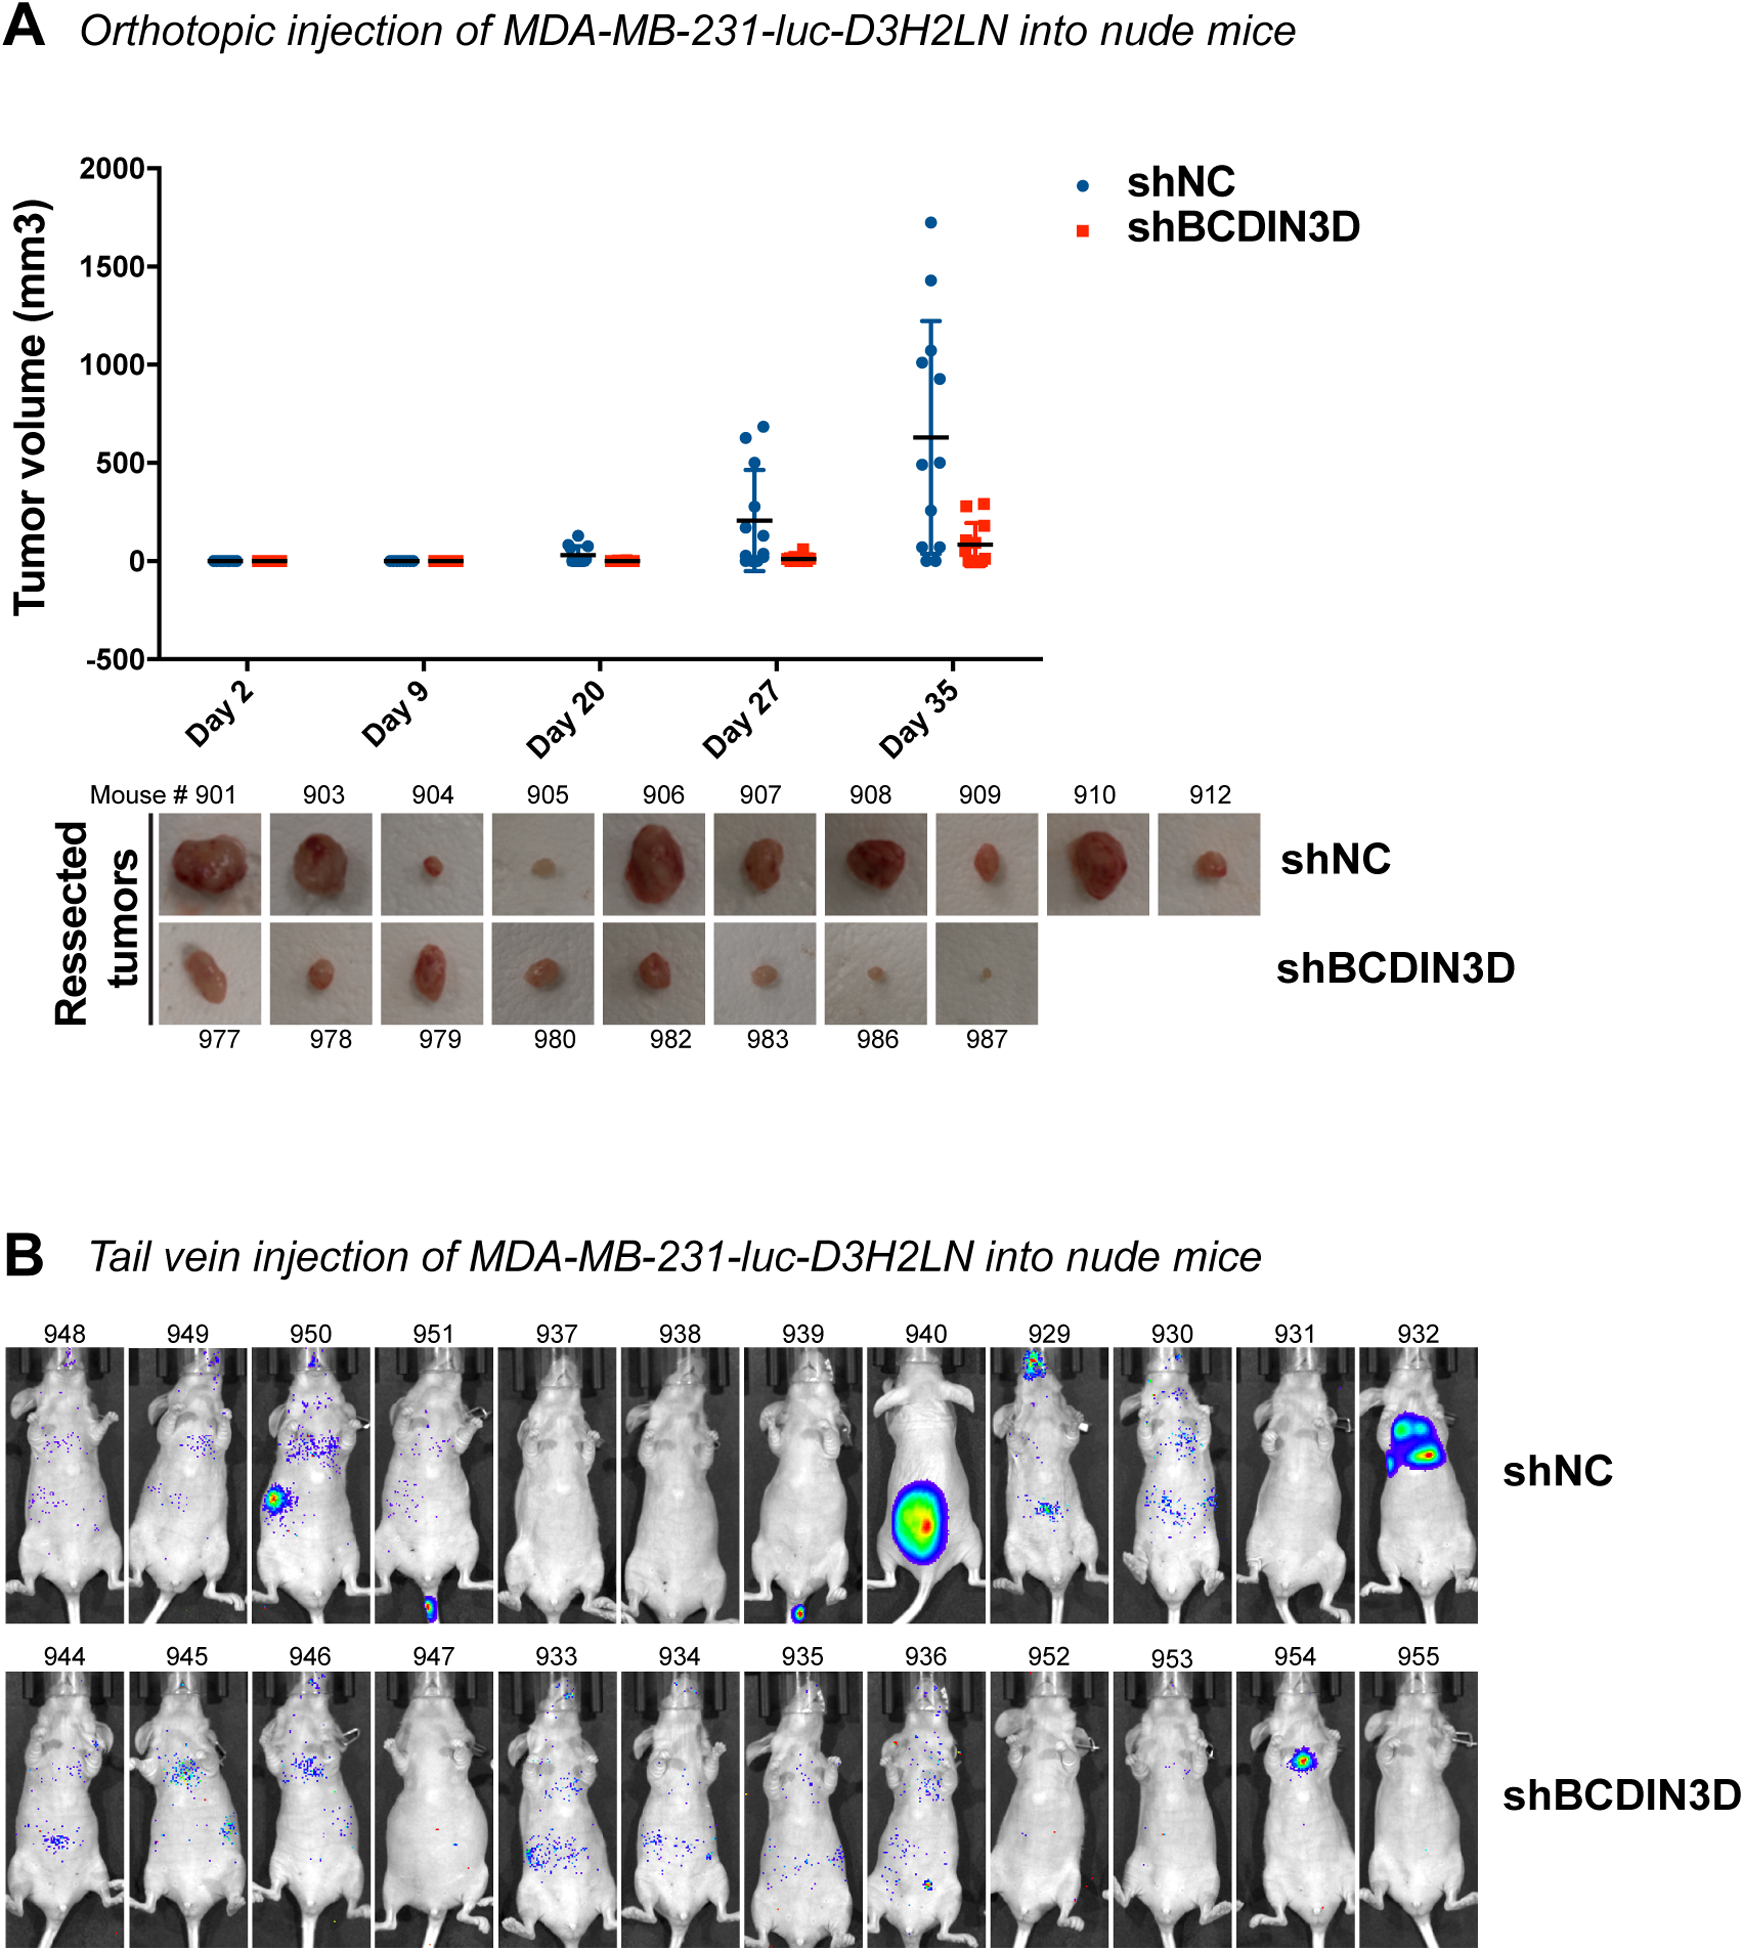
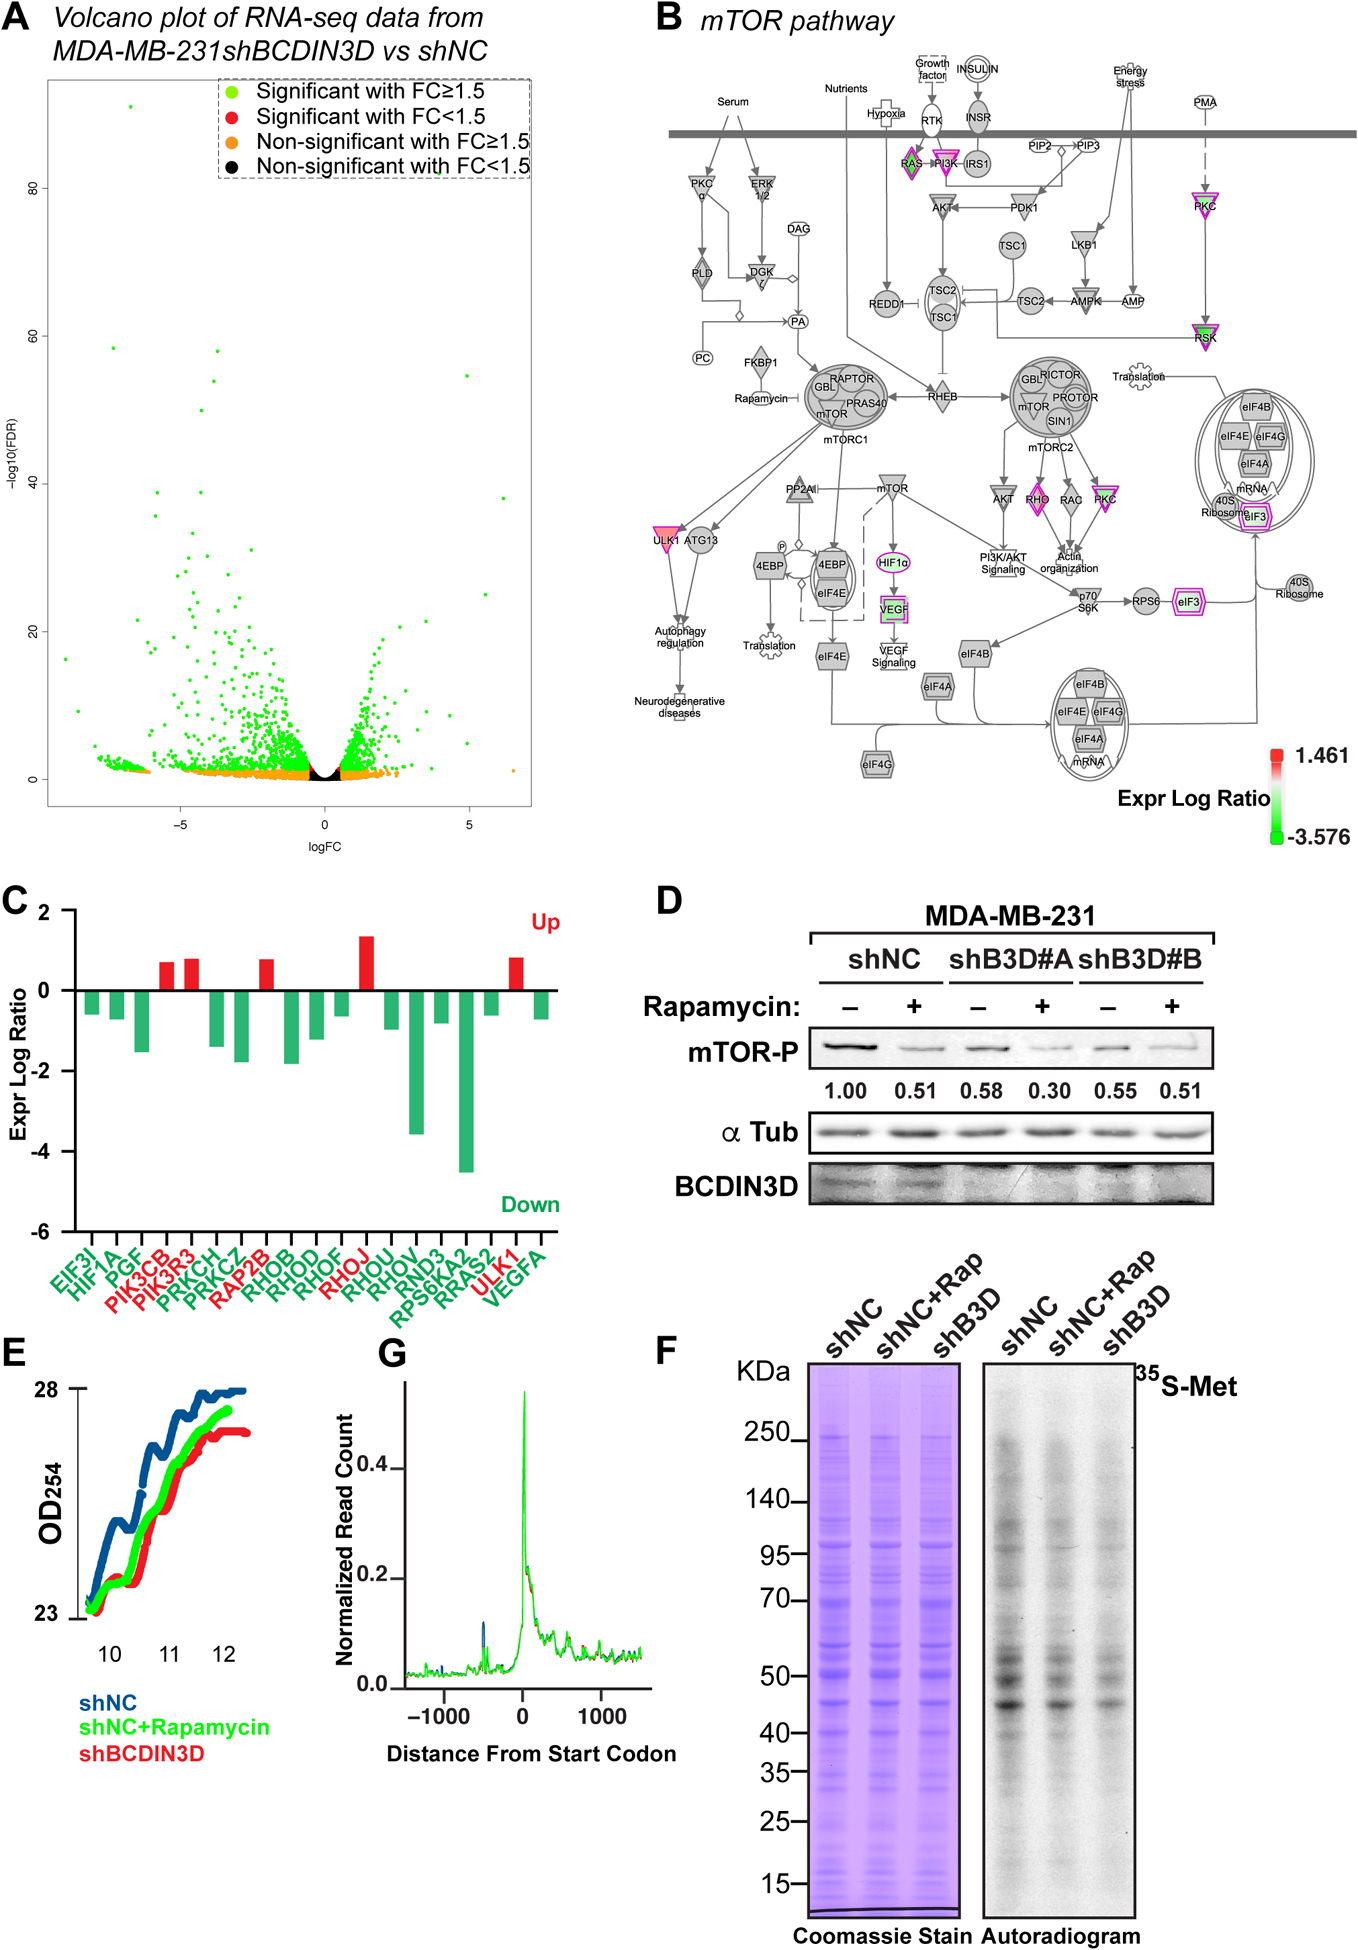
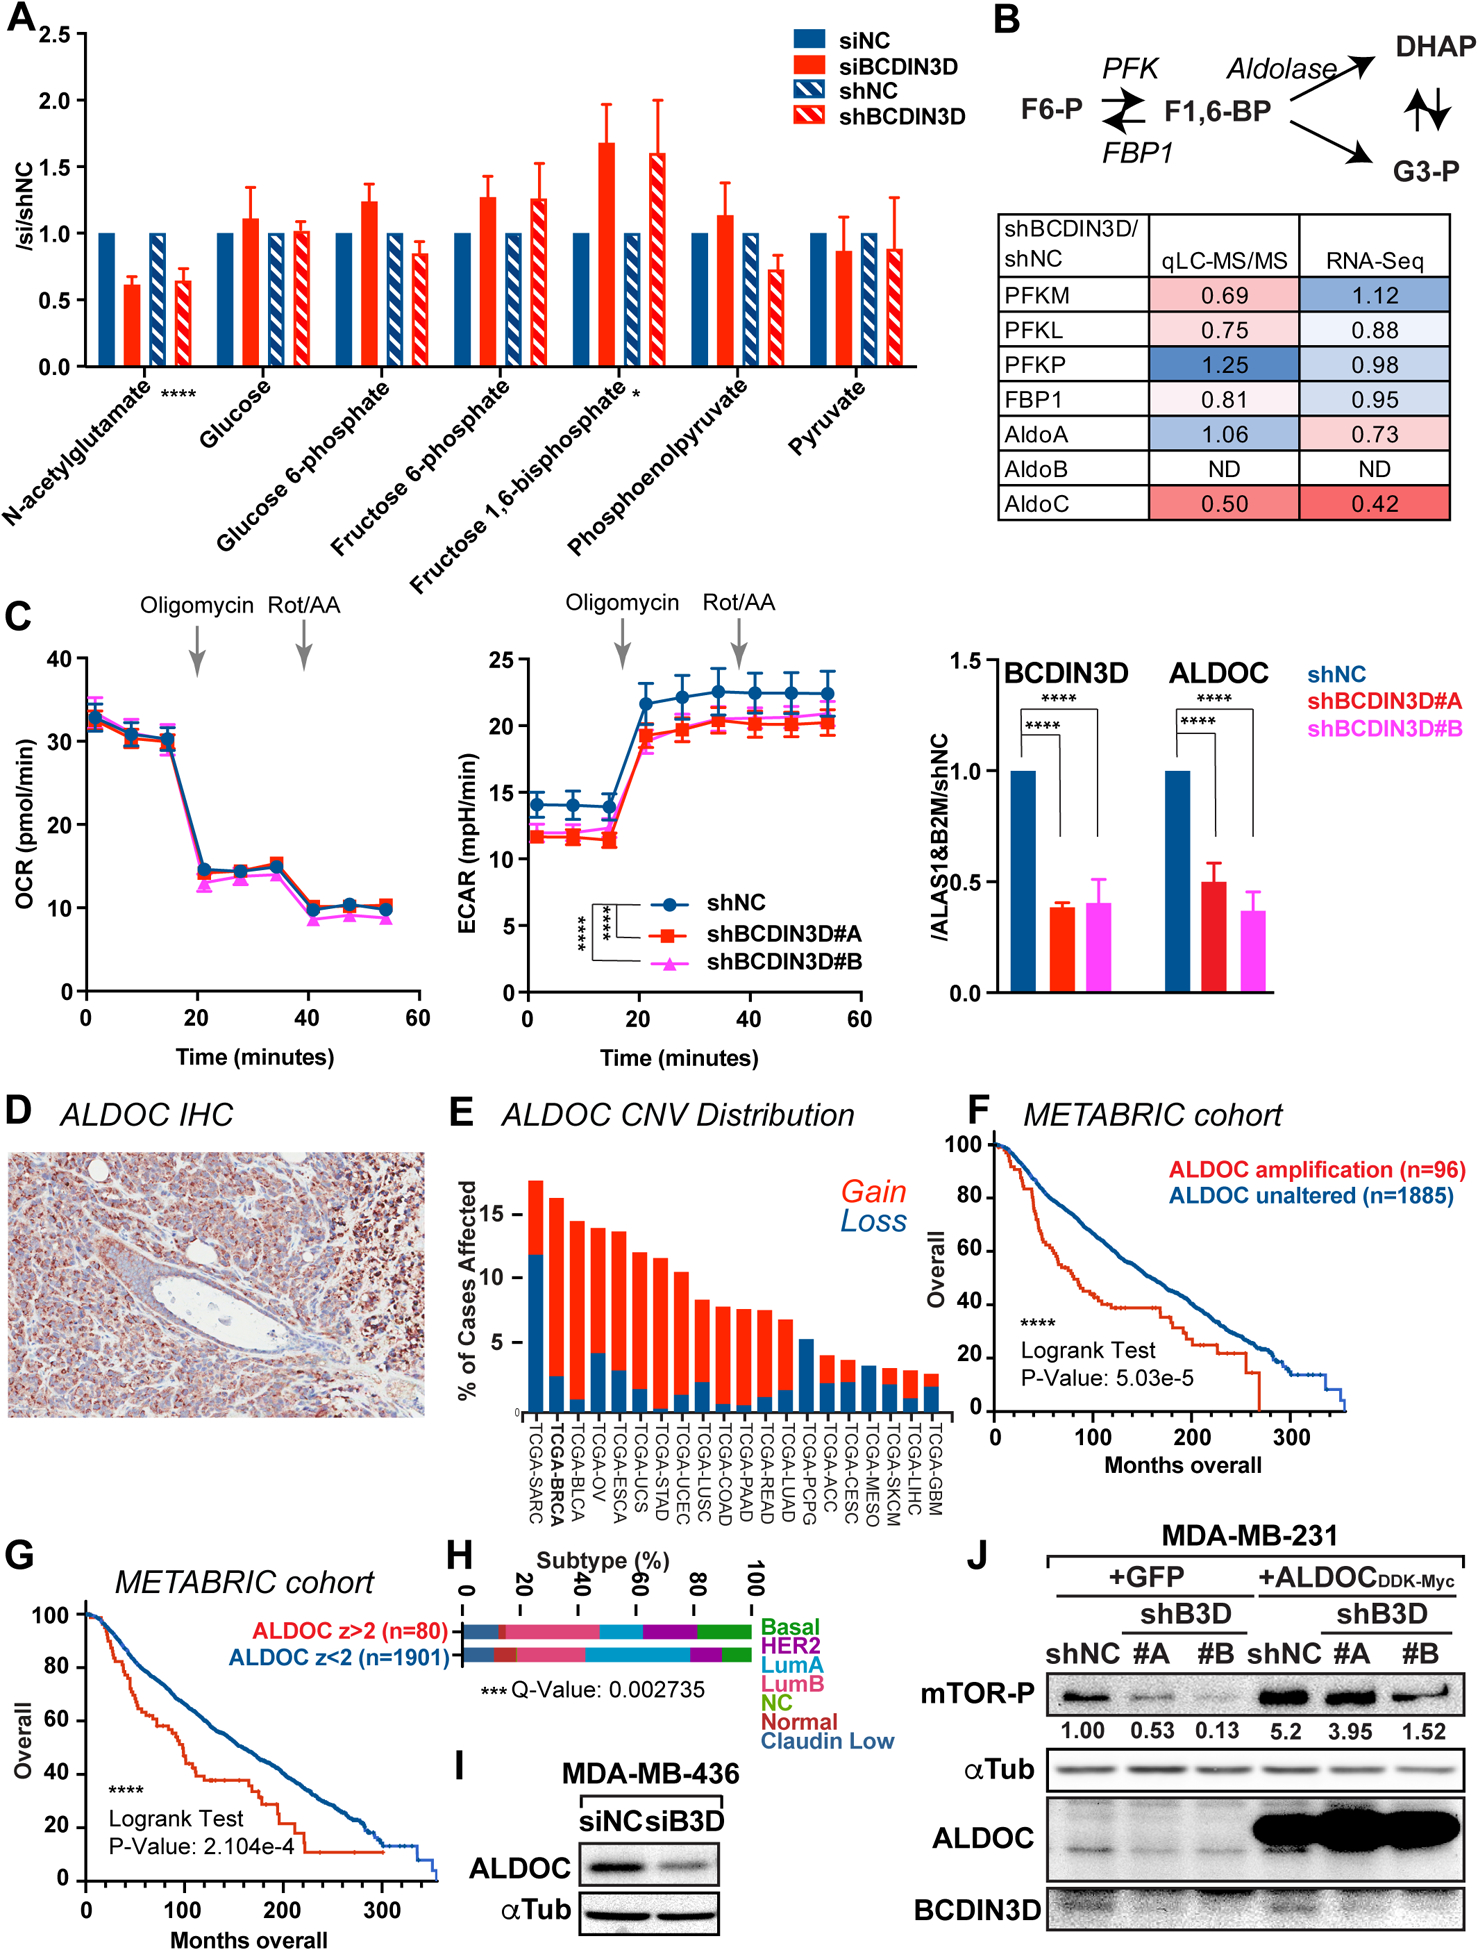
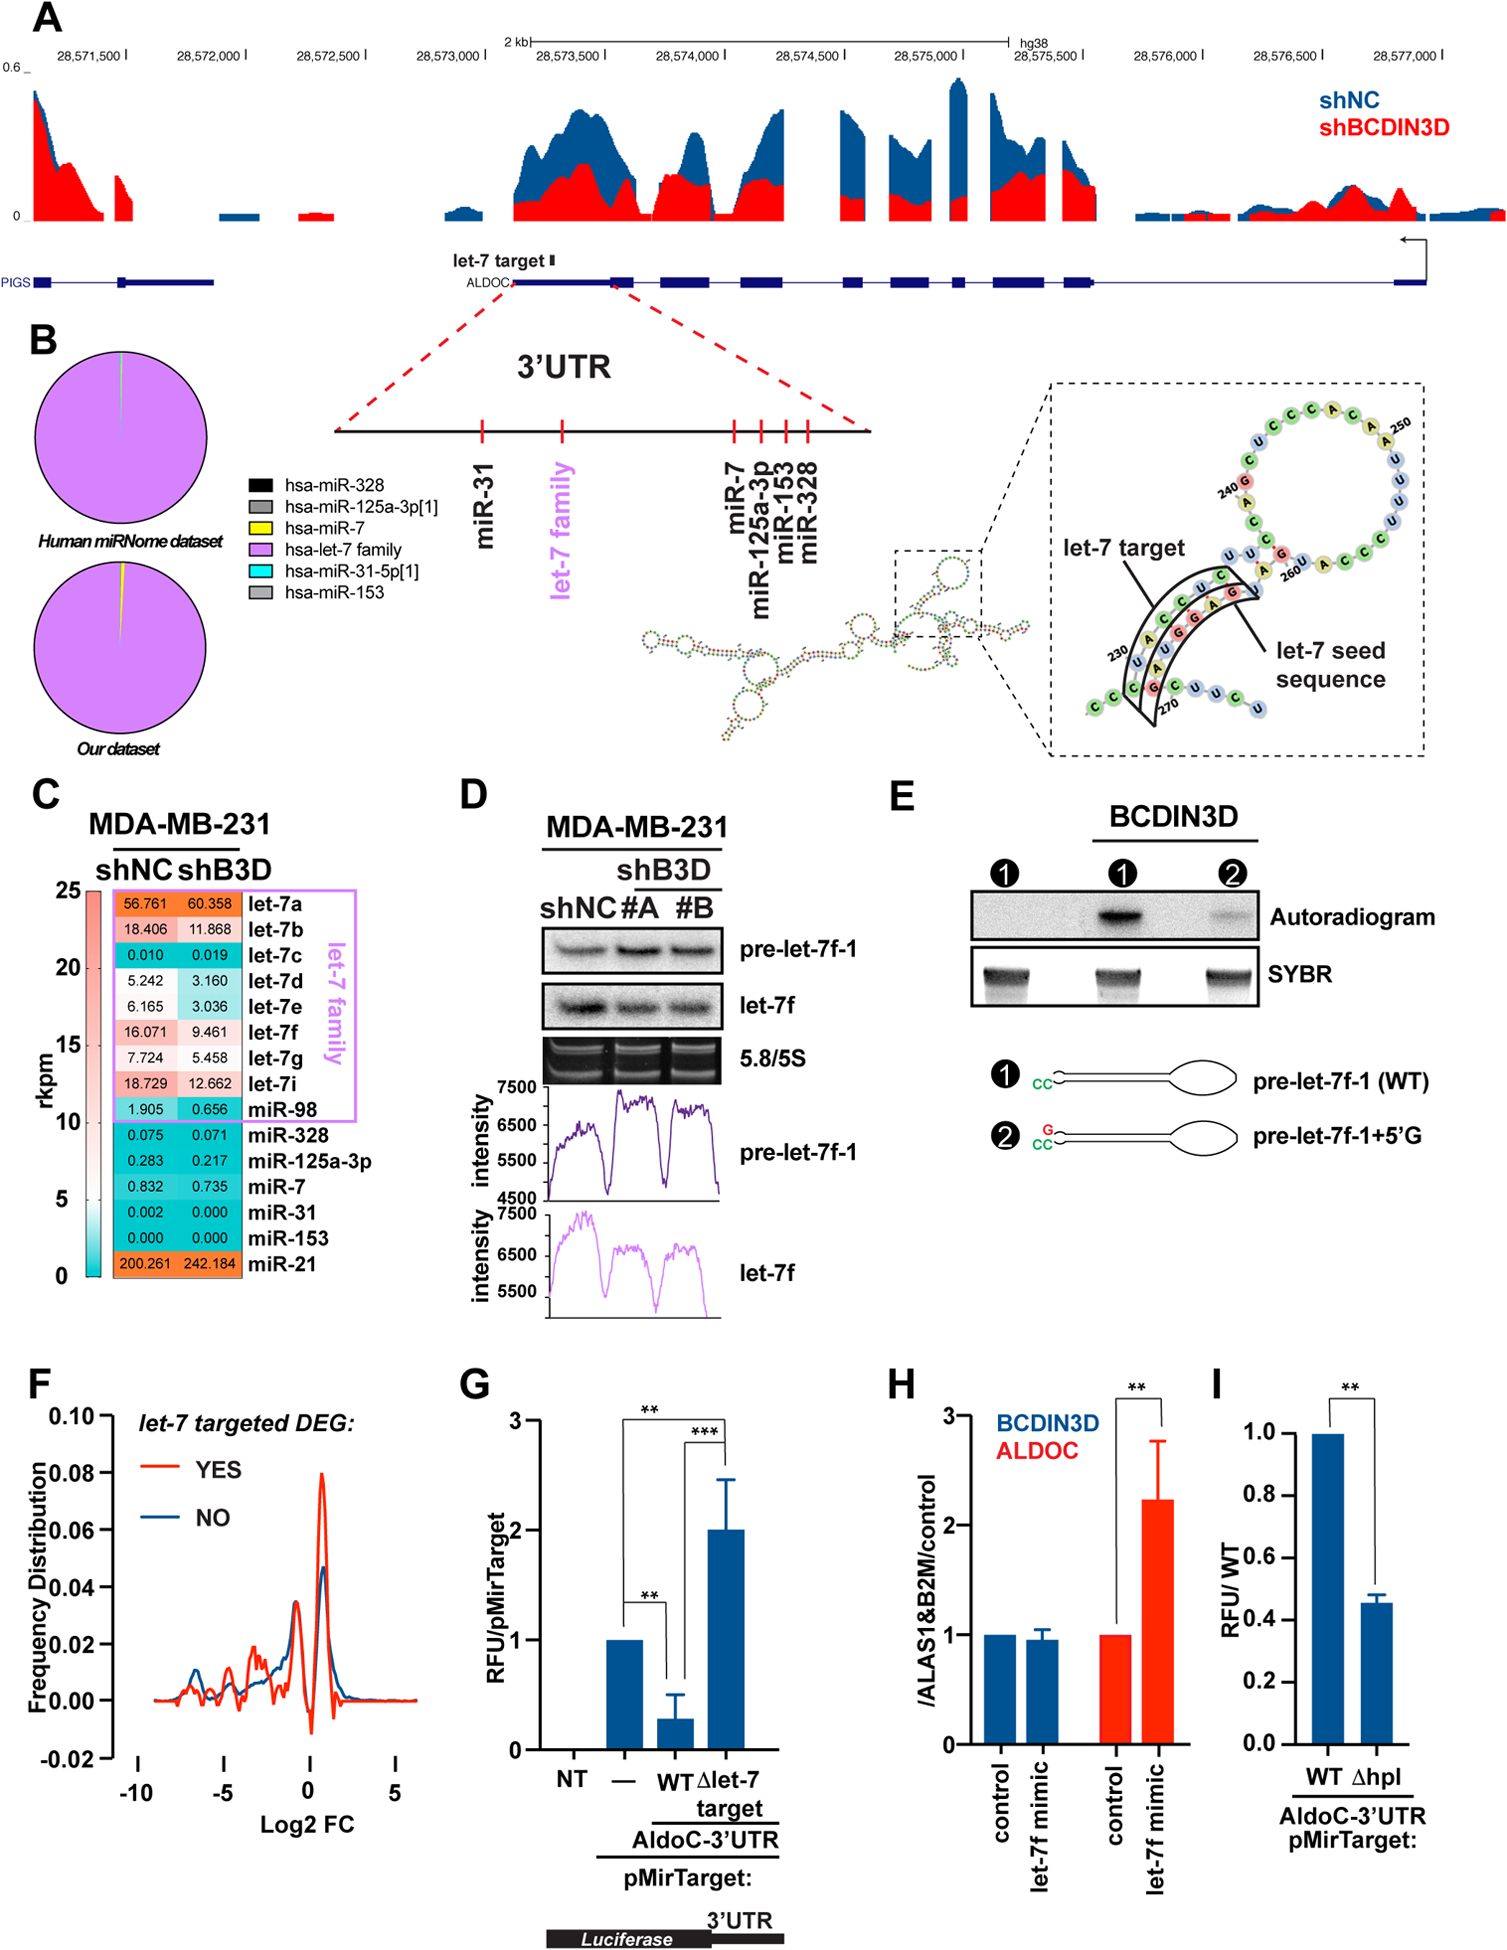
Type II diabetes (T2D) and specific cancers share many risk factors, however, the molecular mechanisms underlying these connections are often not well-understood. BCDIN3D is an RNA modifying enzyme that methylates specific precursor microRNAs and tRNAHis. In addition to breast cancer, BCDIN3D may also be linked to metabolism, as its gene locus is associated with obesity and T2D. In order to uncover metabolic pathways regulated by BCDIN3D in cancer, we performed an unbiased analysis of the metabolome, transcriptome, and proteome of breast cancer cells depleted for BCDIN3D. Intersection of these analyses showed that BCDIN3D-depleted cells have increased levels of Fructose 1,6 Bisphosphate (F1,6-BP), the last six-carbon glycolytic intermediate accompanied by reduced glycolytic capacity. We further show that elevated F1,6-BP is due to downregulation of Aldolase C (ALDOC), an enzyme that cleaves F1,6-BP mainly in the brain, but whose high expression/amplification is associated with poor prognosis in breast cancer. BCDIN3D regulates ALDOC through a non-canonical mechanism involving the crucial let-7 microRNA family and its target site on the 3'UTR of ALDOC. Overall, our results reveal an important connection between BCDIN3D, let-7 and glycolysis that may be relevant to breast cancer, obesity, and T2D.


Conflict of interest statement

Conflict of Interest Statement

The authors declare that they have no conflict of interest.

Figures

Figure 1.
Figure 1.. BCDIN3D depletion reduces tumor formation in vivo.
a Foxn1nu/nu mice were orthotopically injected into the #4 mammary fat pad with MDA-MB-231-luc-D3H2LN shNC or shBCDIN3D cells. Tumors were palpated and measured with a caliper over a period of five weeks. The graph shows the tumor volume (mm³) calculated by the formula: volume = (smaller dimension² × larger dimension)/2 as a function of time (scatter plot with mean ± SD, n=10 for shNC, and n=8 for shBCDIN3D, please note that the mice who did not develop tumors are shown on the graph with a dot at 0, but were not taken into account for the calculation of the average size of tumors). The pictures show the resected tumors at day 35 post-injection. b Shown are IVIS images of mice injected with luciferin intraperitoneally 8 weeks post-tail vein injection of MDA-MB-231-luc-D3H2LN shNC or shBCDIN3D cells. 3 control mice show tumors on the bone [spine (#940), rib cage (#950) and jaw (#929)], 1 control mouse (#932) shows a large tumor in the lungs and 1 mouse injected with shBCDIN3D cells (#954) shows a smaller tumor in the lungs.
Figure 2.
Figure 2.. BCDIN3D knock-down profoundly affects gene expression in breast cancer cells.
a Volcano plot representing the fold change (FC) of normalized RNA read counts (shBCDIN3D over shNC) on the X-axis (log2) and the False Discovery Rate (FDR) on the Y-axis (log10). Green dots indicate significantly down- or up-regulated genes in shBCDIN3D over shNC with a fold change FC≥1.5 and FDR ≤ 0.05, while the other colors indicate the other combinations of FC and significance, as indicated in the legend in top right of the Volcano plot. b Ingenuity pathway analysis (IPA) of the RNA-Seq analysis in MDA-MB-231 shNC and shBCDIN3D cells, mapping the position of protein coding genes belonging to the “mTOR pathway” that were differentially regulated in shBCDIN3D compared to shNC cells (green: downregulated; red: upregulated, see legend for exact correspondence between expression log ratio and color). c Identity and expression log ratio of the mTOR pathway in (B). d mTOR-phospho Ser 2448 western blot analysis of MDA-MB-231 shNC and shBCDIN3D cells untreated, or treated with 10 nM Rapamycin for 24h. shB3D#A and B represent two independent MDA-MB-231 shBCDIN3D clones. The numbers beneath the anti mTOR-P western blot corresponds to the mTOR-P signal normalized to αTubulin signal from the same western blot, and to shNC. e Polysome lysates from MDA-MB-231 shNC, shNC+Rapamycin at 10 nM for 24h, and shBCDIN3D cells were fractionated on a 7–50% sucrose gradient. Shown here are the real time recording of OD254, starting at the monosome fraction of a representative experiment. f Metabolic labeling of MDA-MB-231 shNC, shNC+Rapamycin at 10 nM for 24h, and shBCDIN3D cells for 30 min with Methionine, L-[35S]. The autoradiogram on the left was obtained from exposure on film of the Coomassie-stained gel on the right. g Meta-analysis of ribosome profiling reads around the translation start site (TSS ± 1kb) of protein coding genes in MDA-MB-231 shNC, shNC+Rapamycin at 10 nM for 24h, and shBCDIN3D cells (See complete analysis in Fig. S3).
Figure 3.
Figure 3.. BCDIN3D regulates the levels of F1,6-BP and glycolysis through ALDOC.
a N-acetylglutamate and glycolysis pathway intermediates results from the untargeted profiling of primary metabolism in MDA-MB-231 cells where BCDIN3D is depleted via siRNA or shRNA. Data is normalized to siNC and shNC controls (mean ± SEM, n=4). The asterisks indicate the significant p-values between the control and BCDIN3D knock-down samples (multiple t-test). b Results of expression levels of glycolysis pathway enzymes from the proteomic analysis (LC-MS/MS) and RNA-Seq in MDA-MB-231 shBCDIN3D compared to shNC cells. The color scale goes from the deepest shade of red for the lowest value to the deepest shade of blue for the highest value. c Left and Middle: Kinetic profile of oxygen consumption rate (OCR) and extracellular acidification rate (ECAR) measurement of MDA-MB-231 shNC and shBCDIN3D #A and #B cells using a Real Time ATP rate assay kit in a Seahorse XFp apparatus [mean ± SEM, n=4 (i.e. 2×2)]. Injection of oligomycin (1.5 μM final concentration) results in an inhibition of mitochondrial ATP synthesis that results in a decrease in OCR, and an increase of glycolytic ATP production that results in an increase in ECAR. Complete inhibition of mitochondrial respiration with rotenone plus antimycin A (0.5 μM final concentration) enables calculation of mitochondrial-associated acidification, which is negligible in these cells. Right: BCDIN3D and ALDOC gene expression from MDA-MB-231 shNC and shBCDIN3D #A and #B cells. Data is normalized to ALAS1, B2M and shNC (mean ± SEM, n=3). The asterisks indicate significant p-values (2 way Anova with multiple comparisons). d IHC of ALDOC from a representative xenograft tumor of MDA-MB-231 shNC cells in Foxn1nu/nu mice. e Copy number variation (Gain in red, Loss in blue) of the ALDOC gene in different cancers from The Cancer Genome Atlas (TCGA), showing that Breast Cancer (BRCA) displays the highest number of copy number gain. f Overall breast cancer patient survival status as a function of time in weeks (up to 360 weeks) and separated in two groups: having a ALDOC amplification (n=96) or not (n=1806) (METABRIC cohort analyzed on cBioPortal for Cancer Genomics). g Overall breast cancer patient survival status as a function of time in weeks (up to 360 weeks) and separated in two groups: having high ALDOC mRNA level relative to diploid samples, z-score>2 (n=80) or not (n=1901) (METABRIC cohort analyzed on cBioPortal for Cancer Genomics). h Distribution of patients defined in g as a function of PAM50 + Claudin-low subtypes (Chi Squared Test, p value = 3.646e-4, q value = 2.735e-4). i ALDOC expression is also reduced upon siRNA-mediated knock-down of BCDIN3D in MDA-MB-436 basal B breast cancer cells. j Overexpression of ALDOC increases mTOR signaling in MDA-MB-231 cells. Protein extracts from MDA-MB-231 shNC, shBCDIN3D#A-B cell lines stably expressing GFP or ALDOC were analyzed by western blot with the indicated antibodies. The numbers beneath the anti mTOR-P western blot corresponds to the mTOR-P signal normalized to αTubulin signal from the same western blot, and to shNC+GFP.
Figure 4.
Figure 4.. BCDIN3D stimulates ALDOC through a non-canonical mechanism involving let-7 microRNAs.
a UCSC genome browser traces of RNA-Seq in MDA-MB-231 shNC and shBCDIN3D cells at the ALDOC locus. The traces are overlaid, with the shNC trace (in blue) in the back position, and the shBCDIN3D trace (in red) in the forward position. The position of predicted miRNA target sites on the ALDOC 3’UTR is also indicated, together with the predicted structure of the ALDOC 3’UTR, overall or focused at the let-7 target site. b Pie chart showing the relative levels of microRNAs that are predicted to target the ALDOC 3’UTR, in MDA-MB-231 cells from Human miRNome track hub [20] (top) and our dataset [2]. c Levels of microRNAs in reads per kilobase per million (rkpm) that are predicted to target the ALDOC 3’UTR, in MDA-MB-231 shNC and shBCDIN3D cells from our dataset [2] analyzed with a microRNA specific bioinformatic pipeline. d 1 μg of RNA from MDA-MB-231 shNC and shBCDIN3D cells was analyzed by northern blot probed with the anti-let-7f probe, stripped, and re-probed with the anti-pre-let-7f-1 probe. 5/5.8 S panel shows the SYBR Gold stained gel at the level of the 5/5.8S ribosomal RNA (loading control). The bottom graphs show the raw intensity of the pre-let-7f-1 and let-7f signal quantified with ImageJ. e in vitro RNA methyltransferase assay with recombinant BCDIN3D using radioactive [3H]-SAM as methyl group donor, and pre-let-7f-1-5’P precursor with either the WT predicted sequence, or containing an extra G nucleotide at the 5’ end. The bottom panel shows the SYBR stained gel that was used for the autoradiography in the top panel. See Fig. S8 for complete analysis. f Distribution of differentially expressed genes (DEG) in MDA-MB-231 shBCDIN3D compared to shNC cells as a function of their logarithmic fold change, and separated into two groups: having a putative let-7 target site (red) or not (blue) by TargetScan. See Table S9 for complete information. g MDA-MB-231 cells were transfected with pMirTarget (Origene) containing or not the 3’-UTR of ALDOC, either WT or having a deletion of the let-7 seed target (Δlet-7 target), fused to the Luciferase Reporter gene. 24h after transfection, the cells were lysed and the luciferase activity was measured in a luminometer. Data is normalized to pMirTarget transfected cells (mean ± SD, n=3). The asterisks indicate significant p-values (1 way Anova with multiple comparisons). h BCDIN3D and ALDOC gene expression from MDA-MB-231 transfected with siNC (control) or let-7f mimic. Data is normalized to ALAS1, B2M and control (mean ± SD, n=2). The asterisks indicate significant p-values (Ratio paired t test). i MDA-MB-231 cells were transfected with pMirTarget-ALDOC-3’-UTR, either WT or having a deletion of the hairpin loop (Δhpl) targeted by let-7, fused to the Luciferase Reporter gene and analyzed as in (G). The asterisks indicate significant p-values (Ratio paired t test).

References

    1. Shelton SB, Reinsborough C, Xhemalce B. Who Watches the Watchmen: Roles of RNA Modifications in the RNA Interference Pathway. PLoS Genet (Review) 2016; 12: e1006139. - PMC - PubMed
    1. Reinsborough CW, Ipas H, Abell NS, Nottingham RM, Yao J, Devanathan SK et al. BCDIN3D regulates tRNAHis 3’ fragment processing. PLoS Genet 2019; 15: e1008273. - PMC - PubMed
    1. Xhemalce B, Robson SC, Kouzarides T. Human RNA methyltransferase BCDIN3D regulates microRNA processing. Cell 2012; 151: 278–288. - PMC - PubMed
    1. Zhu W, Hanes SD. Identification of drosophila bicoid-interacting proteins using a custom two-hybrid selection. Gene 2000; 245: 329–339. - PubMed
    1. Zhu L, Liao SE, Ai Y, Fukunaga R. RNA methyltransferase BCDIN3D is crucial for female fertility and miRNA and mRNA profiles in Drosophila ovaries. PLoS One 2019; 14: e0217603. - PMC - PubMed

Publication types

MeSH terms