. 2021 Jul;28(7):2160-2178.
doi: 10.1038/s41418-021-00744-9. Epub 2021 Mar 4.

MACF1 promotes osteoblast differentiation by sequestering repressors in cytoplasm

Affiliations

MACF1 promotes osteoblast differentiation by sequestering repressors in cytoplasm

Lifang Hu et al. Cell Death Differ. 2021 Jul.

Abstract

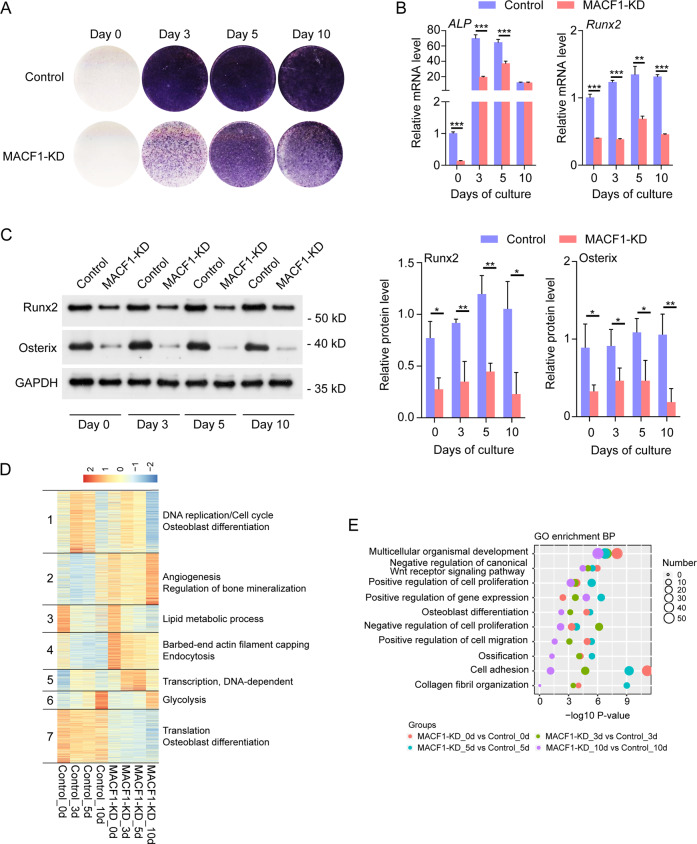
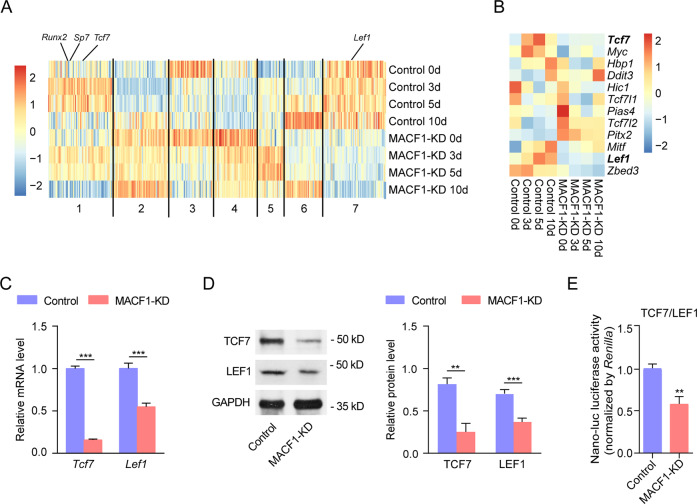
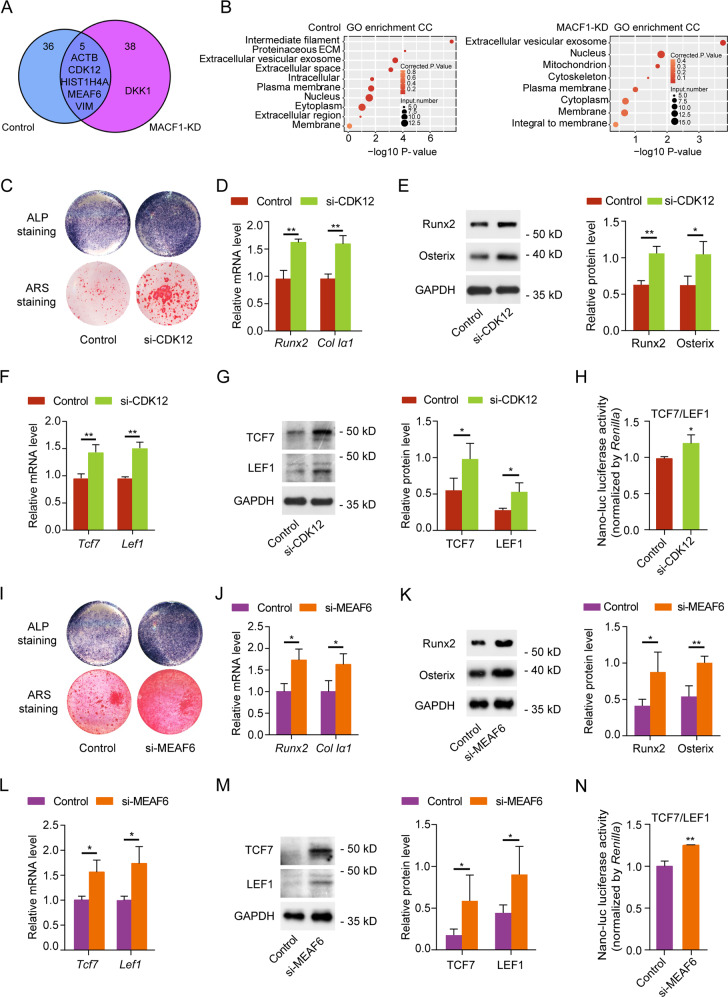
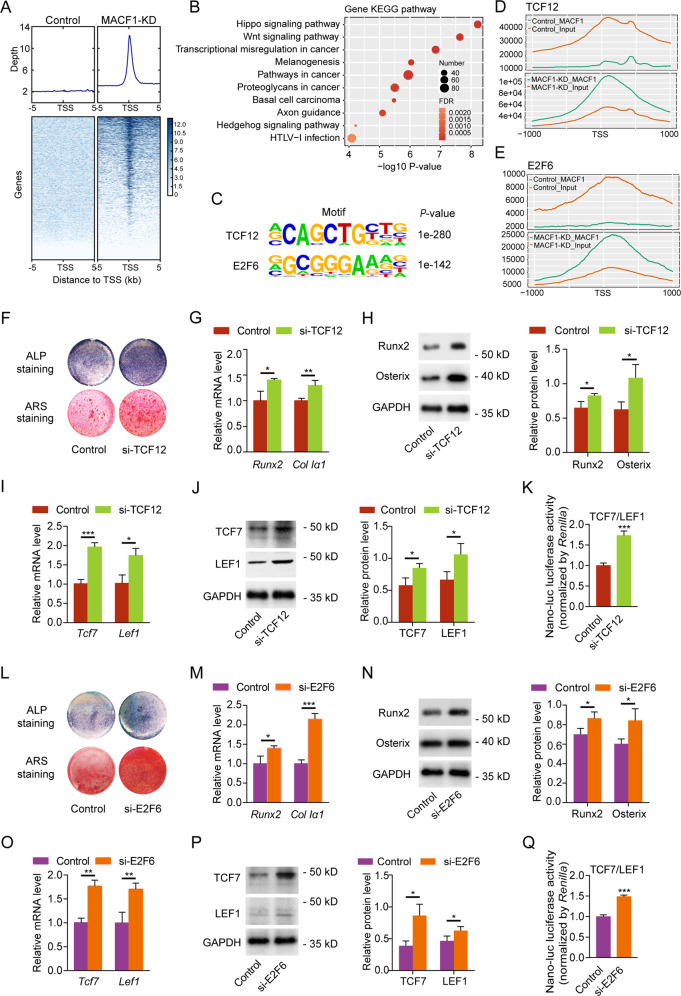
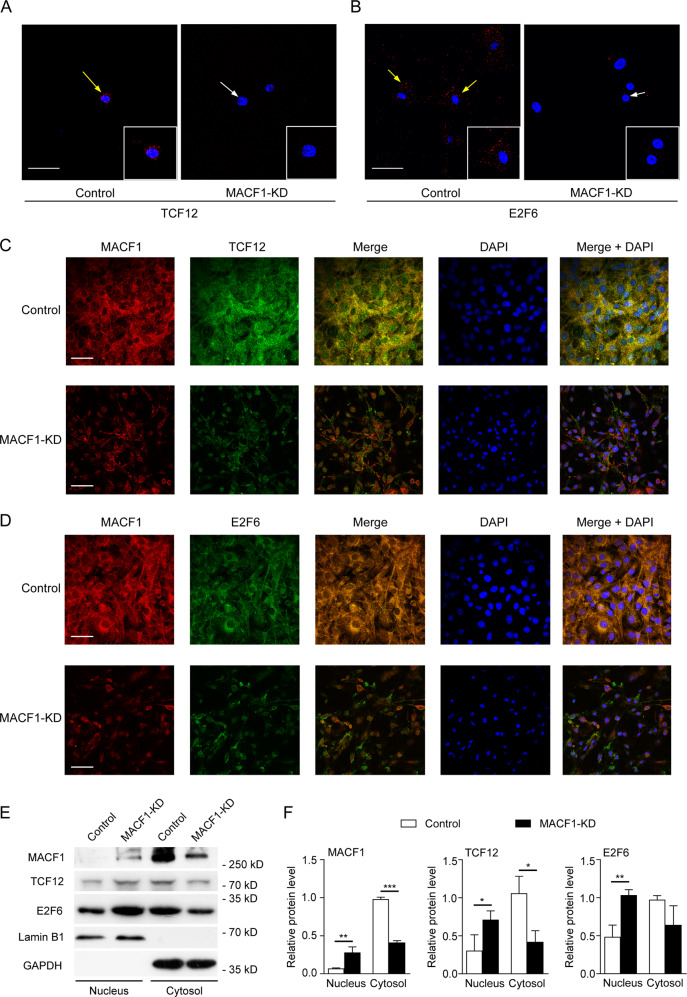
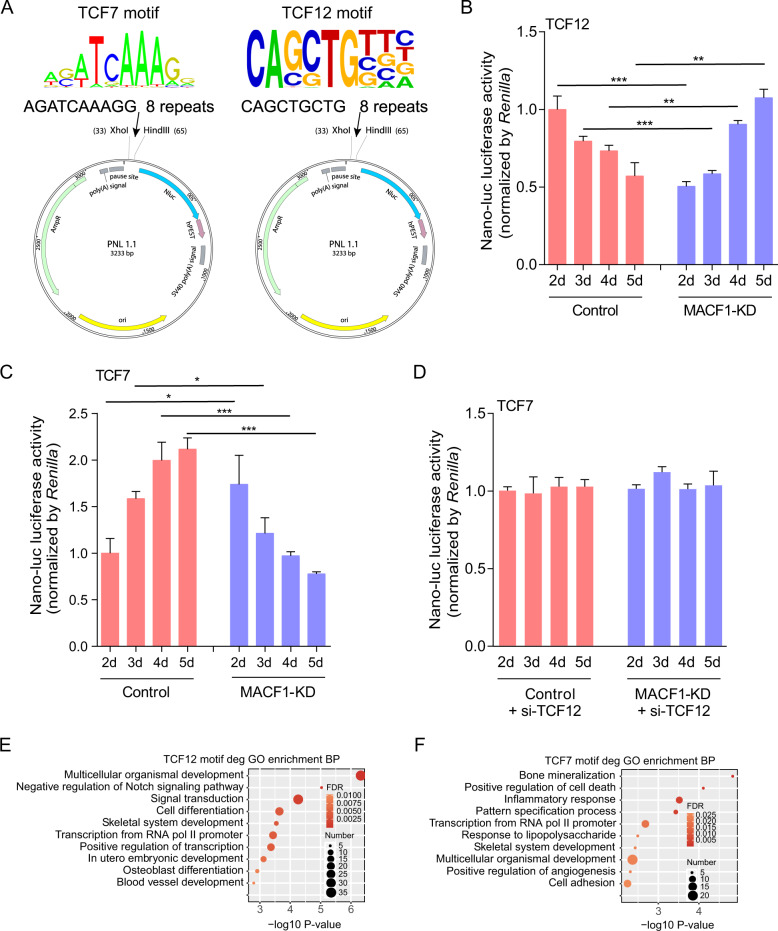
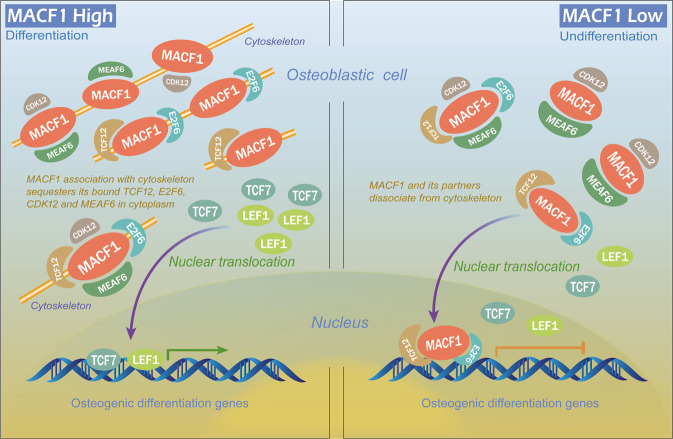
Osteoblast differentiation leading to bone formation requires a coordinated transcriptional program. Osteoblastic cells with low level of microtubule actin crosslinking factor 1 (MACF1) show reduced osteoblast differentiation ability, however, the comprehensive mechanism of MACF1's action remains unexplored. In the current study, we found that MACF1 knockdown suppressed osteoblast differentiation by altering the transcriptome dynamics. We further identified two MACF1-interacted proteins, cyclin-dependent kinase 12 (CDK12) and MYST/Esa1-associated factor 6 (MEAF6), and two MACF1-interacted transcription factors (TFs), transcription factor 12 (TCF12) and E2F transcription factor 6 (E2F6), which repress osteoblast differentiation by altering the expression of osteogenic TFs and genes. Moreover, we found that MACF1 regulated cytoplasmic-nuclear localization of itself, TCF12 and E2F6 in a concentration-dependent manner. MACF1 oppositely regulates the expression of TCF12 and transcription factor 7 (TCF7), two TFs that drive osteoblast differentiation to opposite directions. This study reveals that MACF1, a cytoskeletal protein, acts as a sponge for repressors of osteoblast differentiation to promote osteoblast differentiation and contributes to a novel mechanistic insight of osteoblast differentiation and transcription dynamics.


Conflict of interest statement

The authors declare no competing interests.

Figures

Fig. 1
Fig. 1. MACF1 knockdown inhibits osteoblast differentiation and alters osteoblast differentiation transcriptome dynamics.
A ALP activity of Control and MACF1-KD cells was detected by ALP staining. B The expression of ALP and Runx2 examined by real-time PCR during osteoblastic differentiation in Control and MACF1-KD cells. Data represent mean value ± SD (n = 3). (**P < 0.01, ***P < 0.001). C The protein levels of Runx2 and Osterix determined by Western blot during osteoblastic differentiation in Control and MACF1-KD cells. Representative Western blots visualized by enhanced chemiluminescence method (left) and the quantification results with GAPDH as internal control (right) (n = 3). (*P < 0.05, **P < 0.01). D Heatmap showing the seven clusters of the differentially expressed genes (DEGs) identified by maSigPro program. The enriched GO biological process (BP) terms of each cluster were shown on the figure. E Bubble diagram showing the top 10 enriched GO BP terms for the downregulated genes during osteoblastic differentiation after MACF1 knockdown.
Fig. 2
Fig. 2. MACF1 knockdown changes the expression profile of transcription factors during osteoblast differentiation.
A Heatmap showing the differentially expressed transcription factors (TFs) between Control and MACF1-KD cells detected by maSigPro program. TFs were sorted by the rank of clusters. B Heatmap showing several key differentially expressed TFs in Wnt signaling pathway screened from (A). C Real-time PCR verification of the Tcf7 and Lef1 expression in Control and MACF1-KD cells. Data represent mean value ± SD (n = 3). (***P < 0.001) D Western blot verification of the TCF7 and LEF1 expression in Control and MACF1-KD cells. Representative Western blots visualized by enhanced chemiluminescence method (left) and the quantification results with GAPDH as internal control (right) (n = 3). (**P < 0.01, ***P < 0.001). E Luciferase reporter assay validation of the transcription activity of TCF7/LEF1 in Control and MACF1-KD cells. Data represent mean value ± SD (n = 3). (**P < 0.01).
Fig. 3
Fig. 3. CDK12 and MEAF6 are identified as MACF1-interacted proteins, knockdown of which promotes osteoblast differentiation and upregulates the expression of TCF7 and LEF1.
A Venn diagram showing the overlapped MACF1-interacted proteins between Control and MACF1-KD cells detected by co-IP with protein mass spectrometry (MS). B Bubble diagram showing the top enriched GO cellular component (CC) terms for the detected proteins in Control (left panel) and MACF1-KD (right panel) cells, respectively. MC3T3-E1 osteoblasts were treated with or without CDK12 siRNA (si-CDK12) (C) or MEAF6 siRNA (si-MEAF6) (I) for ALP activity detection (ALP staining) and mineralized nodules formation determination (ARS staining) after 3 days’ and around 19 days’ osteoblast differentiation, respectively. The expression of osteogenic genes Runx2 and Col Iα1 examined by real-time PCR after si-CDK12 (D) or si-MEAF6 (J) treatment. Data represent mean value ± SD (n = 3). (*P < 0.05, **P < 0.01). The protein level of Runx2 and Osterix determined by Western blot after si-CDK12 (E) or si-MEAF6 treatment (K). Representative Western blots visualized by enhanced chemiluminescence method (left of E, K) and the quantification results with GAPDH as internal control (right of E, K) (n = 3). (*P < 0.05, **P < 0.01). The expression of Tcf7 and Lef1 examined by real time PCR after si-CDK12 (F) or si-MEAF6 (L) treatment. Data represent mean value ± SD (n = 3). (*P < 0.05, **P < 0.01). The protein level of TCF7 and LEF1 determined by Western blot after si-CDK12 (G) or si-MEAF6 (M) treatment. Representative Western blots visualized by enhanced chemiluminescence method (left of G, M) and the quantification results with GAPDH as internal control (right of G, M) (n = 3). (*P < 0.05). The transcription activity of TCF7/LEF1 was examined by luciferase reporter assay after si-CDK12 (H) or si-MEAF6 (N) treatment. Data represent mean value ± SD (n = 3). (*P < 0.05, **P < 0.01).
Fig. 4
Fig. 4. Transcription factors (TFs) TCF12 and E2F6 are determined as MACF1-interacted TFs, knockdown of which promotes osteoblast differentiation and upregulates the expression of TCF7 and LEF1.
A Density and heatmap plot showing the binding profiles around TSS region for all genes in Control and MACF1-KD cells, respectively. B Bubble diagram showing the top KEGG pathways for the genes bound by MACF1 in MACF1-KD cells. C The binding motifs of two known TFs and their significant p values. The motifs were extracted from the binding peaks of MACF1 by Homer software in MACF1-KD cells. Line plot showing the enriched density for genes with binding motifs of TCF12 (D) or E2F6 (E) in MACF1-KD cells compared with Control cells detected by ChIP-seq. The input sample represented genomic DNA density without immunoprecipitation. MC3T3-E1 osteoblasts were treated with or without TCF12 siRNA (si-TCF12) (F) or E2F6 siRNA (si-E2F6) (L) for ALP activity (ALP staining) and mineralized nodules formation detection (ARS staining) after 3 days’ and around 19 days’ osteoblast differentiation, respectively. The expression of osteogenic genes Runx2 and Col Iα1 examined by real-time PCR after si-TCF12 (G) or si-E2F6 (M) treatment. Data represent mean value ± SD (n = 3). (*P < 0.05, **P < 0.01, ***P < 0.001). The protein level of Runx2 and Osterix determined by Western blot after si-TCF12 (H) or si-E2F6 treatment (N). Representative Western blots visualized by enhanced chemiluminescence method (left of H, N) and the quantification results with GAPDH as internal control (right of H, N) (n = 3). (*P < 0.05). The expression of Tcf7 and Lef1 examined by real-time PCR after si-TCF12 (I) or si-E2F6 (O) treatment. Data represent mean value ± SD (n = 3). (*P < 0.05, **P < 0.01, ***P < 0.001). The protein level of TCF7 and LEF1 determined by Western blot after si-TCF12 (J) or si-E2F6 treatment (P). Representative Western blots visualized by enhanced chemiluminescence method (left of J, P) and the quantification results with GAPDH as internal control (right of J, P) (n = 3). (*P < 0.05). The transcription activity of TCF7/LEF1 was examined by luciferase reporter assay after si-TCF12 (K) or si-E2F6 (Q) treatment. Data represent mean value ± SD (n = 3). (***P < 0.001).
Fig. 5
Fig. 5. MACF1 knockdown promotes the nuclear translocation of MACF1, TCF12, and E2F6.
A, B The interactions between MACF1 and TCF12, MACF1, and E2F6, were determined by duolinker PLA assay. Red staining (arrow) shows the interactions. Bar: 50 μm. C, D The cellular distribution of MACF1, TCF12, and E2F6, and the colocalization between MACF1 and TCF12, MACF1 and E2F6 detected by immunofluorescence staining. Bar: 50 μm. E Representative Western blots of the nuclear (nucleus) and cytosolic (cytosol) fractions of MACF1, TCF12, and E2F6. Lamin B1 and GAPDH were used as internal controls for nuclear and cytosolic fractions, respectively. F Quantification of nuclear and cytosol levels of MACF1, TCF12, and E2F6 with Lamin B1 and GAPDH as internal control, respectively. Data represent mean value ± SD (n = 3). (*P < 0.05, **P < 0.01, ***P < 0.001).
Fig. 6
Fig. 6. MACF1 oppositely regulates the transcription activity of TCF12 and TCF7 to regulate their downstream genes expression.
A Schematic illustration of the design of the TCF7 and TCF12 nano-luc luciferase reporter plasmids. B Transcription activity of TCF12 in Control or MACF1-KD cells detected by luciferase reporter assay. Data represent mean value ± SD (n = 3). Statistical analysis was performed using Student t-test compared to the corresponding control group (**P < 0.01, ***P < 0.001). C Transcription activity of TCF7 in Control or MACF1-KD cells detected by luciferase reporter assay. Data represent mean value ± SD (n = 3). Statistical analysis was performed using Student t-test compared to the corresponding control group (*P < 0.05, ***P < 0.001). D Transcription activity of TCF7 after TCF12 siRNA (si-TCF12) treatment in Control or MACF1-KD cells detected by luciferase reporter assay. Data represent mean value ± SD (n = 3). Bubble diagram showing the enriched GO BP terms for the DEGs downstream of TCF12 (E) and TCF7 (F).
Fig. 7
Fig. 7. Proposed model of MACF1 regulating osteoblast differentiation by sequestering the repressors in cytoplasm.
MACF1 stably associates with cytoskeleton at high level and effectively sequesters suppressive transcription regulators of osteogenic genes in cytoplasm to ensure successful osteoblast differentiation, while low level of MACF1 results in the nuclear translocation of repressors and shuts off the transcriptional program for osteoblast differentiation.

Similar articles

Cited by

References

    1. Ducy P, Schinke T, Karsenty G. The osteoblast: a sophisticated fibroblast under central surveillance. Science. 2000;289:1501–1504. - PubMed
    1. Harada S, Rodan GA. Control of osteoblast function and regulation of bone mass. Nature. 2003;423:349–355. - PubMed
    1. Huang W, Yang S, Shao J, Li YP. Signaling and transcriptional regulation in osteoblast commitment and differentiation. Front Biosci. 2007;12:3068–3092. - PMC - PubMed
    1. Karsenty G, Kronenberg HM, Settembre C. Genetic control of bone formation. Annu Rev Cell Dev Biol. 2009;25:629–648. - PubMed
    1. Long F. Building strong bones: molecular regulation of the osteoblast lineage. Nat Rev Mol Cell Biol. 2011;13:27–38. - PubMed

Publication types

MeSH terms

Substances