. 2021 Aug;28(8):2333-2350.
doi: 10.1038/s41418-021-00755-6. Epub 2021 Mar 4.

GSDME-mediated pyroptosis promotes inflammation and fibrosis in obstructive nephropathy

Affiliations

GSDME-mediated pyroptosis promotes inflammation and fibrosis in obstructive nephropathy

Yinshuang Li et al. Cell Death Differ. 2021 Aug.

Abstract

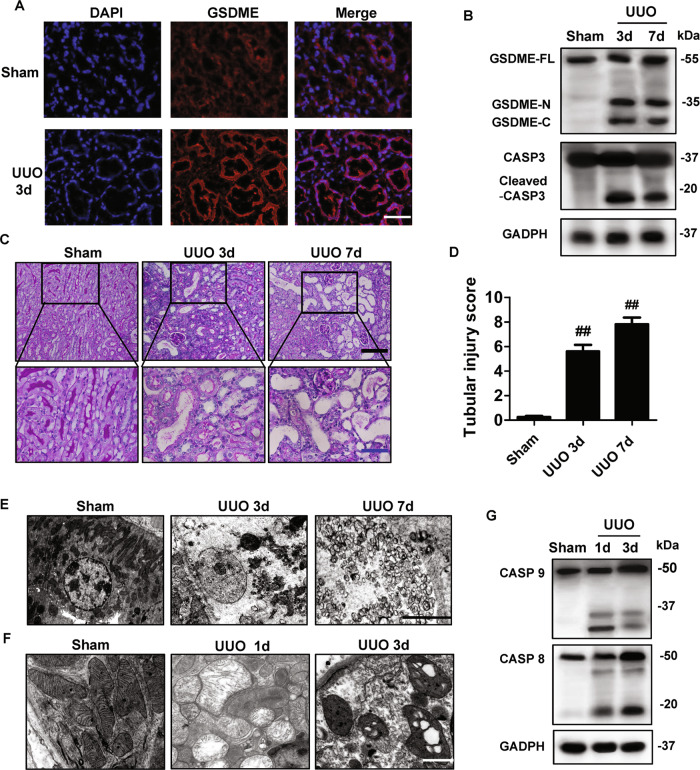
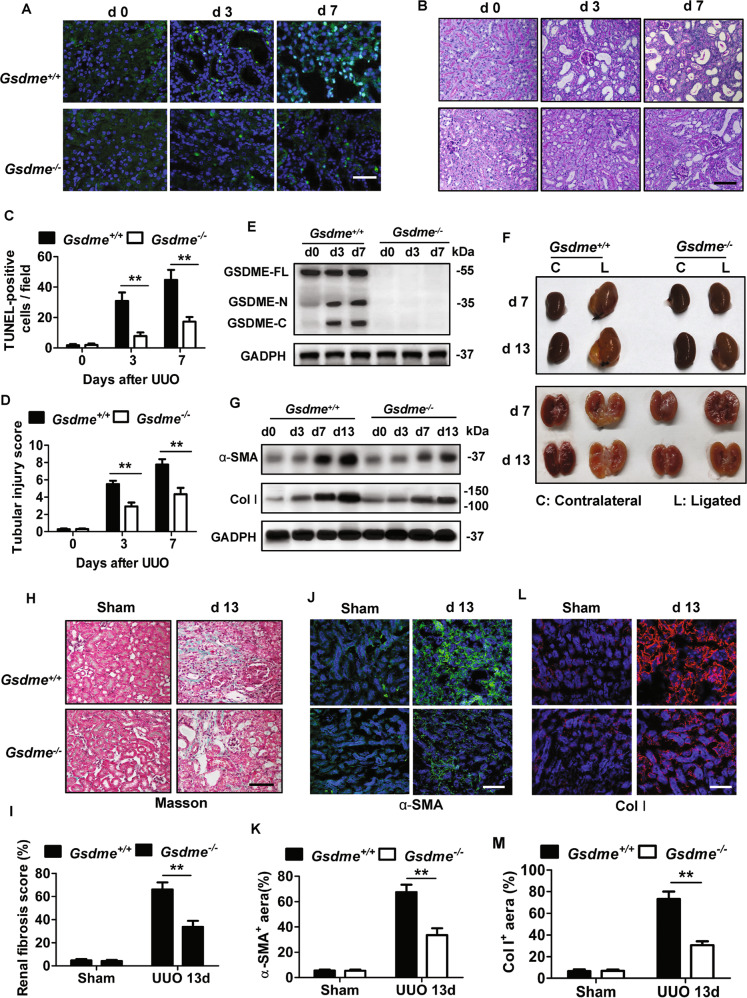
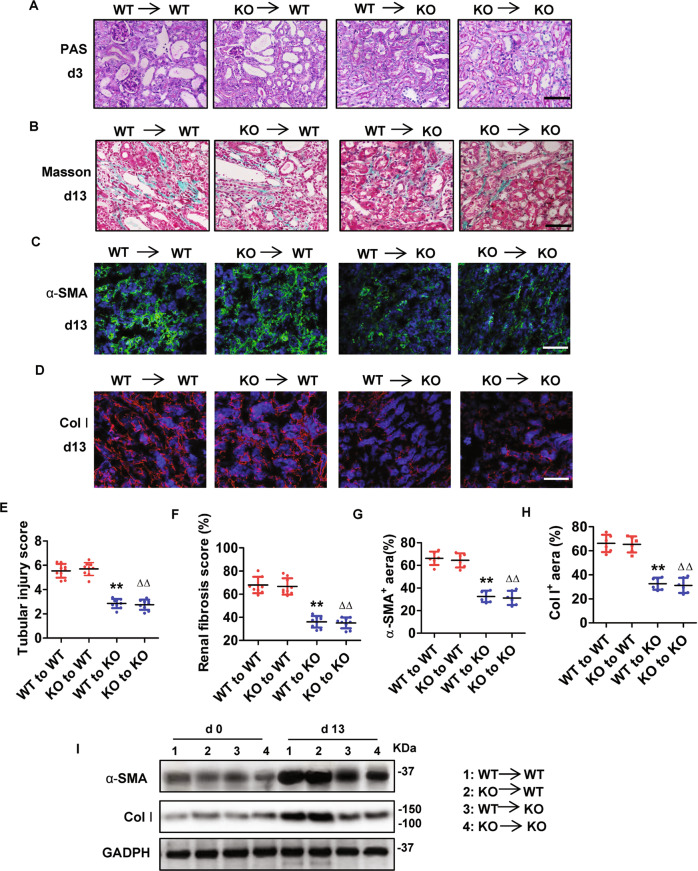
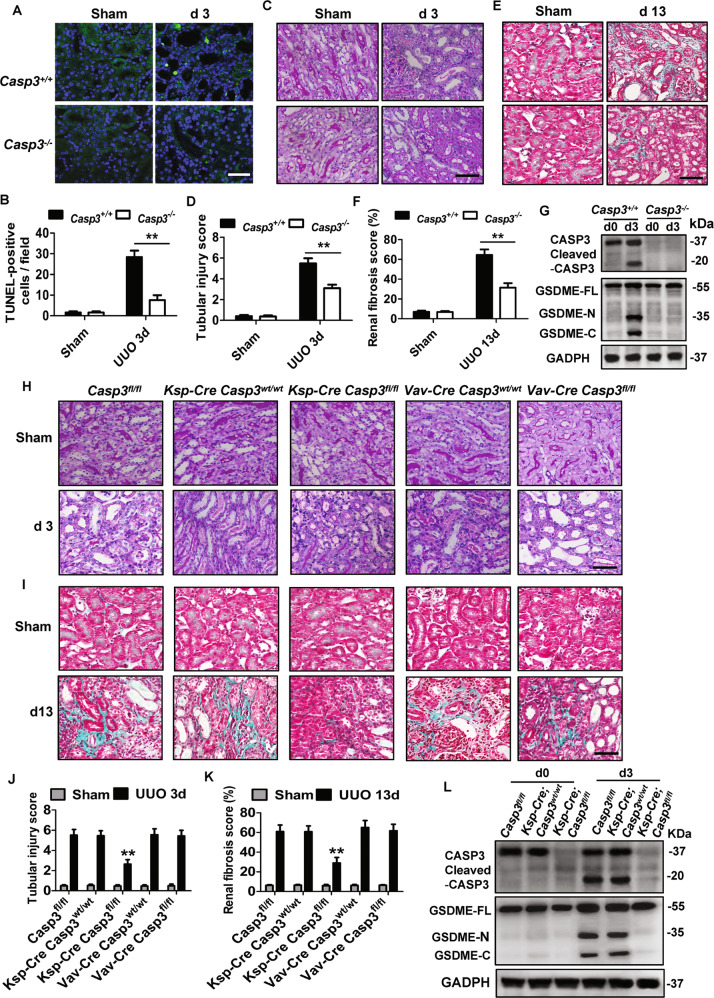
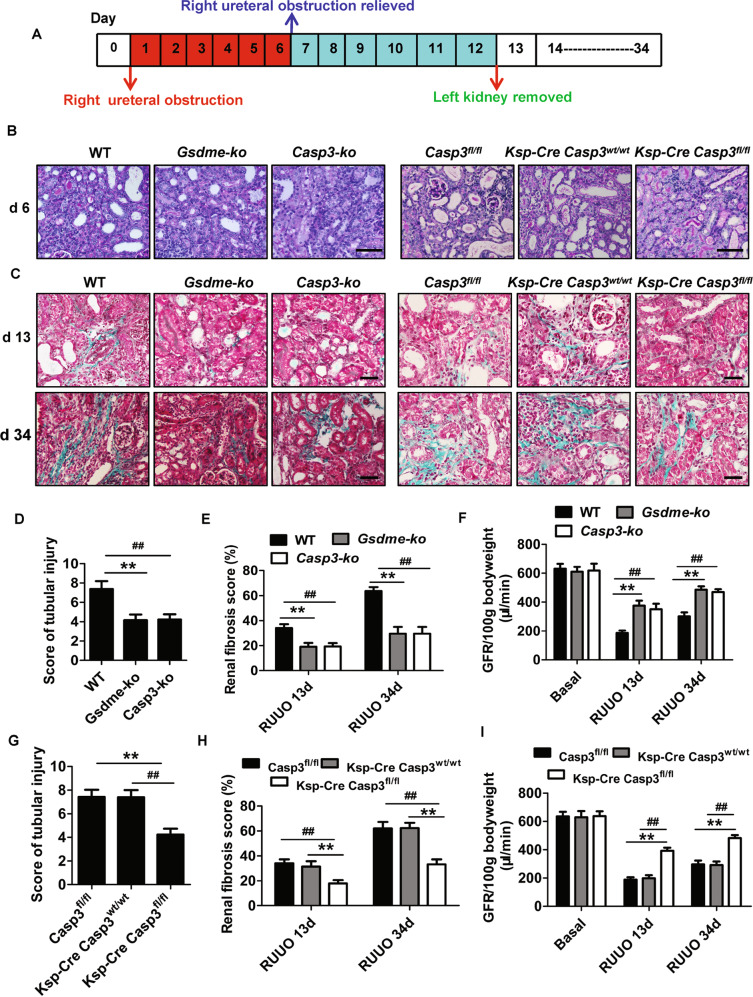
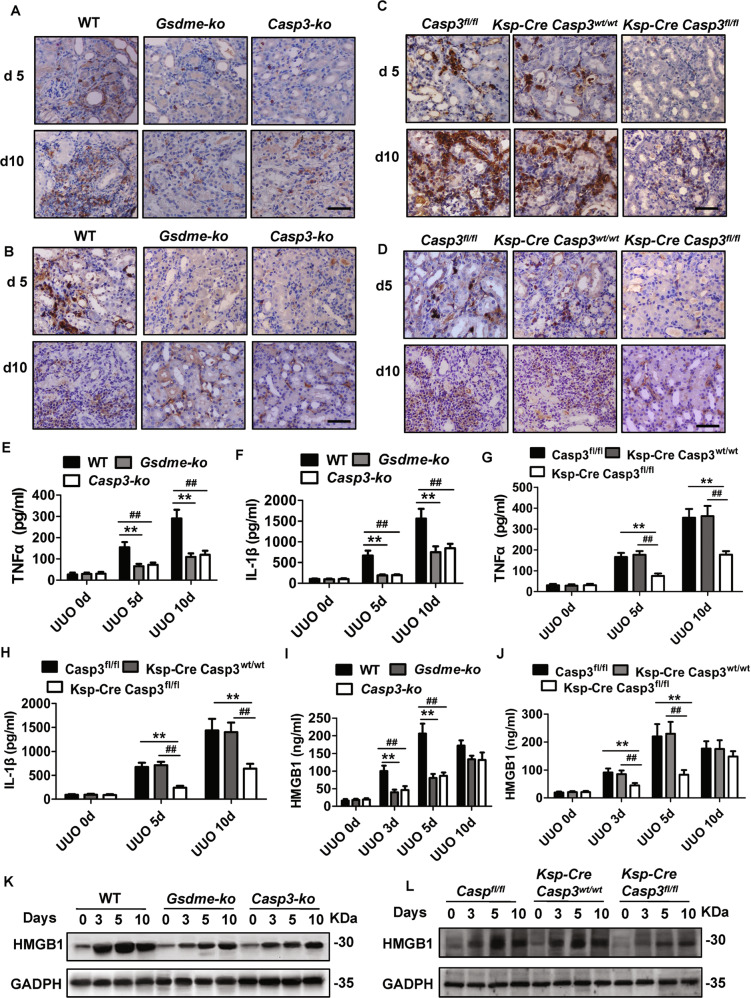
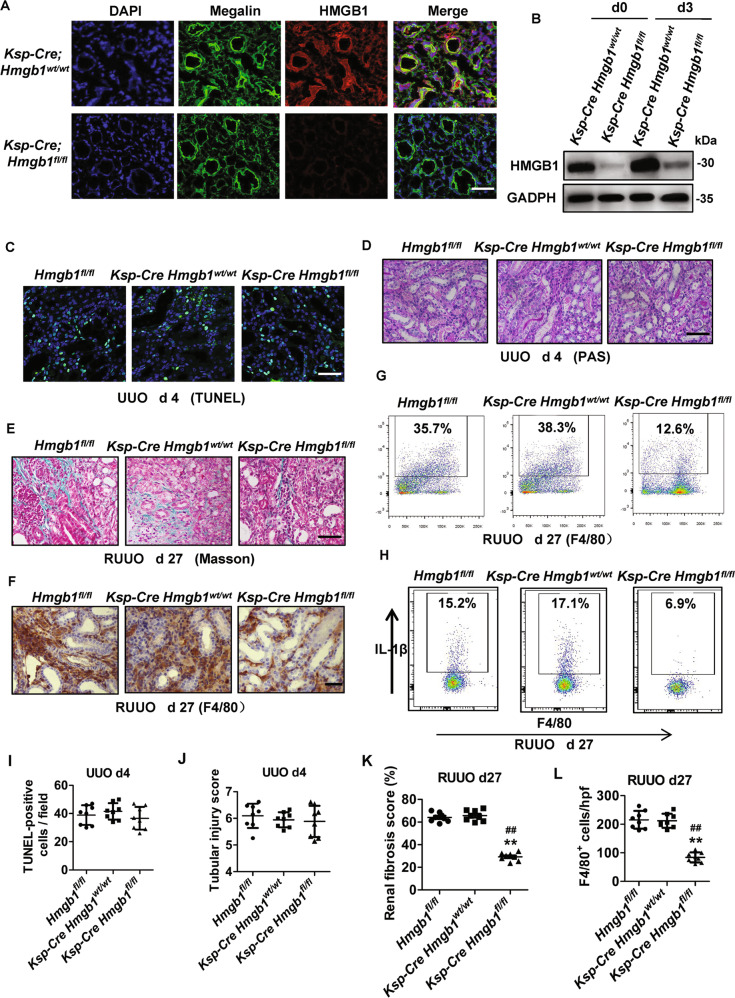
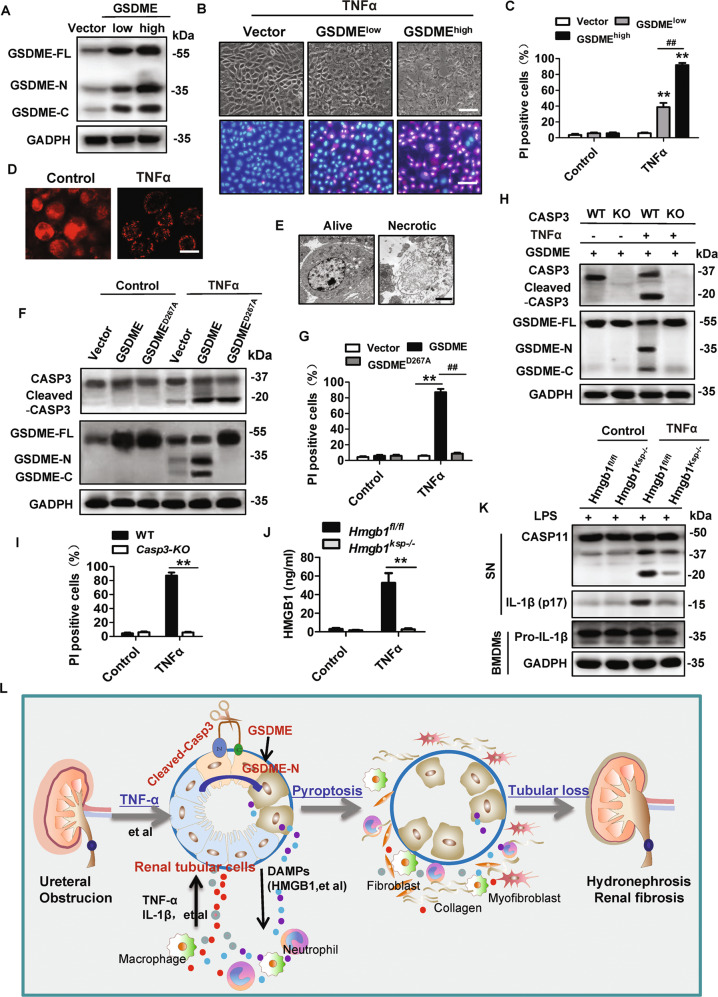
Renal tubular cell (RTC) death and inflammation contribute to the progression of obstructive nephropathy, but its underlying mechanisms have not been fully elucidated. Here, we showed that Gasdermin E (GSDME) expression level and GSDME-N domain generation determined the RTC fate response to TNFα under the condition of oxygen-glucose-serum deprivation. Deletion of Caspase-3 (Casp3) or Gsdme alleviated renal tubule damage and inflammation and finally prevented the development of hydronephrosis and kidney fibrosis after ureteral obstruction. Using bone marrow transplantation and cell type-specific Casp3 knockout mice, we demonstrated that Casp3/GSDME-mediated pyroptosis in renal parenchymal cells, but not in hematopoietic cells, played predominant roles in this process. We further showed that HMGB1 released from pyroptotic RTCs amplified inflammatory responses, which critically contributed to renal fibrogenesis. Specific deletion of Hmgb1 in RTCs alleviated caspase11 and IL-1β activation in macrophages. Collectively, our results uncovered that TNFα/Casp3/GSDME-mediated pyroptosis is responsible for the initiation of ureteral obstruction-induced renal tubule injury, which subsequentially contributes to the late-stage progression of hydronephrosis, inflammation, and fibrosis. This novel mechanism will provide valuable therapeutic insights for the treatment of obstructive nephropathy.


Conflict of interest statement

The authors declare no competing interests.

Figures

Fig. 1
Fig. 1. UUO- induced Casp3/GSDME activation and renal tubular cell necrosis increased in the kidney.
A Immunostaining images of kidney sections from mice. Kidneys were isolated from mice on day 3 after sham or UUO surgery. Sections were stained using an anti-GSDME antibody (red) and DAPI (blue). n = 6 for Sham group; n = 10 for UUO group. Scale bar = 50 μm. B Freshly isolated tubules were collected for western blot to analyze the cleavage of GSDME and Caspase3. Antibody against GAPDH was used as a loading control. n = 4. C Representative PAS staining of kidney sections from sham-group mice and mice on day 3 or 7 after UUO. Scale bar (black) = 100 μm, scale bar (blue) = 50 μm. D Histologic renal injury scores are shown in panel (C). Scores were obtained by counting the percentage of tubules that displayed tubular necrosis and tubular dilation. ##P < 0.01 vs. sham group. Sham group, n = 6; UUO groups, n = 10. E Representative electron micrographs of a tubular necrotic cell. n = 5. Scale bar = 2.5 μm. F Representative electron micrographs of mitochondrial damage in proximal tubular cells. n = 5. Scale bar = 1 μm. G The activation of caspase 8 and caspase 9 were analyzed in freshly isolated tubules by the western blot at the indicated time. n = 4.
Fig. 2
Fig. 2. Gsdme deficiency alleviated renal tubular damage, hydronephrosis, and fibrogenesis in the UUO model.
A, C Representative images of TUNEL staining of kidney sections from mice. Kidneys were isolated from wild-type mice (Gsdme+/+) and Gsdme-deficient mice (Gsdme/) on days 0, 3, or 7 after UUO as indicated. Merged images of TUNEL signal (green) and DAPI (blue) were shown. The number of TUNEL-positive cells was counted in ten random fields in the obstructive kidney per mice. Scale bar = 50 μm. B, D Representative images of PAS-stained kidney and the scores of tubular damage. Scale bar = 100 μm. AD, d 0 group, n = 6; UUO groups, n = 10. **P < 0.01 vs. Gsdme+/+ group. E The knockout efficiency of Gsdme was confirmed by western blot. n = 6. F Exemplary photographs were shown. n = 6. G Western blot analysis for α-smooth muscle actin (α-SMA) and type-I collagen (Col I) expression of kidney tissue lysates. Kidney tissue lysates were isolated on day 0, 3, 7, or 13 after UUO as indicated. GAPDH was used as a loading control. n = 4. H Representative images of Masson trichrome staining of kidney sections. Scale bar = 100 μm. I Quantification of fibrotic area evaluated by Masson trichrome staining shown in panel (H). J, L Representative images of immunofluorescence staining of kidney sections. Antibodies against α-SMA (I) and Col I (L) were used; DAPI was used for nuclear staining. Scale bar = 100 μm. K, M Quantification of αSMA (K) and Col I (M) expression by immunofluorescence. HM, Sham group, n = 6; UUO groups, n = 10. **P < 0.01 vs. Gsdme+/+ group.
Fig. 3
Fig. 3. Bone marrow-derived cells with Gsdme deficiency did not reduce renal tubular damage and renal fibrosis progression after UUO.
Chimeric mice were created, in which the BM was replaced with donor BM cells from WT or Gsdme-ko. A, E Representative images of PAS-stained obstructive kidney sections (Bar = 100 μM), and quantification of renal injury in BM chimeric mice at 3 days after UUO. n = 9. B, F Representative images of Masson trichrome-stained obstructive kidney sections (Bar = 100 μM), and assessment of renal fibrosis in BM chimeric mice at 13 days after UUO. n = 9. C, D Representative images of immunofluorescence staining with markers (α-SMA and Col-I) of Fibrosis. Scale Bar = 100 μM. G, H Quantification of α-SMA and Col I expression. n = 6. **P < 0.01 vs. WT to WT chimeric mice; ∆∆P < 0.01, vs. KO to WT chimeric mice. I Western blot analysis of protein expression of α-SMA and Col I. n = 4. WT wild type, KO Gsdme-ko.
Fig. 4
Fig. 4. Real tubular damage and fibrogenesis were reduced in UUO mice with specific deletion of Casp3 in renal tubules, but not in hematopoietic cells.
AF Kidneys were collected as the indicated time after UUO in Casp3+/+ and Casp3/ mice. AB Representative images of TUNEL staining and quantitative analysis of TUNEL-positive cells are shown in the obstructive kidney. Scale bar = 50 μM. CD Representative images of PAS-stained kidney sections and the scores of tubular damage. EF Representative images of Masson’s trichrome-stained obstructive kidney sections and quantification of renal fibrosis. AF n = 6 for Sham group; n = 10 for UUO group. Scale bar = 100 μM. **P < 0.01 vs. Casp3+/+ group. G, L Freshly isolated tubules were collected for western blot to analyze the expression and activation of GSDME and Casp3. n = 6. H, J Mice with specific Casp3 deletion in renal tubular cells (Ksp-cre×Casp3fl/fl) or hematopoietic cells (Vav-Cre×Casp3fl/fl) were subjected to sham operation or UUO as the indicated time. Representative PAS-stained images of kidney sections and quantification of renal tubular injury were shown. I, K Representative images of Masson’s trichrome-stained obstructive kidney sections and quantitative analysis of renal fibrosis. HK, n = 6 for Sham group; n = 10 for UUO group. Scale bar = 100 μM. **P < 0.01 vs. Casp3fl/fl UUO-group.
Fig. 5
Fig. 5. Gsdme and Casp3 deficiency improved renal function and inhibited fibrosis progression in the kidney with reversible unilateral ureteral obstruction (R-UUO).
A Scheme of the experimental design for the model of R-UUO. The right ureteral obstruction was performed on day 0, obstruction was relieved on day 6, and the left kidney was removed on day 12. BC Representative images of PAS and Masson’s trichrome-stained kidney sections subjected to R-UUO as depicted in WT, Gsdme-ko, Casp3-ko, Casp3fl/fl, Ksp-cre×Casp3wt/wt, and Ksp-cre×Casp3fl/fl mice. Scale bar = 100 μM. D, E, G, H Assessment of the renal tubular injury and renal fibrosis scores. n = 9. **P < 0.01, ##P < 0.01. F GFR (one kidney) per 100 g body was measured in WT, Gsdme-ko, and Casp3-ko mice. Basel GFR was obtained by the mice with the left kidney removed, but not undergoing with R-UUO procedure. Mice for measuring Basel GFR, n = 6. Mice for R-UUO model, n = 9. **P < 0.01 vs. Gsdme-ko group; ##P < 0.01 vs. Casp3-ko group. I GFR (one kidney) per 100 g body was measured in Casp3fl/fl, Ksp-cre×Casp3wt/wt, and Ksp-cre×Casp3fl/fl mice. GFR was obtained as described in (F). Mice for measuring Basel GFR, n = 6. Mice for R-UUO model, n = 9. **P < 0.01 vs. Casp3fl/fl group; ##P < 0.01 vs. Ksp-cre×Casp3wt/wt.
Fig. 6
Fig. 6. Gsdme−/−, Casp3−/− and Ksp-cre Casp3fl/fl mice displayed a reduction of renal tubulointerstitial inflammation post-UUO.
A, C Representative images of kidney tissues stained with the monocytes-macrophage marker F4/80+ and (B, D) leukocyte marker Ly6G by immunohistochemistry at 5 and 10 days following UUO. Scale bar = 100 μM. AD n = 10. EJ TNFα, IL-1β, and HMGB1 production were detected by ELISA. n = 6. **P < 0.01; ##P < 0.01. K, L Freshly renal tubules were isolated and HMGB1 expression was analyzed by western blot. n = 4.
Fig. 7
Fig. 7. Specific deletion Hmgb1 in renal tubular cells reduced fibrosis progression and inflammatory cells infiltration in the R-UUO model.
A Immunofluorescence staining for HMGB1 (red), Megalin (green), and DAPI (blue) in the kidney subjected to UUO for 3 days. The tubules were labeled with megalin. n = 6. Scale bar = 50 μm. B Western blot analyzed HMGB1 levels. n = 6. C, I Representative images of TUNEL staining and quantitative analysis of TUNEL-positive cells are shown in the obstructive kidney. Scale bar = 50 μM. n = 6. D, J Representative images of PAS-stained obstructive kidney sections and the scores of tubular damage. E, K Representative images of Masson’s trichrome-stained obstructive renal tissues and quantification of renal fibrosis. F, L Representative images immunohistochemistry staining with F4/80+ of kidney tissues and quantification of the number of F4/80-positive cells per hpf. DF, n = 8, Scale bar = 100 μM. **P < 0.01 vs. Hmgb1fl/fl group; ##P < 0.01 vs. Ksp-cre×Hmgb1wt/wt group. G, H The number of macrophages (F4/80+) and IL-1β secretion in the kidney were detected by flow cytometry. n = 6.
Fig. 8
Fig. 8. Caspase3 cleaved GSDME in over-expressing GSDME of renal tubular cells (RTCs) in vitro to induce cell death and release HMGB1.
AE RTCs from WT mice were infected with lentivirus encoding vector or GSDME for 44 h and then treated with or without 100 ng/ml TNFα for 24 h under the condition of oxygen-glucose-serum deprivation (OGSD). The control groups were treated with OGSD but without TNFα. Western blot analysis of GSDME expression in (A). PI (red) and Hoechst (blue) staining were used to assessed cell death cells in (B) (Scale bar = 100 μm). The percentage of PI-positive cells was counted as (C). n = 6. **P < 0.01 vs. Vector group; ##P < 0.01 vs. Low dose virus encoding GSDMD group. Cells were immunostained for GSDME and representative images obtained by confocal microscope were shown as (D) (Scale bar = 25 μm). Representative electron micrographs of live and necrotic RTCs are shown in (E) (Scale bar = 3 μm). FG RTCs from WT mice were infected with lentivirus encoding nothing (vector) or GSDMEwt, or GSDMED267A for 44 h and then treated as (A). Western blot analyzed the cleavage of GSDME as (F). PI-positive cells were counted in (G). n = 6. **P < 0.01, ##P < 0.01. HI RTCs from Casp3+/+ and Casp3/ mice were infected with lentivirus encoding GSDME for 44 h and then treated as (A). Western blot analyzed the cleavage of caspase-3 and GSDME (H) and cell death was evaluated by counting PI-positive cells (I). n = 6. **P < 0.01, ##P < 0.01. J RTCs were isolated from Hmgb1fl/fl or Hmgb1Ksp/ (Ksp-cre×Hmgb1fl/fl) mice, and then treated as (A). ELISA analyzed the level of HMGB1 in the extracellular supernatants. n = 6. **P < 0.01. K BMDMs from WT mice were pre-incubated with LPS (500 ng/ml) for 4 h and then were treated with culture supernatants for 24 h, which were collected from wild type or Hmgb1-deficient RTCs after treated as (A). Western blot analyzed the expression of caspase 11 and IL-1β. n = 4. L Schematic model: Caspase3/GSDME-mediated pyroptosis in the development of obstructive nephropathy.

References

    1. Stevens S. Obstructive kidney disease. Nurs Clin North Am. 2018;53:569–78. doi: 10.1016/j.cnur.2018.07.007. - DOI - PubMed
    1. Capelouto CC, Saltzman B. The pathophysiology of ureteral obstruction. J Endourol. 1993;7:93–103. doi: 10.1089/end.1993.7.93. - DOI - PubMed
    1. Park HC, Yasuda K, Ratliff B, Stoessel A, Sharkovska Y, Yamamoto I, et al. Postobstructive regeneration of kidney is derailed when surge in renal stem cells during course of unilateral ureteral obstruction is halted. Am J Physiol Ren Physiol. 2010;298:F357–364. doi: 10.1152/ajprenal.00542.2009. - DOI - PMC - PubMed
    1. Cochrane AL, Kett MM, Samuel CS, Campanale NV, Anderson WP, Hume DA, et al. Renal structural and functional repair in a mouse model of reversal of ureteral obstruction. J Am Soc Nephrol. 2005;16:3623–30. doi: 10.1681/ASN.2004090771. - DOI - PubMed
    1. Vilaysane A, Chun J, Seamone ME, Wang W, Chin R, Hirota S, et al. The NLRP3 inflammasome promotes renal inflammation and contributes to CKD. J Am Soc Nephrol. 2010;21:1732–44. doi: 10.1681/ASN.2010020143. - DOI - PMC - PubMed

Publication types

Substances