. 2021 Mar;27(3):426-433.
doi: 10.1038/s41591-021-01244-6. Epub 2021 Mar 4.

Transcriptional mediators of treatment resistance in lethal prostate cancer

Affiliations

Transcriptional mediators of treatment resistance in lethal prostate cancer

Meng Xiao He et al. Nat Med. 2021 Mar.

Abstract

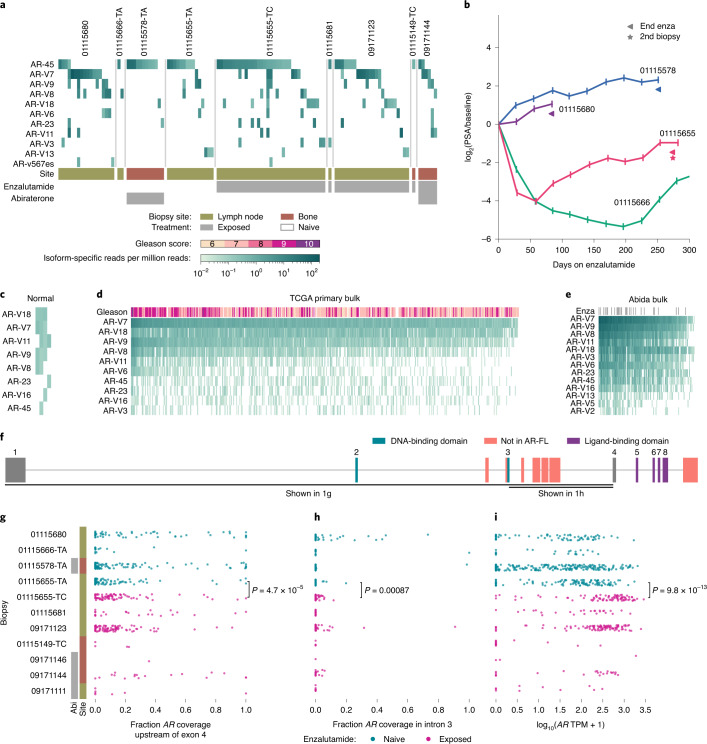
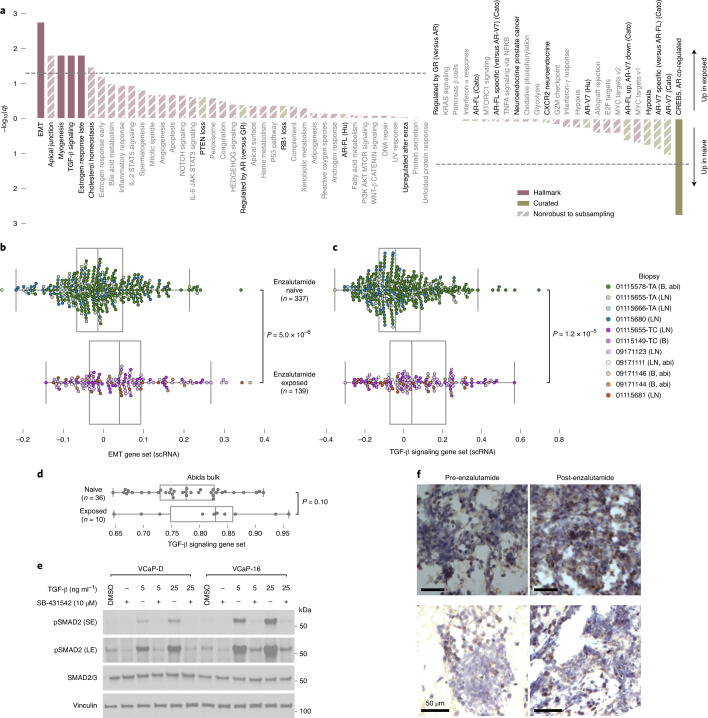
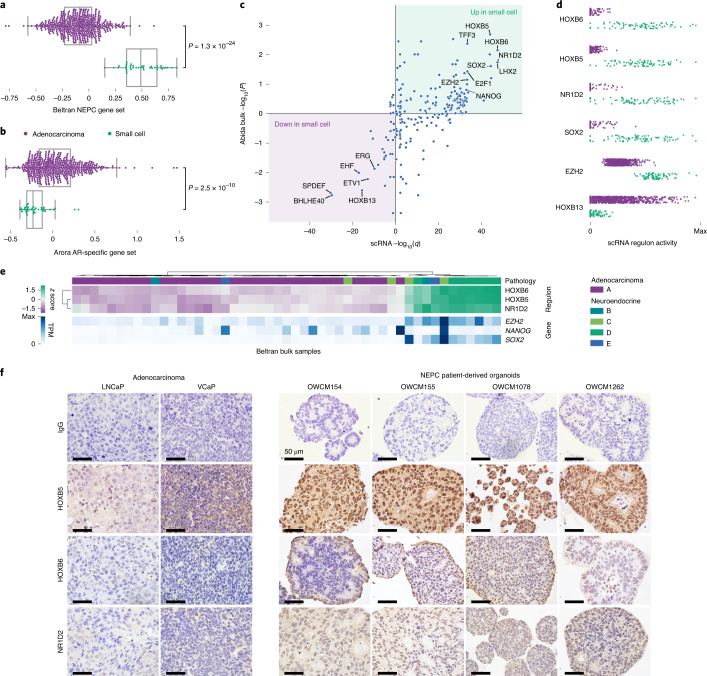
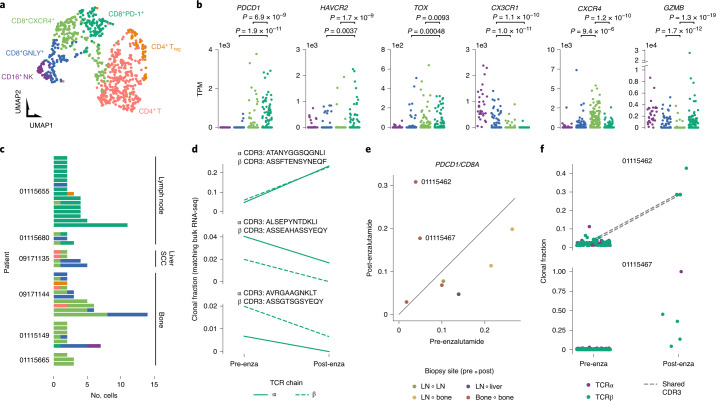
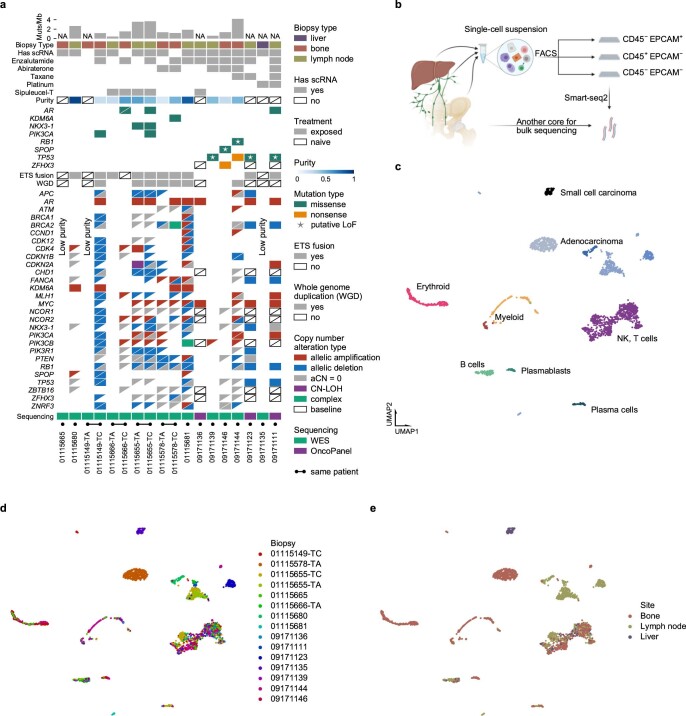
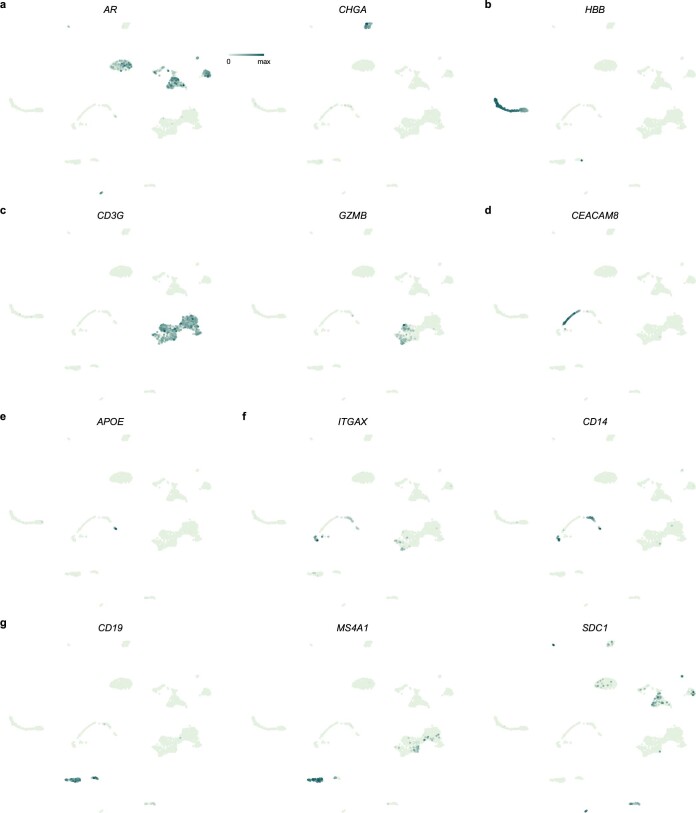
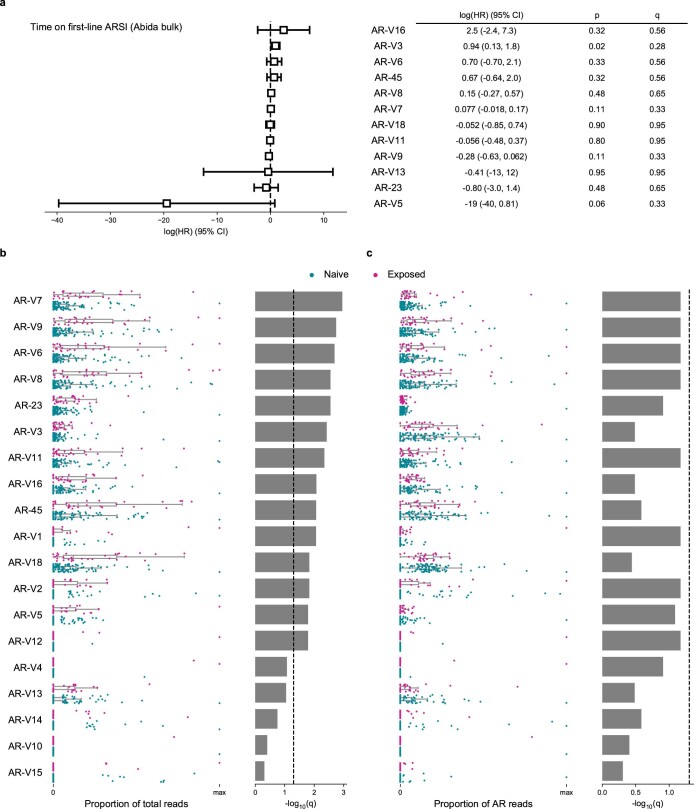
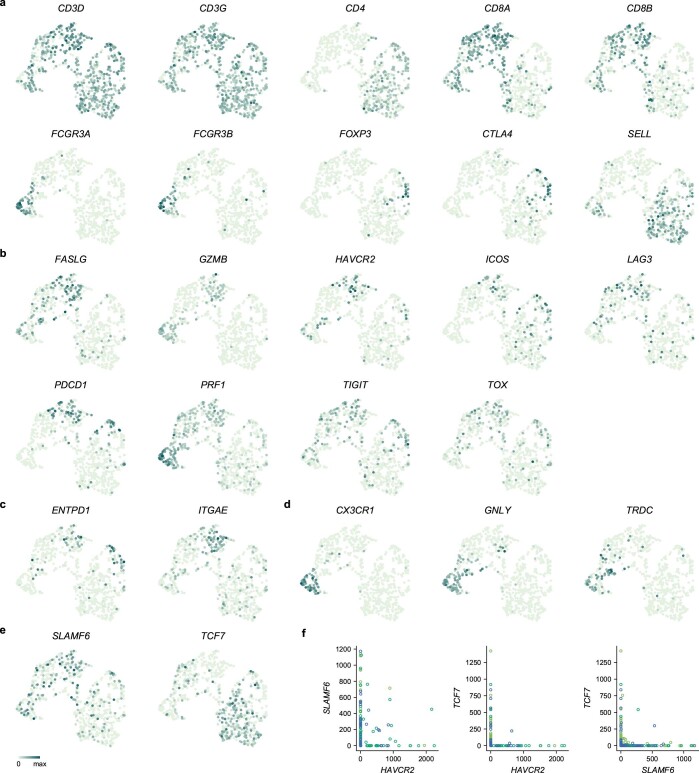
Metastatic castration-resistant prostate cancer is typically lethal, exhibiting intrinsic or acquired resistance to second-generation androgen-targeting therapies and minimal response to immune checkpoint inhibitors1. Cellular programs driving resistance in both cancer and immune cells remain poorly understood. We present single-cell transcriptomes from 14 patients with advanced prostate cancer, spanning all common metastatic sites. Irrespective of treatment exposure, adenocarcinoma cells pervasively coexpressed multiple androgen receptor isoforms, including truncated isoforms hypothesized to mediate resistance to androgen-targeting therapies2,3. Resistance to enzalutamide was associated with cancer cell-intrinsic epithelial-mesenchymal transition and transforming growth factor-β signaling. Small cell carcinoma cells exhibited divergent expression programs driven by transcriptional regulators promoting lineage plasticity and HOXB5, HOXB6 and NR1D2 (refs. 4-6). Additionally, a subset of patients had high expression of dysfunction markers on cytotoxic CD8+ T cells undergoing clonal expansion following enzalutamide treatment. Collectively, the transcriptional characterization of cancer and immune cells from human metastatic castration-resistant prostate cancer provides a basis for the development of therapeutic approaches complementing androgen signaling inhibition.


Conflict of interest statement

M.X.H. has been a consultant to Amplify Medicines and Ikena Oncology. Z.B. reports research support from Bristol-Meyers Squibb (BMS) and Genentech/imCORE unrelated to the current study. B.I. is a consultant for Merck and Volastra Therapeutics. D.L. reports funding by a postdoctoral fellowship from the Society for Immunotherapy of Cancer, which is funded in part by an educational grant from BMS. BMS has had no input into the conception, conduct or reporting of the submitted work. N.I.V. has served on an advisory board for Sanofi/Genzyme and is supported by a grant from the Society of Immunotherapy of Cancer that is funded in part by Genentech. L.F. reports receiving commercial research grants from AbbVie, Bavarian Nordic, BMS, Dendreon, Janssen, Merck and Roche/Genentech. S.P.B. served as an advisor for Sanofi. H.B. reports advisory/consulting from Janssen, Amgen, Astra Zeneca, Pfizer, Astellas, Sanofi Genzyme and research funding from Janssen, AbbVie Stemcentryx, Eli Lilly, Millenium and Astellas. A. Regev is a founder and equity holder of Celsius Therapeutics, an equity holder in Immunitas Therapeutics and, until 31 August 2020, was a SAB member of Syros Pharmaceuticals, Neogene Therapeutics, Asimov and Thermo Fisher Scientific; from 1 August 2020, A. Regev is an employee of Genentech. A. Rotem is an employee of Astra Zeneca and an equity holder in NucleAI and Celsius Therapeutics. M.-E.T. reports advisory relationships with Celgene, Janssen, GSK/Parexel, Bayer, Astra Zeneca, Riovant, AbbVie, Arcus, Astellas, Pfizer, Constellation, Summus Global, MH Life Sciences/Intellisphere, Targeted Oncology and Aptitude Health. E.M.V.A. reports advisory relationships and consulting with Tango Therapeutics, Genome Medical, Invitae, Illumina, Enara Bio, Manifold Bio and Janssen; research support from Novartis and BMS; equity in Tango Therapeutics, Genome Medical, Syapse, Manifold Bio and Enara Bio; and travel reimbursement from Roche and Genentech, outside the submitted work.

Figures

Fig. 1
Fig. 1. Complex AR isoform coexpression within individual cells and tumors is common across disease stages and resistance states.
a, Heat map displaying frequency of isoform-specific reads mapping to AR splice variants (Supplementary Fig. 1). Each column represents AR variants detected in a single cell, with only cells and isoforms that had at least one isoform-specific read shown. Short-read-based approaches cannot specifically identify full-length AR (Methods). b, PSA histories for the four patients for whom immediately pre-enzalutamide biopsies are shown in a. Patient 01115666 remained on enzalutamide beyond the 300 d shown. ce, Heat maps displaying frequency of isoform-specific reads in bulk RNA-seq of healthy prostate (n = 4), TCGA primary prostate adenocarcinoma (n = 496) and advanced prostate adenocarcinoma (n = 127, poly-A-sequenced only, enzalutamide and abiraterone-naive or enzalutamide-exposed). Gleason score and enzalutamide exposure status are shown for TCGA and Abida et al. cohorts, respectively. For each cohort, AR variants detected in at least 20% of samples are shown. f, Schematic representation of AR locus. Rectangles indicate exons. Exons corresponding to the full-length AR transcript are numbered, with exons comprising different functional domains colored. Select alternative exons included in AR splice variants are indicated. g, Fraction of total AR coverage upstream of exon 4 (including the DNA-binding domain but excluding the ligand-binding domain) in single cells. h, Fraction of total AR coverage in intron 3 (including multiple cryptic/alternative exons included in truncated splice variants) in single cells. i, Total AR expression in single cells. gi, P value compares cells before (n = 112) and after (n = 83) enzalutamide treatment for patient 01115655 (two-sided Mann–Whitney U-test).
Fig. 2
Fig. 2. Enzalutamide-exposed adenocarcinoma cells upregulate expression programs associated with EMT and TGF-β signaling.
a, Comparison of gene set expression scores in enzalutamide-exposed versus naive adenocarcinoma cells. Gene sets included include the MSigDB hallmark collection and literature-curated gene sets hypothesized to be related to enzalutamide resistance (Supplementary Table 5). q values from Benjamini–Hochberg adjustment of P values from two-sided Mann–Whitney U-tests (Supplementary Table 6). The broken lines indicate q = 0.05. Only G1 cells were included in analyses. Results shown are the median of a subsampling procedure designed to even out representation of cells from different biopsies. Each subsample included 67 exposed and 76 naive cells. Hashed bars correspond to results that were nonrobust in an additional leave-one-sample-out sampling step, suggesting that the effect is driven by patient-specific mechanisms. For details of subsampling used during statistical testing, see Methods and Supplementary Fig. 3. enza, enzalutamide; IL, interleukin; GR, glucocorticoid receptor. b,c, MSigDB hallmark EMT (b) and TGF-β signaling gene set expression scores (c) for individual cells (G1 only) collected before and after enzalutamide treatment. Each dot represents a single cell and is colored corresponding to biopsy. Biopsy clinical attributes are indicated in parentheses in legend (B, bone biopsy; LN, lymph node biopsy; abi, previous abiraterone exposure). P values from two-sided Mann–Whitney U-test, including all G1 cells. d, MSigDB hallmark TGF-β signaling gene set expression scores for bulk RNA-seq of mCRPC lymph node biopsies collected before and after enzalutamide treatment. Each dot represents a single tumor. P value from one-sided Mann–Whitney U-test. e, Western blot of SMAD2/3 and phospho-SMAD2 levels in enzalutamide-sensitive VCaP-D and enzalutamide-resistant VCaP-16. Cells were grown in basal maintenance medium with 0.5% FBS for 48 h, then treated for 2 h with the TGF-β receptor inhibitor SB-431542, recombinant TGFβ-1 protein or a combination of both. Cells treated with SB-431542 were pretreated for 24 h with SB-431542 before addition of recombinant TGFβ-1 protein. SE, short exposure; LE, long exposure. For uncropped images and both sets of vinculin loading controls, see Source Data. DMSO, dimethylsulfoxide. f, Immunohistochemical staining of phospho-SMAD2 in longitudinal biopsies from two patients immediately before and after enzalutamide treatment. Each row corresponds to one patient. All biopsies are from bone metastases. Scale bars, 50 μm. Box plots are represented by center line, median; box limits, upper and lower quartiles; whiskers extend at most 1.5× interquartile range past upper and lower quartiles. Source data
Fig. 3
Fig. 3. Cancer cells from small cell carcinoma employ a highly divergent regulatory program compared to adenocarcinoma cells.
a,b, Gene set expression scores of single G1 cells using an expression signature of NEPC (a) and a set of genes under regulation by AR (b). Box plots include center line, median; box limits, upper and lower quartiles; whiskers extend at most 1.5× interquartile range past upper and lower quartiles; P values are from two-sided Mann–Whitney U-test. c, Inferred activity of regulons of different transcriptional regulators. x axis, q values from comparison of inferred regulon activity in cancer cells from small cell carcinoma (n = 76) versus cancer cells from adenocarcinomas (n = 188, sampled as described in Methods) (negative values indicate regulon is less active in small cell carcinoma; two-sided Mann–Whitney U-test, median outcome of sampling iterations (Methods) with Bonferroni FWER correction). y axis: P values (two-sided Mann–Whitney U-test, signed as previous) from comparison of expression scores of scRNA-derived regulons in bulk RNA-seq of small cell carcinomas (n = 8) versus adenocarcinomas (n = 18) from a published cohort. d, Regulon activity in single cells for select transcriptional regulators. e, Hierarchical clustering of bulk RNA-seq of a published cohort of prostate cancers of known histopathology based on expression of HOXB5, HOXB6 and NR1D2 regulons inferred from scRNA-seq. B–E correspond to different NEPC subtype labels from original publication. Expression levels of EZH2, NANOG and SOX2 are shown for reference but were not used in clustering (n = 34 adenocarcinoma, 15 NEPC). f, Immunohistochemical staining of HOXB5, HOXB6 and NR1D2 protein levels in two prostate adenocarcinoma xenografts (LNCaP and VCaP) and four NEPC patient-derived organoids. Scale bar, 50 μm.
Fig. 4
Fig. 4. Cytotoxic lymphocyte populations and clonal expansions in metastatic niches.
a, Subclustering of NK and T cells. Each dot represents a single cell projected onto uniform manifold approximation and projection (UMAP) space colored corresponding to clustering via the Louvain algorithm. Clusters are manually labeled with dominant phenotype/cell type from patterns of marker gene expression. Cluster colors are used throughout subpanels. b, Expression of select marker, effector and co-inhibitory receptor genes within cytotoxic clusters, CD16+ NK (n = 30), CD8+GNLY+ (n = 84), CD8+CXCR4+ (n = 157) and CD8+PD-1+ (n = 106). Nominal P values from a two-sided Mann–Whitney U-test are shown. TPM, transcripts per million. c, T cell clonotypes from scRNA-seq TCR reconstruction. Each bar represents cells sharing a reconstructed productive TCR CDR3 sequence. Bars are grouped by patient. SCC, small cell carcinoma. d, Changes in clonal fractions of cytotoxic T cell clonotypes in patient 01115655 following enzalutamide treatment. Each subplot corresponds to a single clonotype with TCRα and β CDR3 amino acid sequences paired from scRNA-seq. Clonal fractions for the same CDR3 sequences (matching at both nucleotide and amino acid level) inferred from TCR reconstruction in bulk RNA-seq are plotted. All detected single cells of the displayed clonotypes came from the CD8+PD-1+ T cell cluster. e, PDCD1 to CD8A expression ratio in bulk RNA-seq of paired biopsies from the same patient before and after enzalutamide treatment. Paired biopsies did not always derive from the same site; color of dots indicate biopsy site types. For patient 01115462, the pre-enzalutamide biopsy was collected from the sacrum and the post-enzalutamide biopsy was collected from a left ischial lesion. f, Expanded T cell clonotypes following enzalutamide in patients 01115462 and 01115467. Each dot represents a single CDR3 sequence detected in bulk RNA-seq. CDR3 sequences identified both before and after enzalutamide are connected by a broken gray line.
Extended Data Fig. 1
Extended Data Fig. 1. Cellular atlas of mCRPC.
a, Summary of clinical and select genomics features of patients and biopsies forming the study cohort. Each column represents a single biopsy. Where available, multiple biopsies from the same patient are displayed in adjacent columns. Patients are identified by numerical prefix, while suffixes after a dash, when present, identify biopsies from the same patient. Copy number calls based on whole exome sequencing (WES), but not OncoPanel, are allelic, with calls for the two alleles indicated by two triangles. In cases with whole genome doubling, it is possible for one allele to be amplified and one or both copies of the other allele to be lost. AR and KDM6A are on the X chromosome and so have only a single copy in these patients; they are represented with solid boxes for copy number status. Boxes with diagonal slashes indicate missing data, for example for genes not included in OncoPanel or for low tumor purity samples for which FACETS does not produce a purity estimate. Putative loss of function (LoF) missense mutations were annotated as LoF or likely LoF in OncoKB or mutated the same amino acid as a LoF mutation. b, Study design overview. Dissociated single cells were sorted to enrich for tumor (CD45- EPCAM+), immune (CD45+ EPCAM-), or other populations (CD45- EPCAM-). c, Projection of single-cell expression onto the first two dimensions of UMAP space. Each dot represents a single cell, and colors correspond to clusters identified by the Louvain algorithm. Clusters are manually labelled with dominant cell type(s) inferred from cluster-specific expression of marker genes. Cells colored corresponding to (d) biopsy of origin or (e) metastatic site. Non-malignant cells from different patients jointly cluster by cell type, while cancer cells from different patients largely form distinct clusters.
Extended Data Fig. 2
Extended Data Fig. 2. Marker gene expression used for cluster labeling.
Expression of select cell type marker genes for (a) prostate cancer cells (AR is expressed in adenocarcinoma, and CHGA is expressed in small cell carcinoma) (b) erythroid cells (c) T and NK cells (see also Extended Data Fig. 4) (d) neutrophils (e) macrophages (f) monocyte subsets, and (g) B lineage cells (see Methods for details on using combinations of markers to distinguish B cells, plasmablasts, and plasma cells). UMAP projections as in Extended Data Fig. 1c.
Extended Data Fig. 3
Extended Data Fig. 3. Association of AR variant expression with clinical features in advanced prostate cancer.
Analysis of isoform-specific read frequency in poly-A-sequenced samples with an adenocarcinoma histology from Abida et al. cohort. a, Summary of multivariate Cox proportional hazards analysis of time on first-line androgen receptor signaling inhibitor (ARSI; abiraterone or enzalutamide) using AR variant frequency (isoform-specific reads / million total reads) in pre-treatment ARSI-naïve samples (n = 46). AR variants detected in at least 20% of samples were included. 95% confidence intervals and p- values are unadjusted for multiple hypotheses. q values correspond to Benjamini-Hochberg FDR. Comparison of expression levels of AR variants measured as a proportion of (b) all reads or (c) AR reads in ARSI-naïve (n = 98) vs. enzalutamide-exposed patients (n = 29). In stripplots, each dot corresponds to a single tumor. Bar plots show q values from Benjamini-Hochberg adjustment of p values from two-sided Mann Whitney U tests. Dashed lines indicate q = 0.05. Boxplots: center line: median; box limits: upper and lower quartiles; whiskers extend at most 1.5x interquartile range past upper and lower quartiles.
Extended Data Fig. 4
Extended Data Fig. 4. Marker gene expression in NK and T cells.
Expression of (a) cell type markers, (b) dysfunction and activation markers, (c) markers of tumor-reactive cytotoxic cells, (d) genes expressed in a GNLY-expressing cytotoxic subset, and (e) genes reported to mark a progenitor population necessary for response after anti-PD-1 therapy in melanoma. Cells are projected onto UMAP space as in Fig. 4a. f, Scatterplots showing pairwise co-expression of HAVCR2, SLAMF6, and TCF7 in CD8+ T cells. Points are colored according to cluster membership as in Fig. 4a.
Extended Data Fig. 5
Extended Data Fig. 5. Germline heritability for prostate cancer is enriched near genes specifically expressed in prostate cancer cells.
a, Expression of a subset of a published set of prostate cancer risk genes that show cell type specificity (Methods) (b) LDSC-SEG enrichment of heritability for prostate cancer near genes specifically expressed in each cell type (compared to cell types in other cell type groups) (Methods). *: Benjamini-Hochberg FDR < 0.05.

Similar articles

Cited by

References

    1. Teo MY, Rathkopf DE, Kantoff P. Treatment of advanced prostate cancer. Annu Rev. Med. 2019;70:479–499. - PMC - PubMed
    1. Lu J, der Steen TV, Tindall DJ. Are androgen receptor variants a substitute for the full-length receptor? Nat. Rev. Urol. 2015;12:137–144. - PubMed
    1. Antonarakis ES, et al. AR-V7 and resistance to enzalutamide and abiraterone in prostate cancer. N. Engl. J. Med. 2014;371:1028–1038. - PMC - PubMed
    1. Borges GT, et al. Conversion of prostate adenocarcinoma to small cell carcinoma–like by reprogramming. J. Cell Physiol. 2016;231:2040–2047. - PubMed
    1. Mu P, et al. SOX2 promotes lineage plasticity and antiandrogen resistance in TP53- and RB1-deficient prostate cancer. Science. 2017;355:84–88. - PMC - PubMed

Publication types

MeSH terms