. 2021 Apr;27(4):717-726.
doi: 10.1038/s41591-021-01294-w. Epub 2021 Mar 4.

Resistance of SARS-CoV-2 variants to neutralization by monoclonal and serum-derived polyclonal antibodies

Affiliations

Resistance of SARS-CoV-2 variants to neutralization by monoclonal and serum-derived polyclonal antibodies

Rita E Chen et al. Nat Med. 2021 Apr.

Abstract

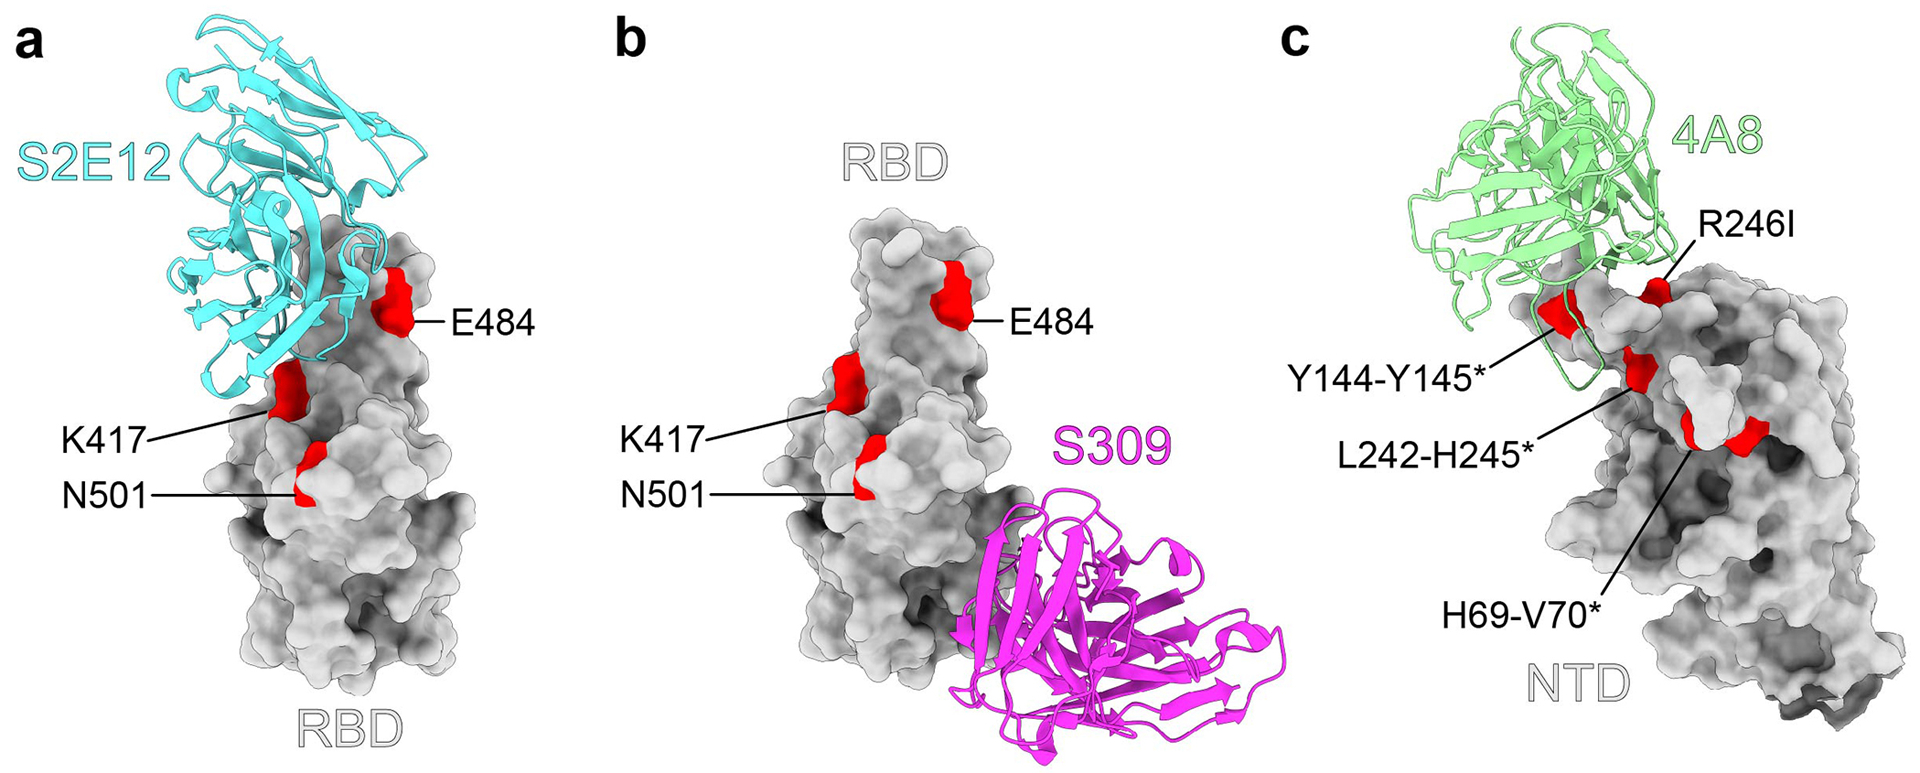
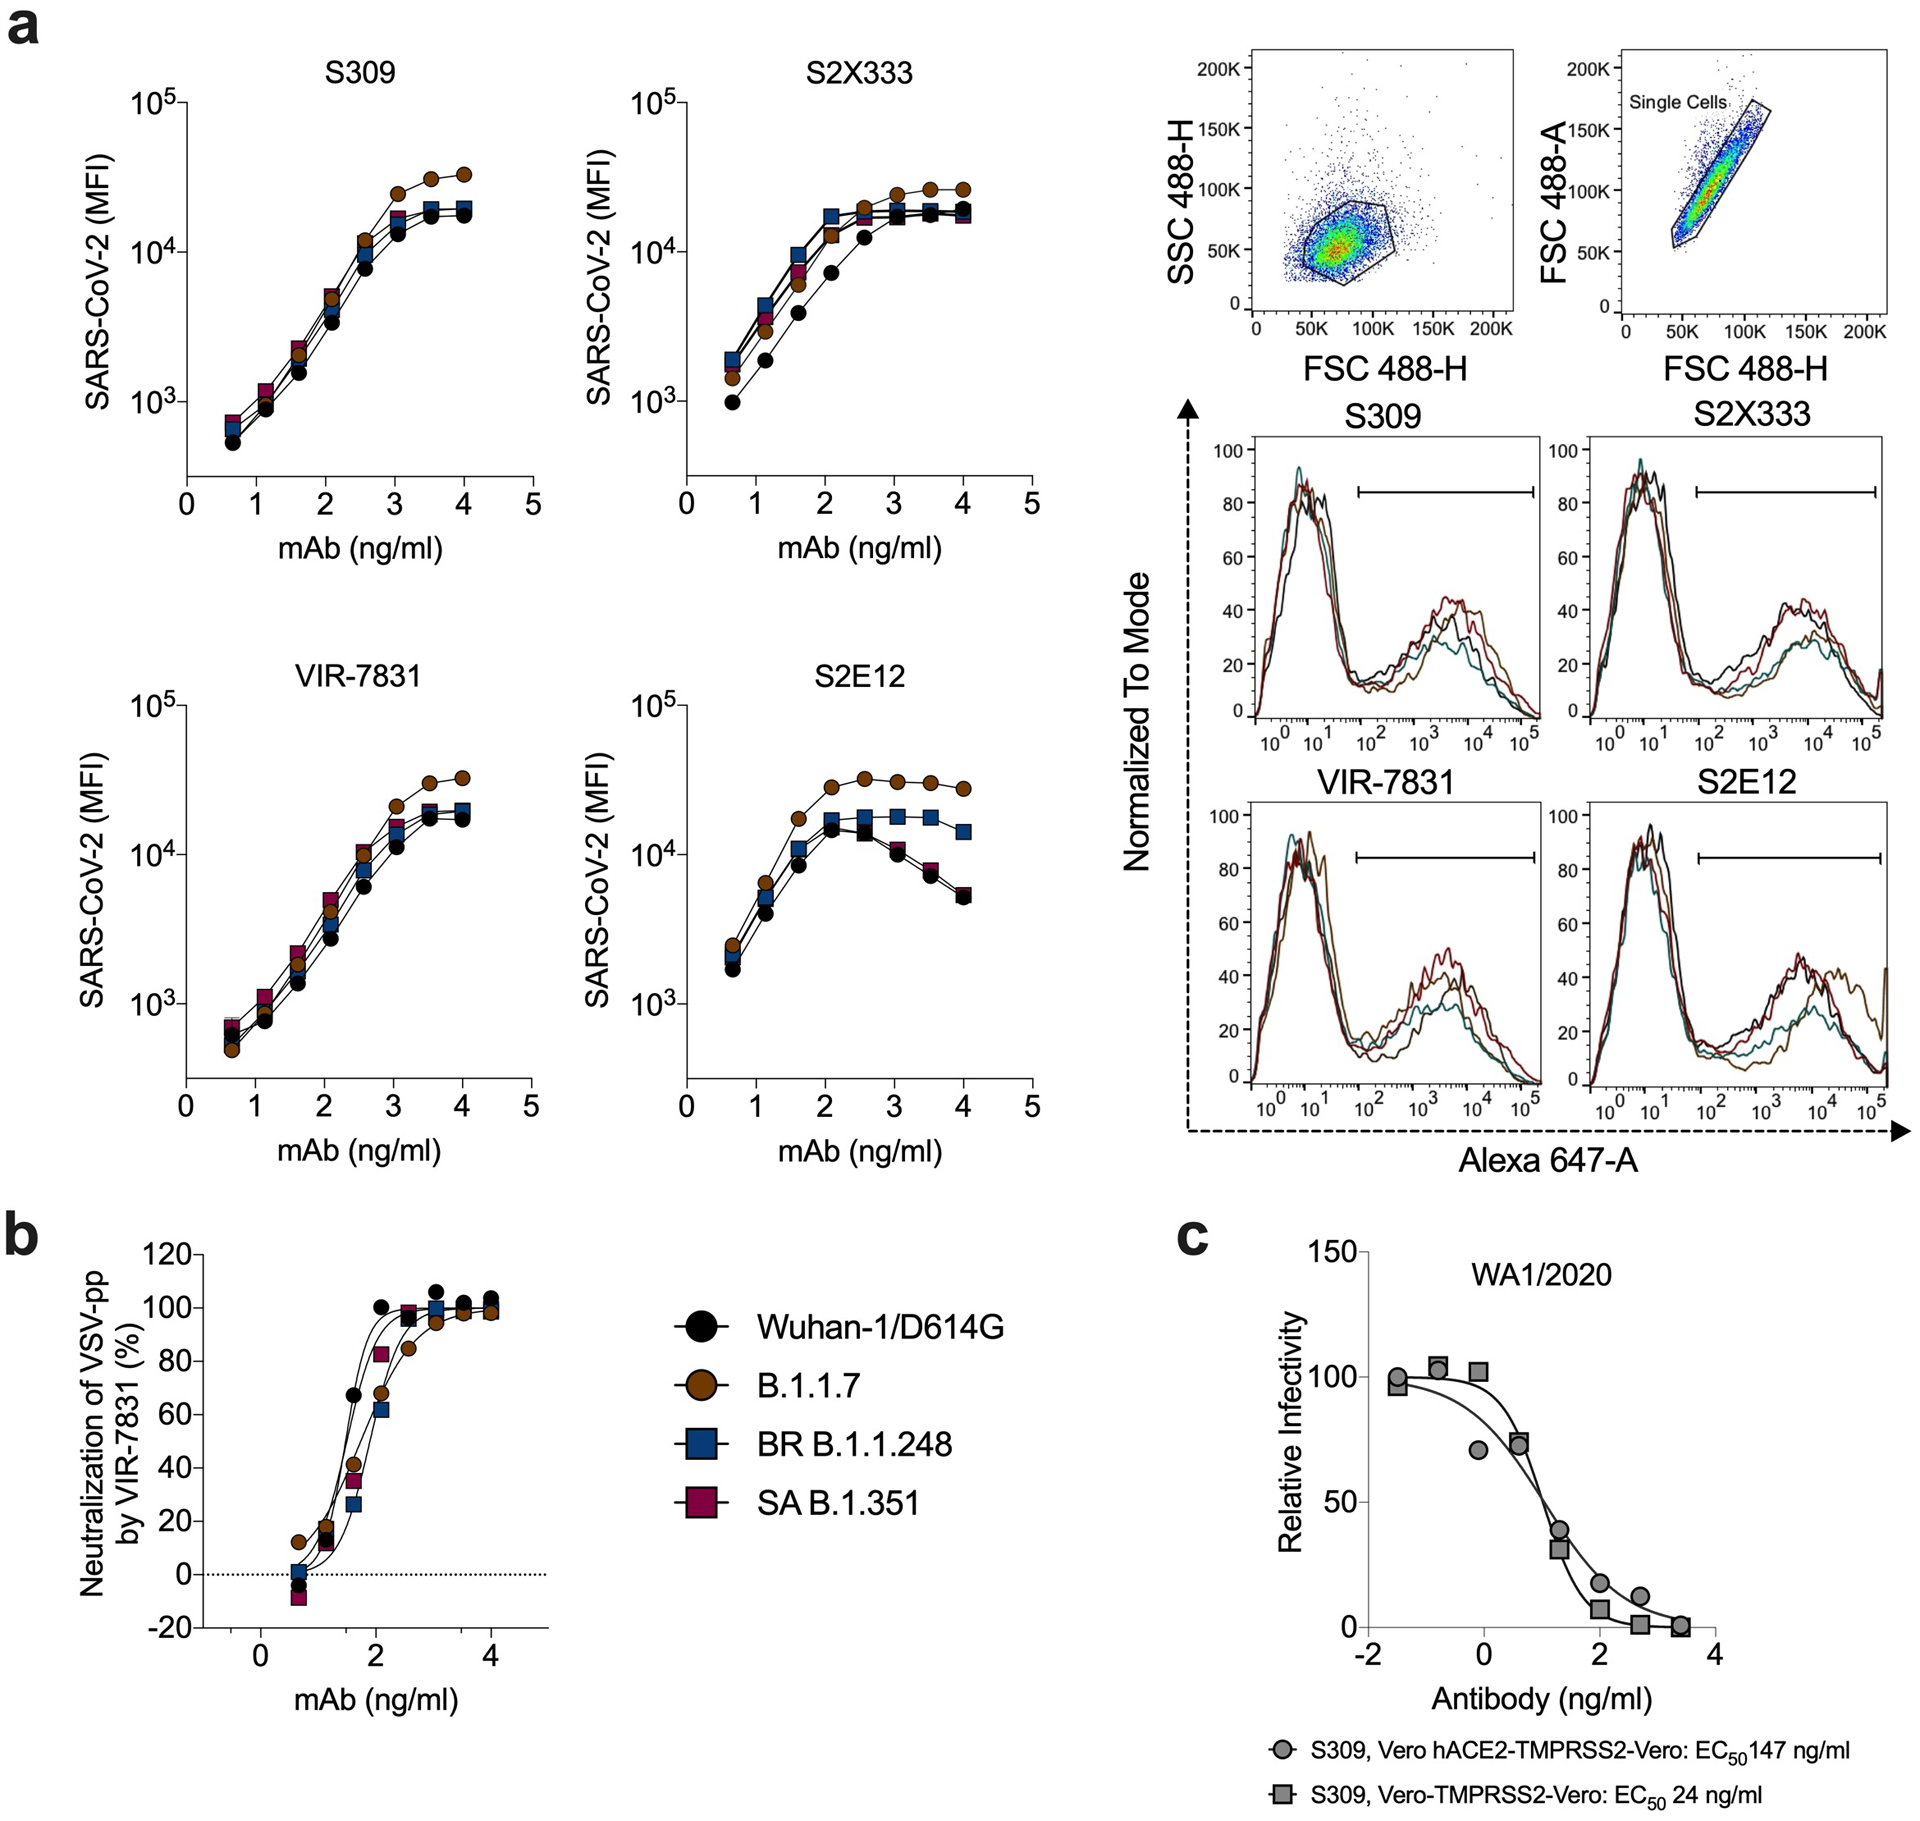
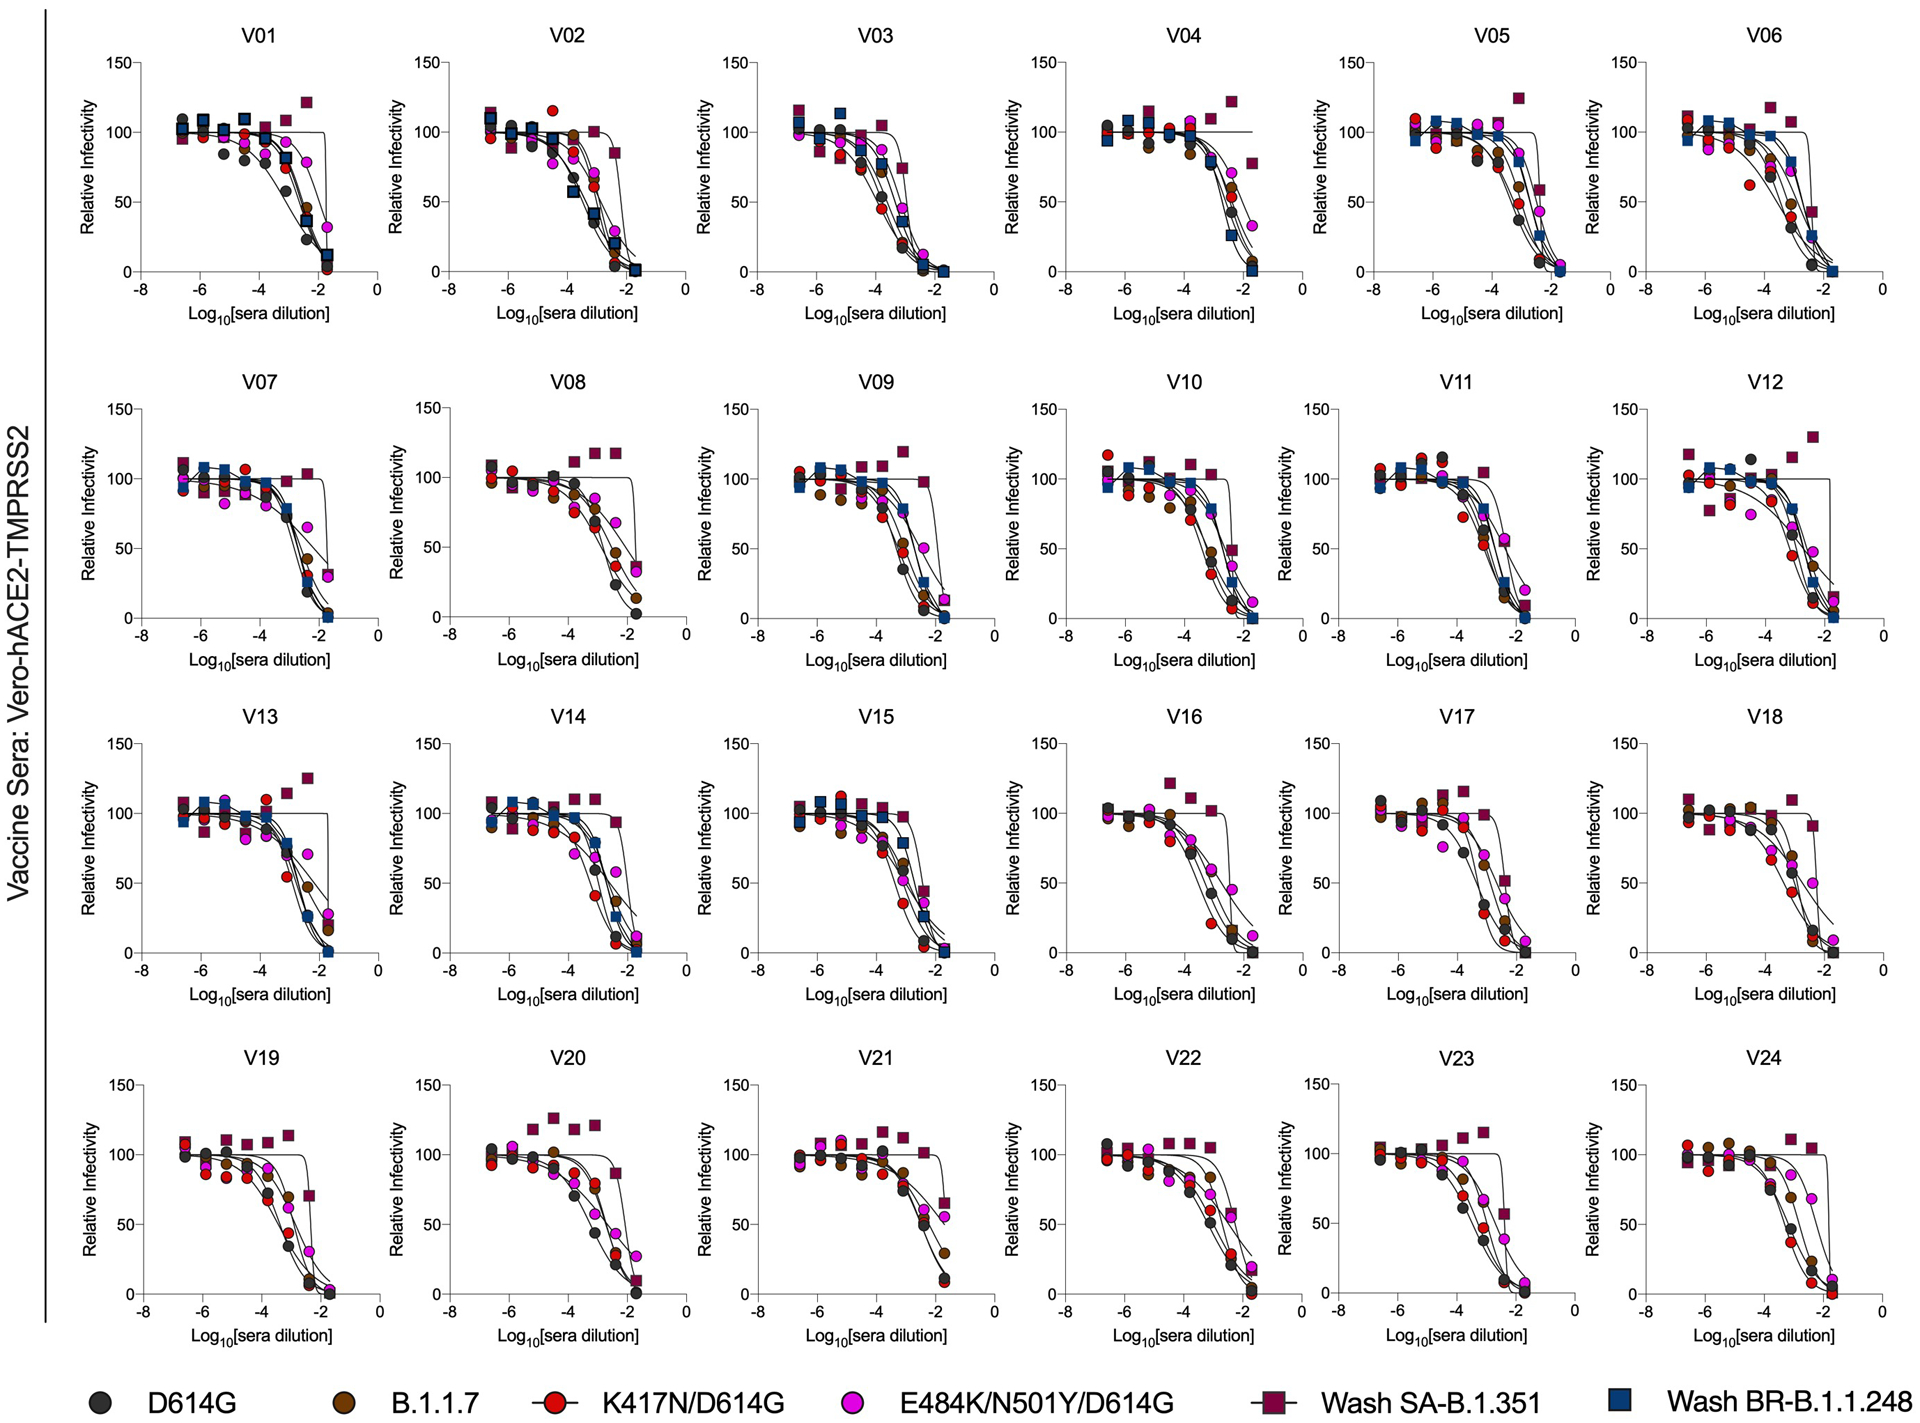
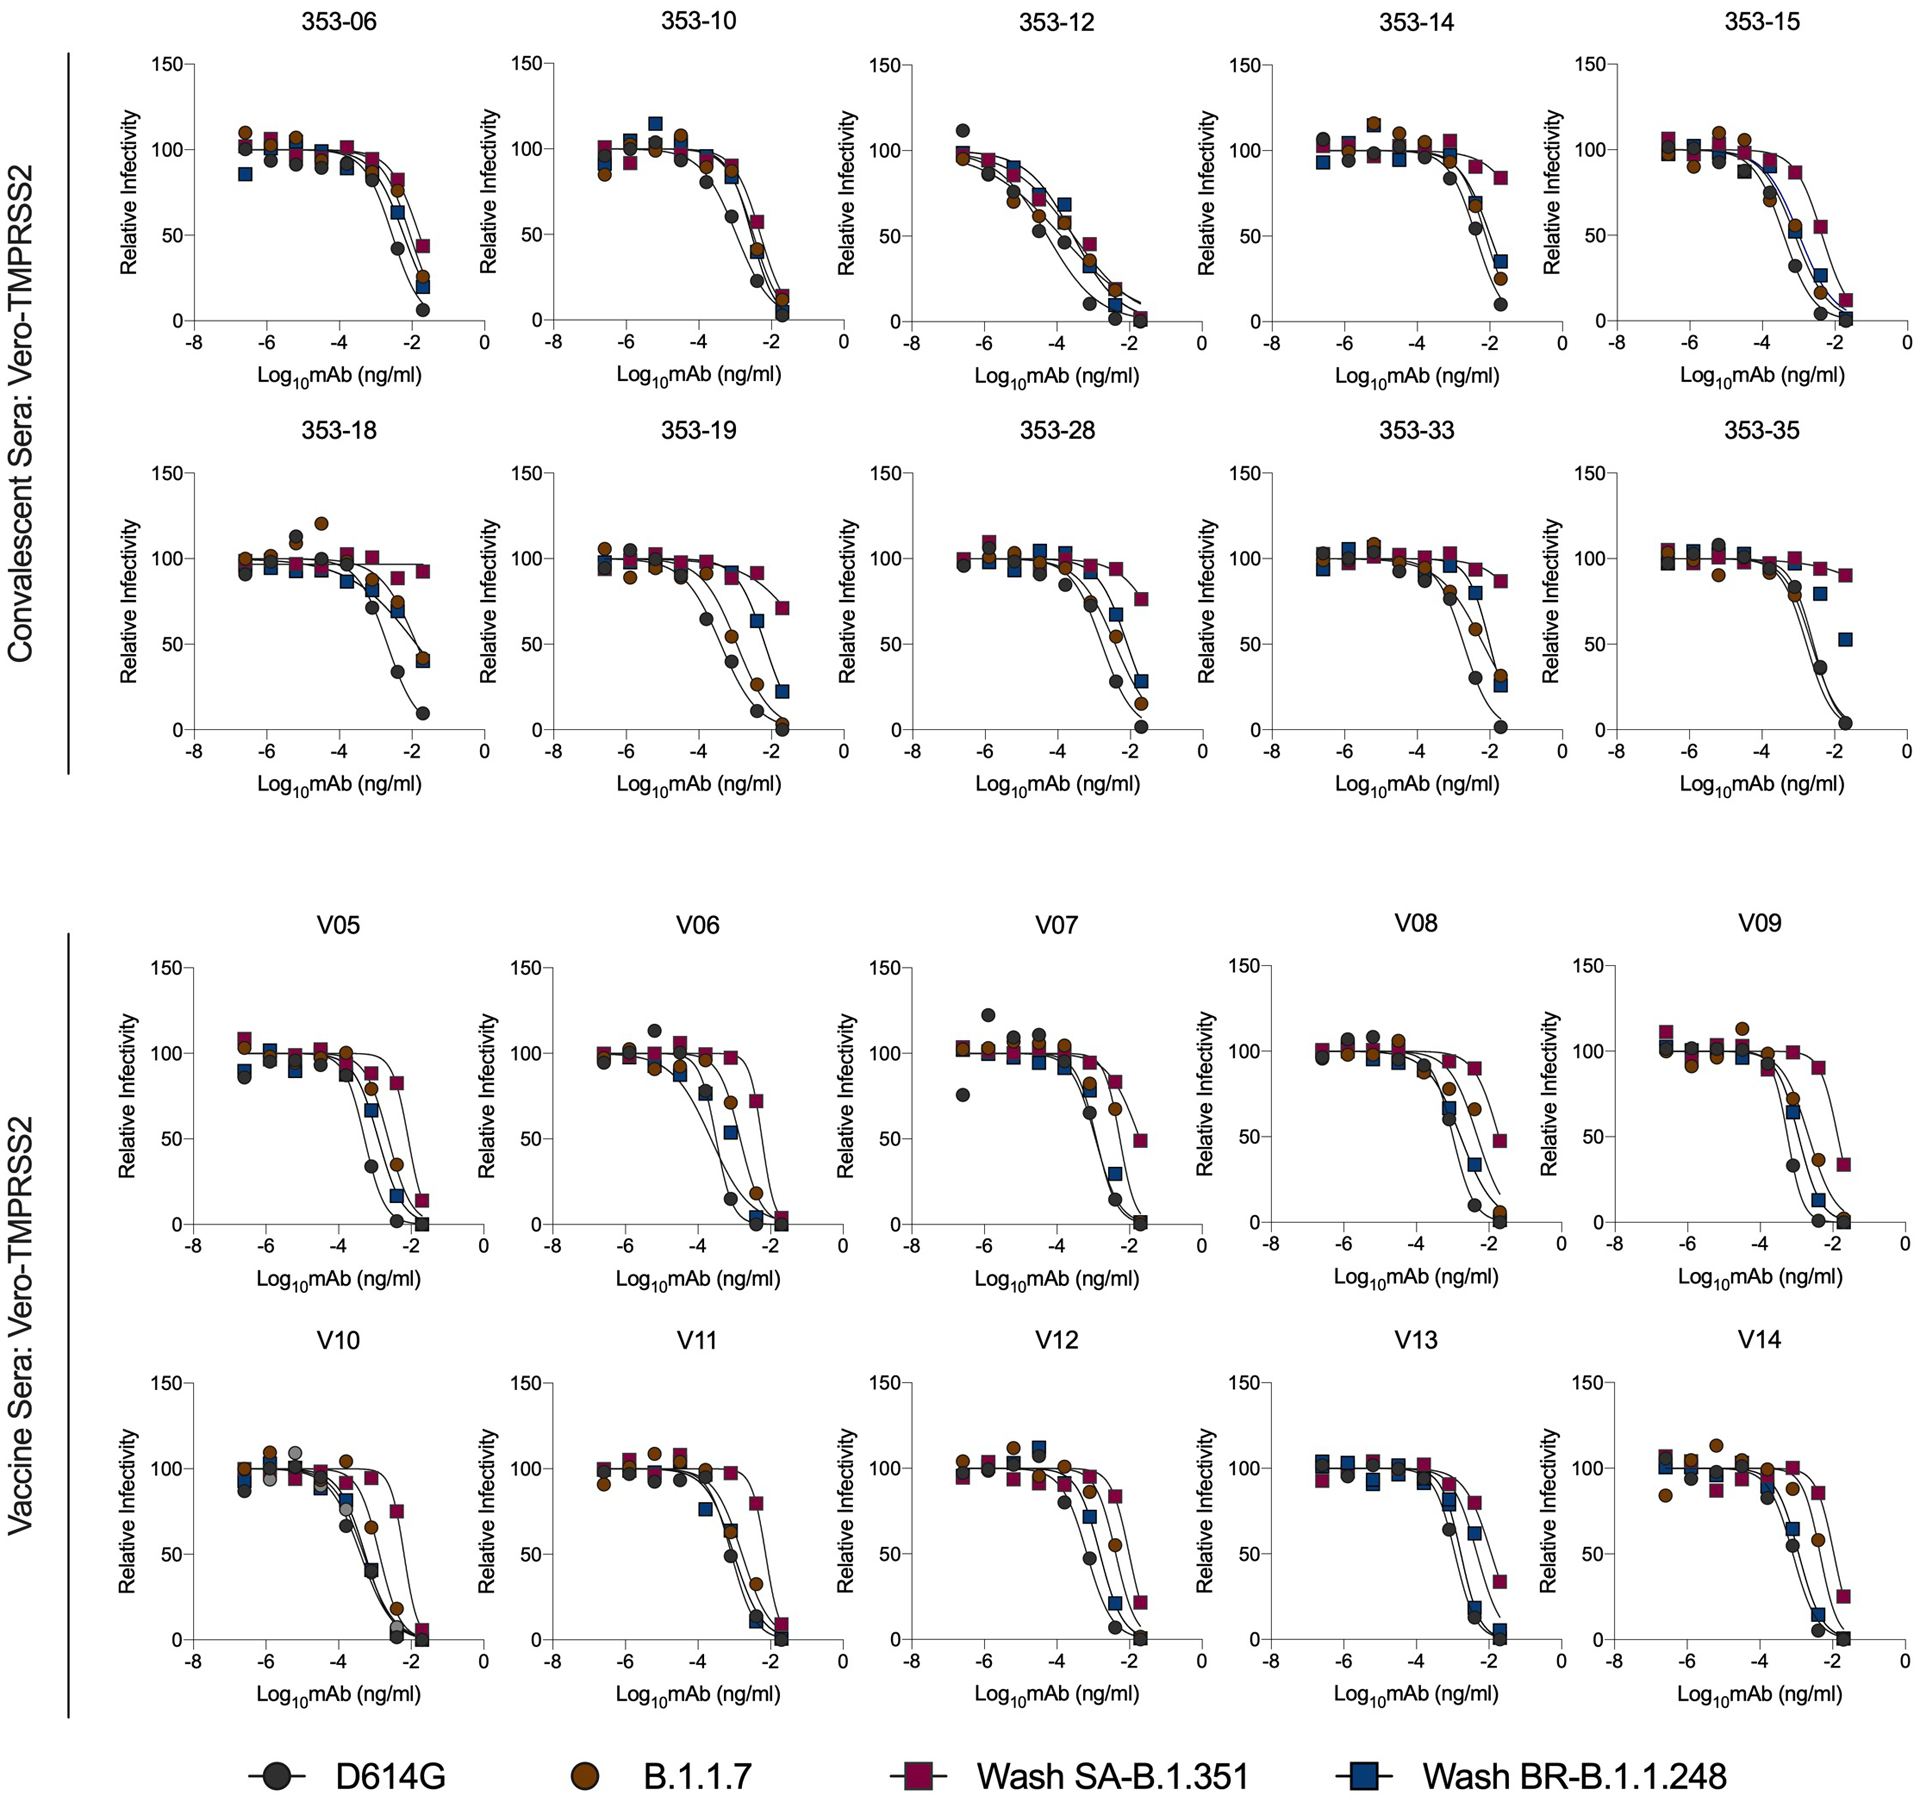
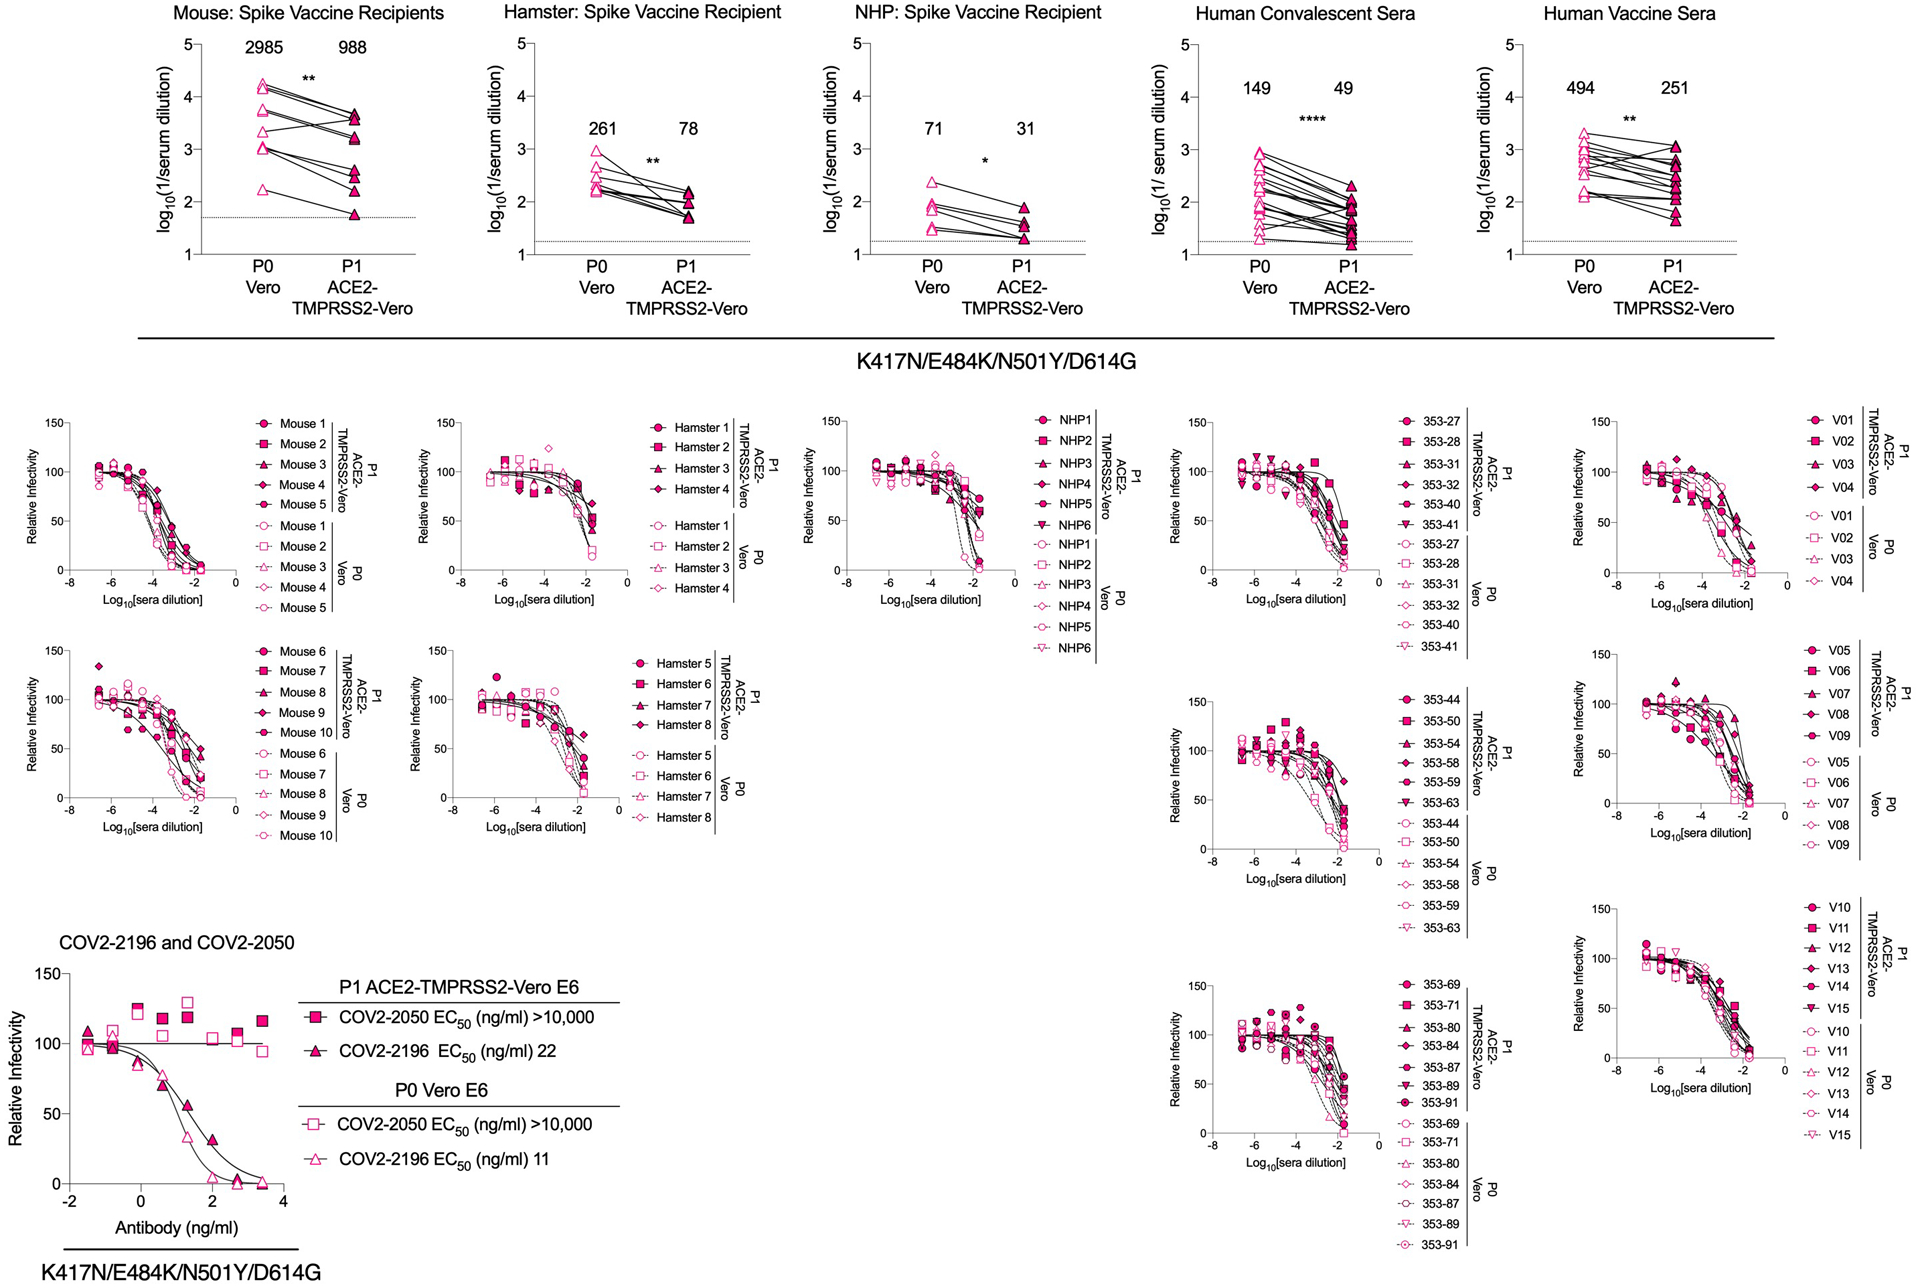
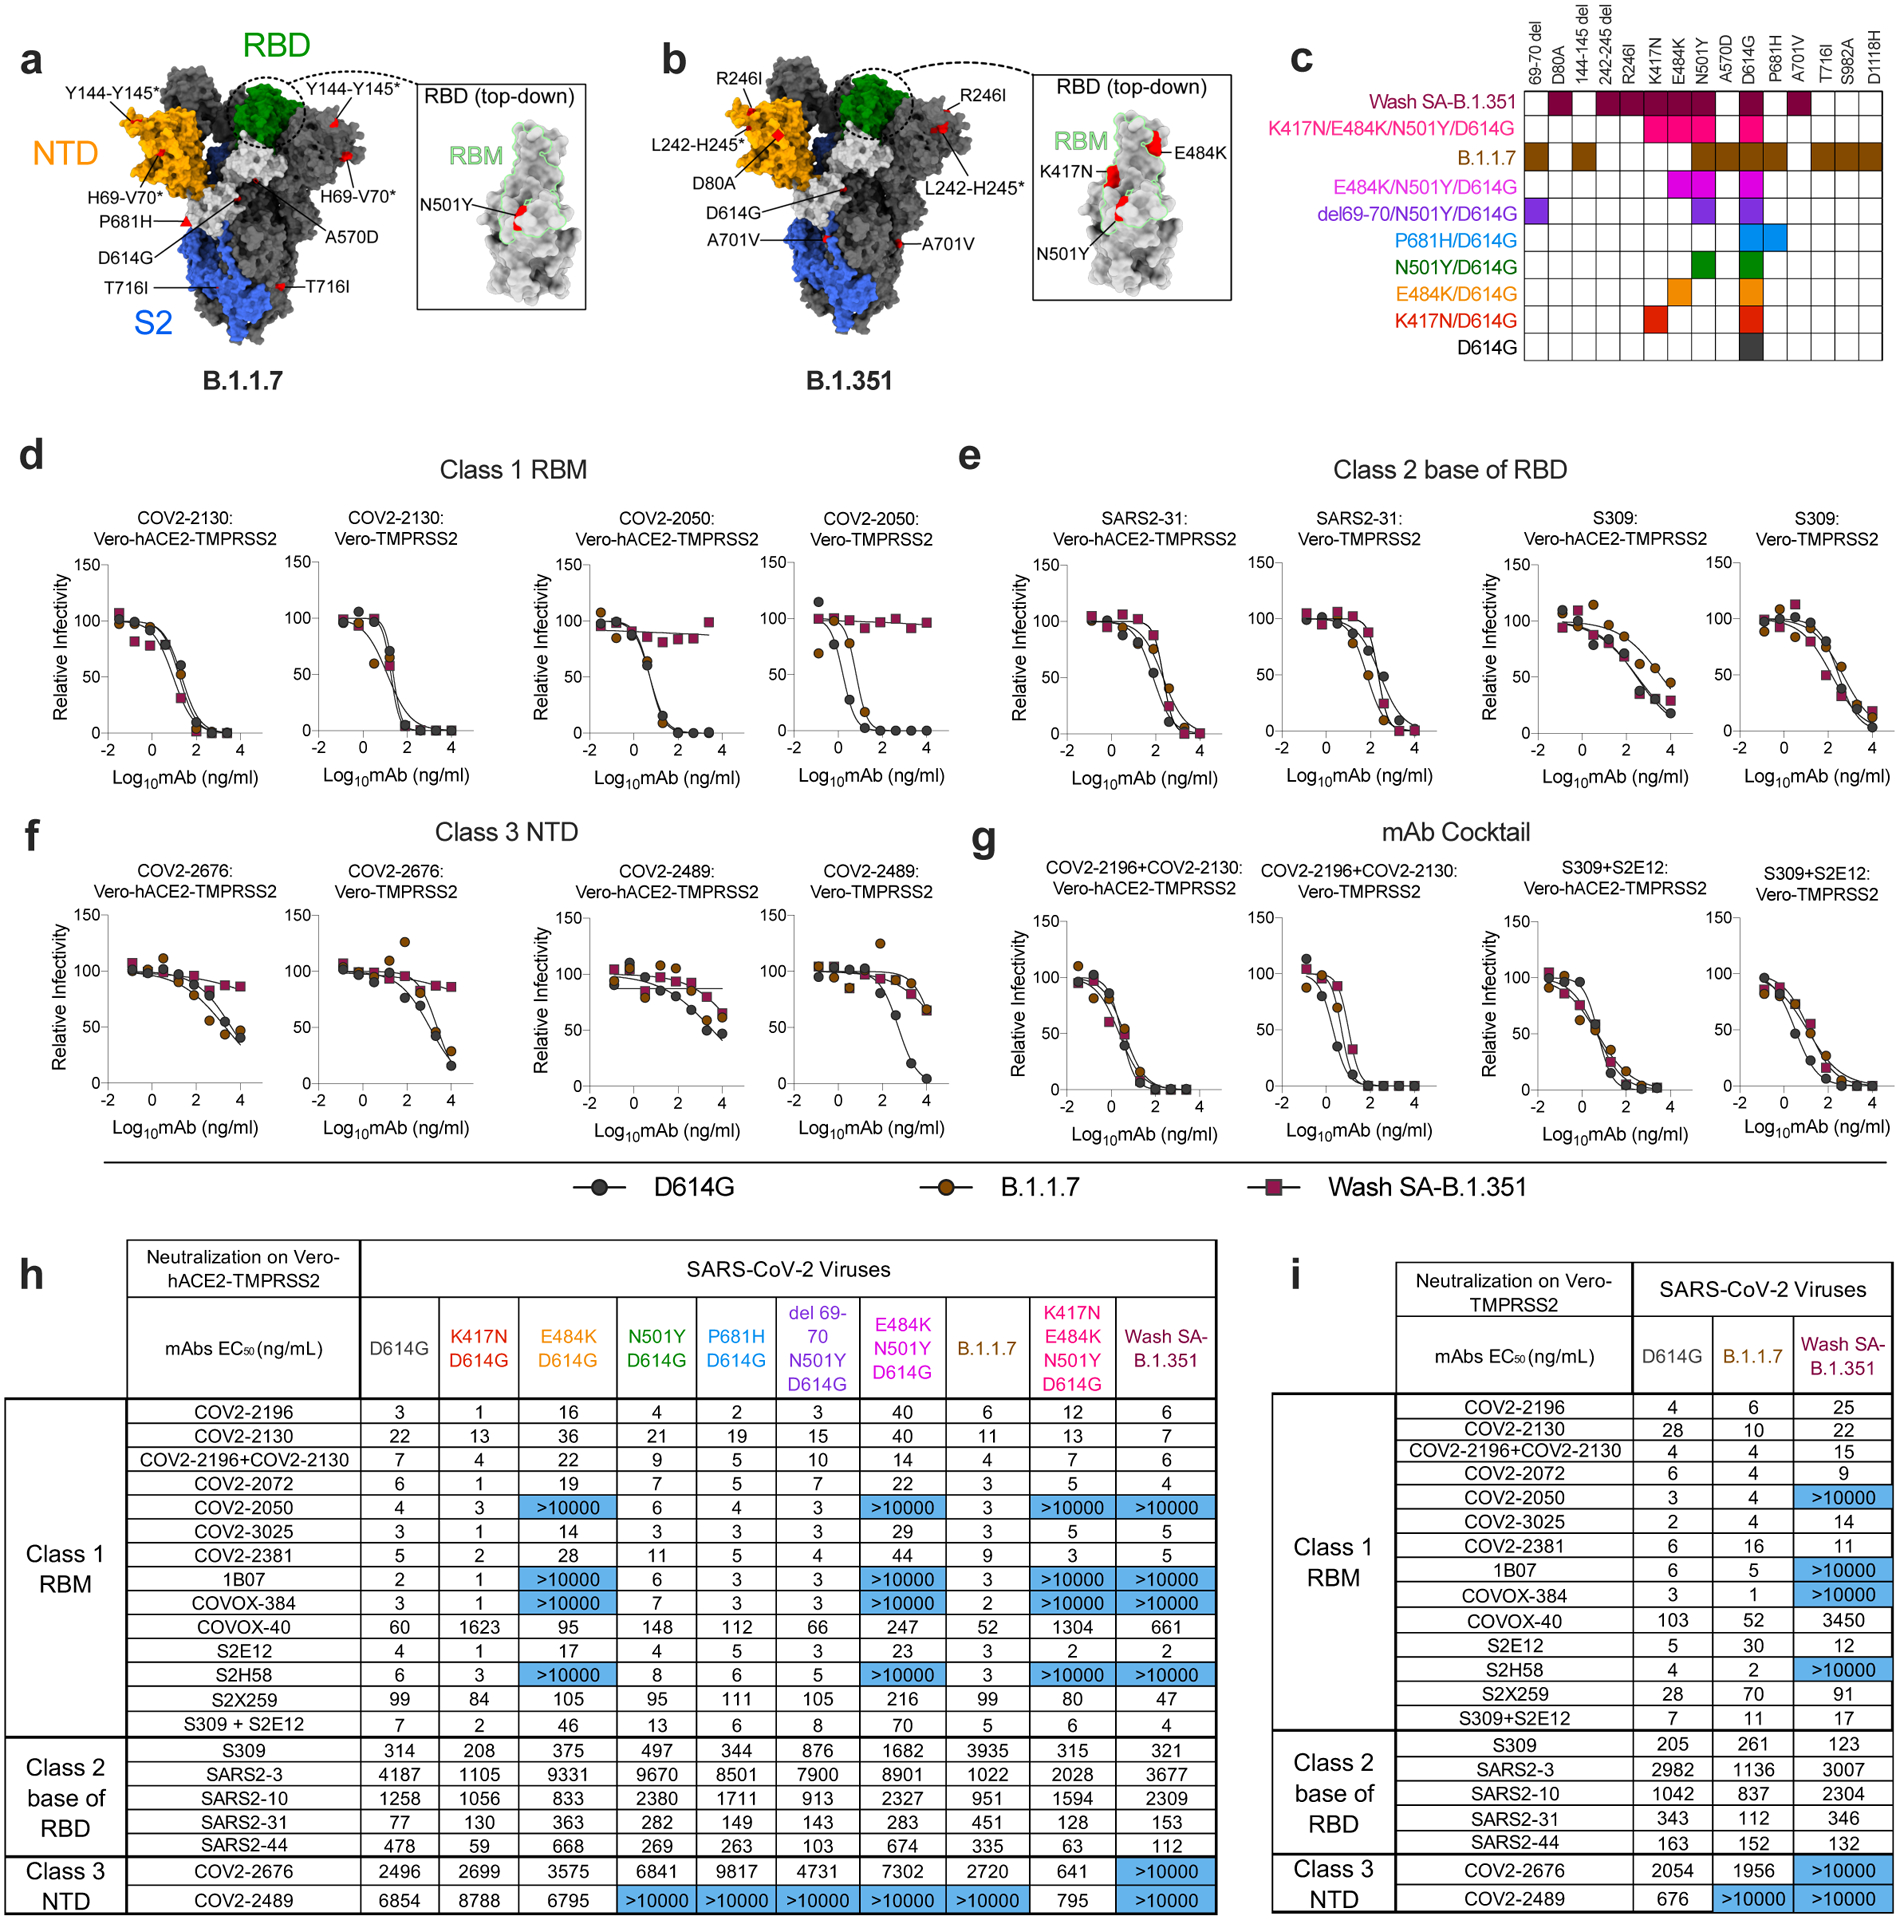
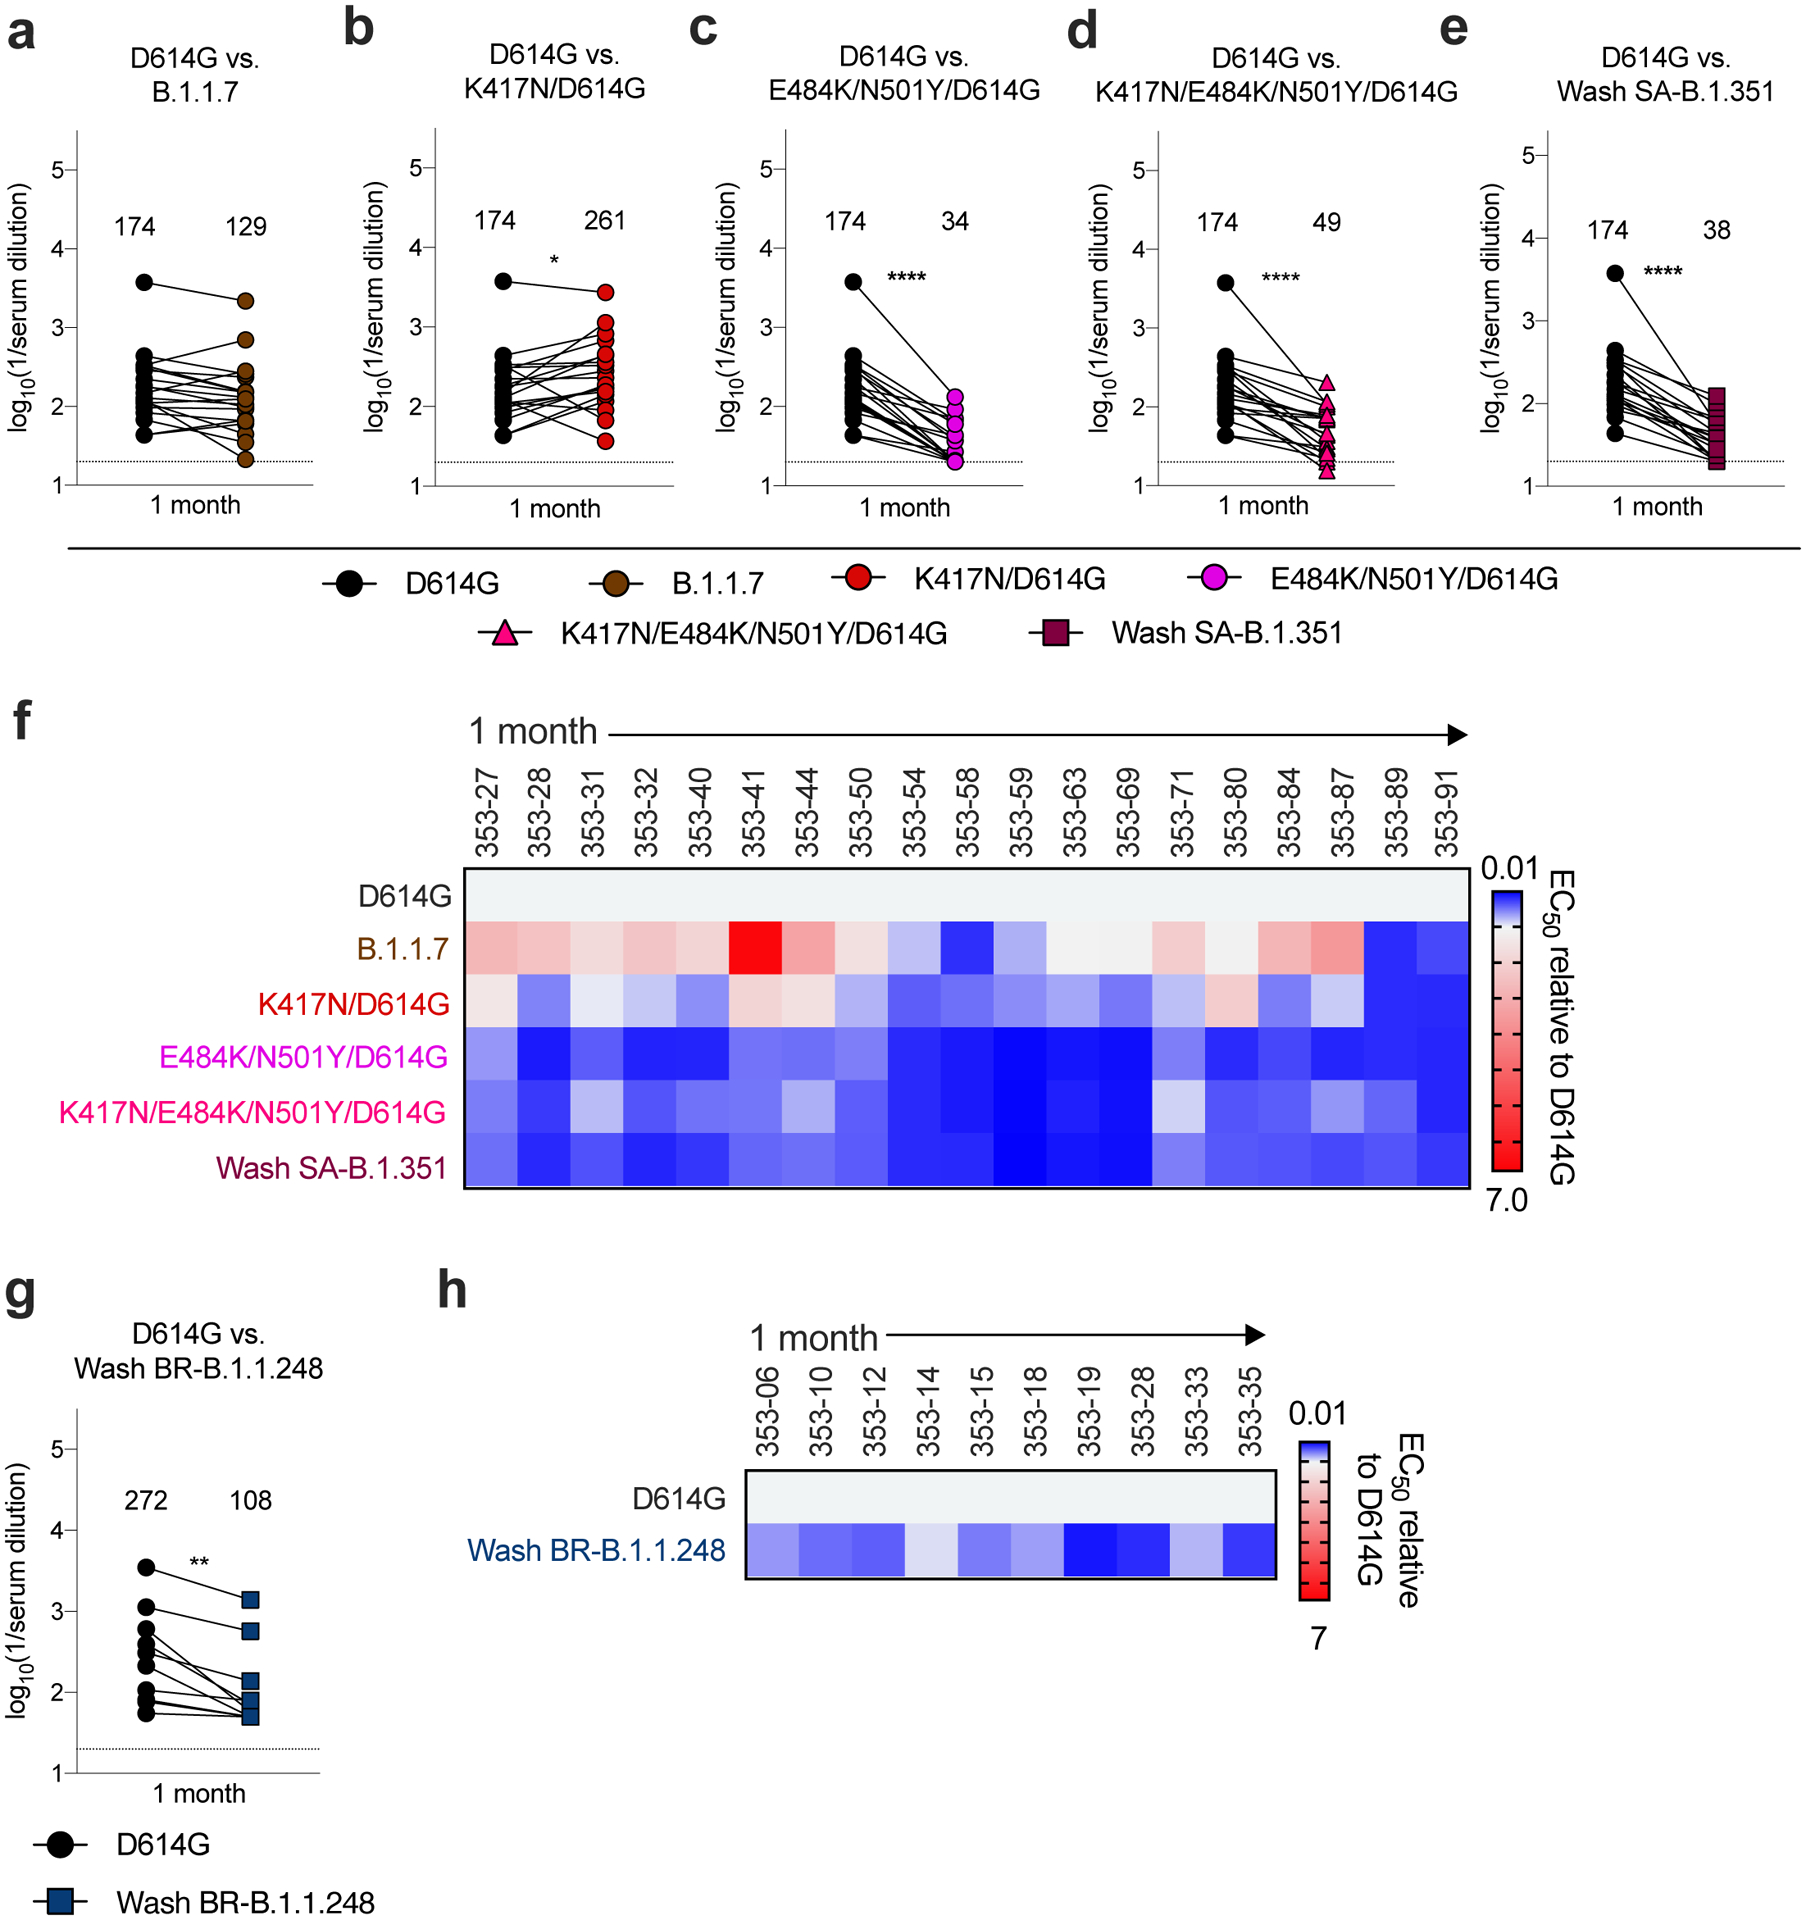
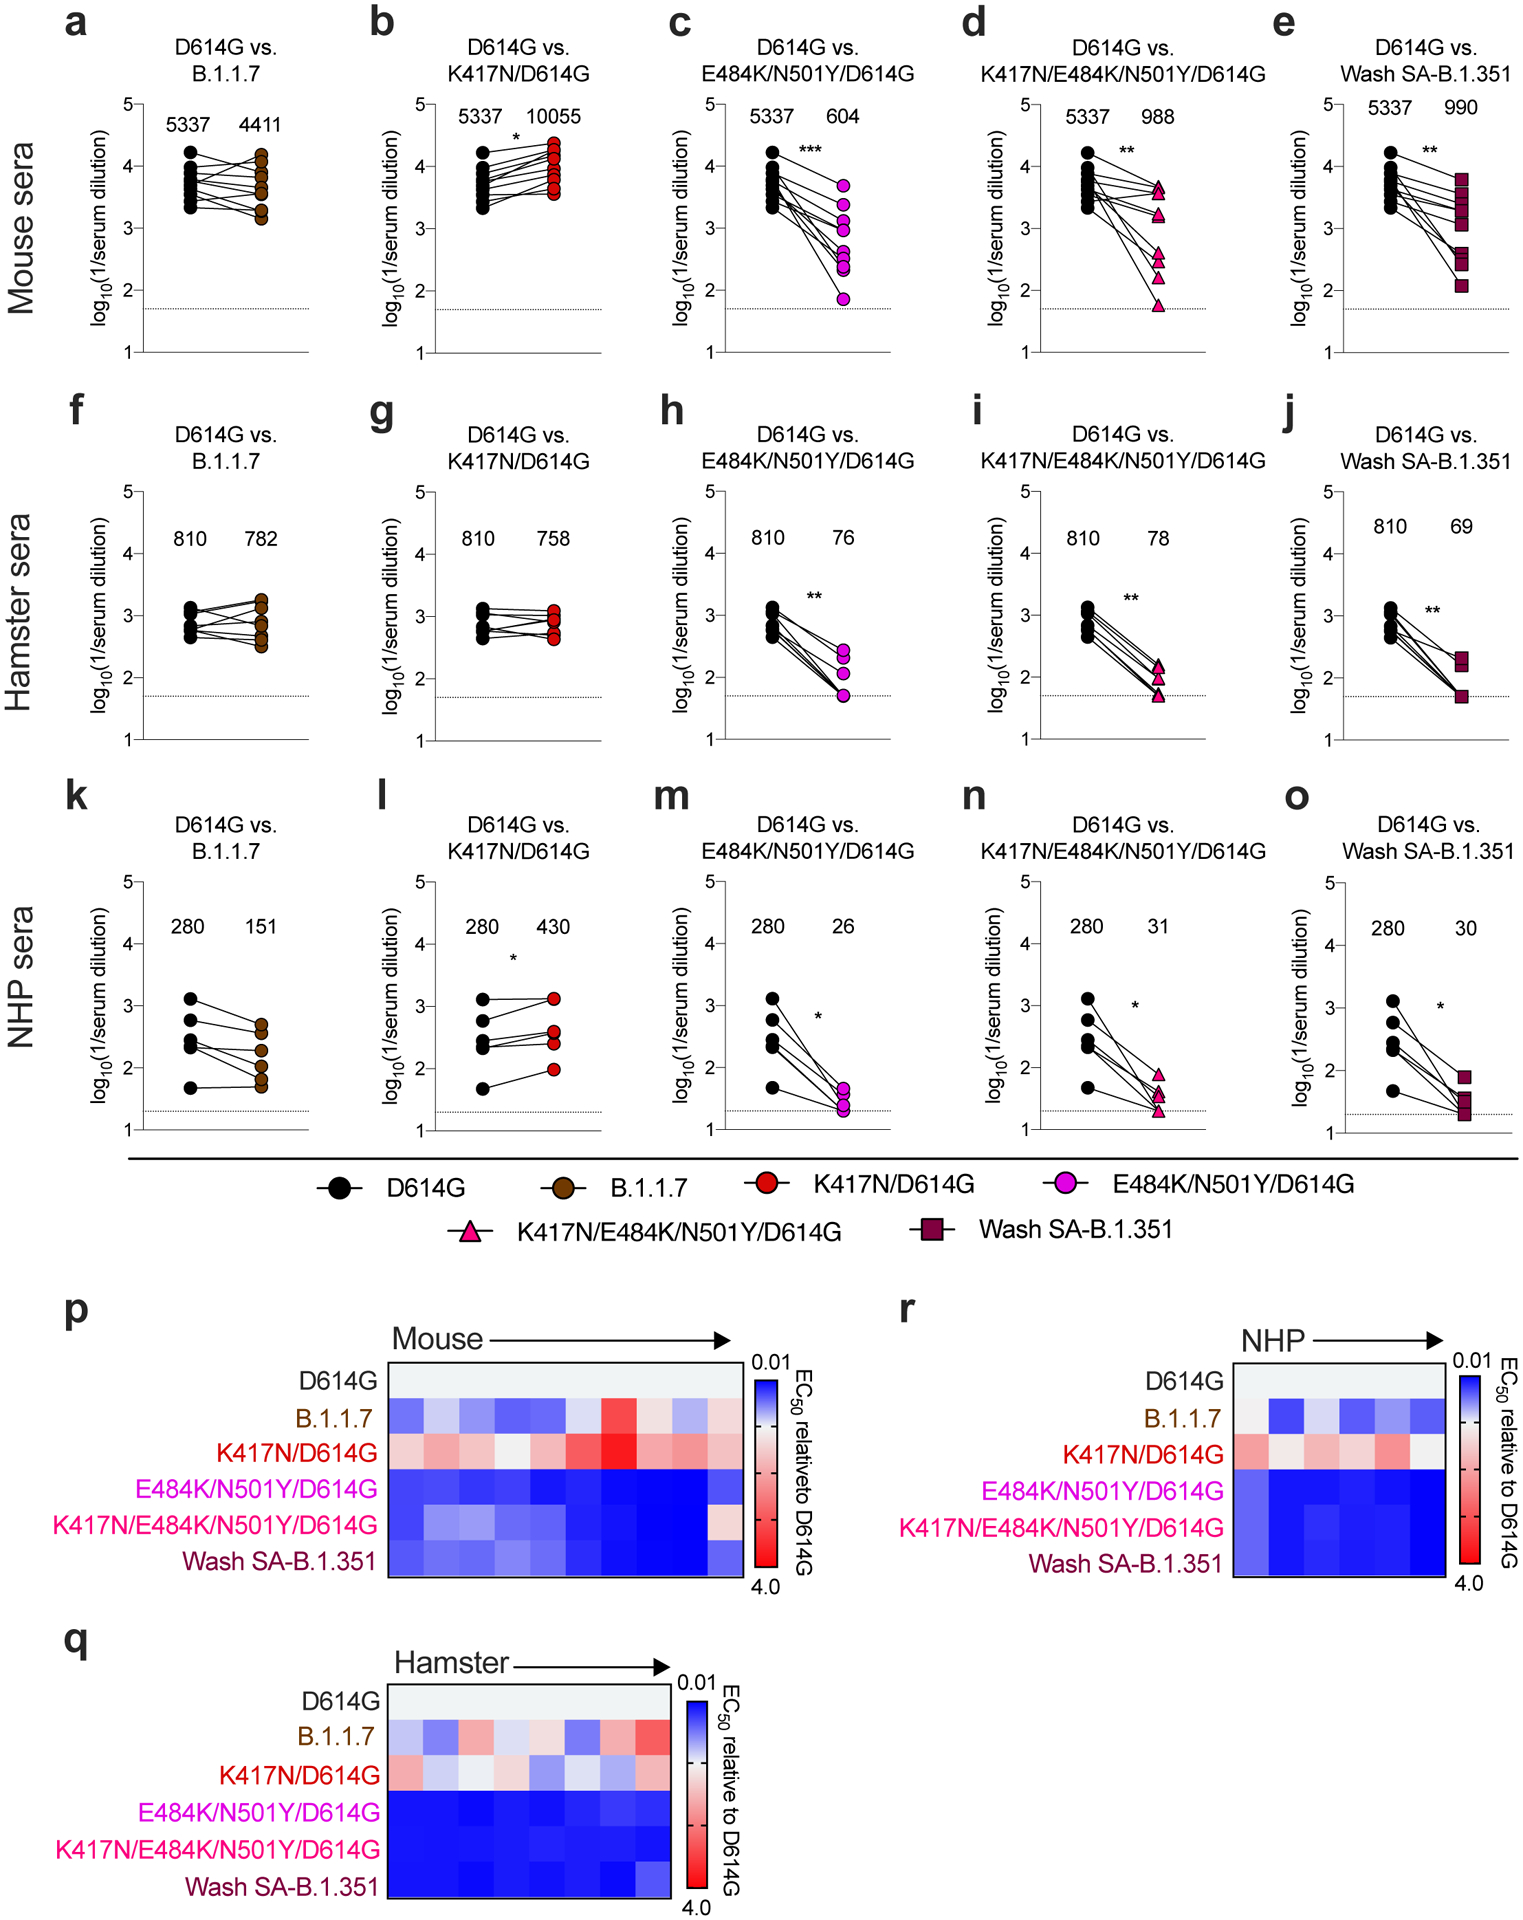
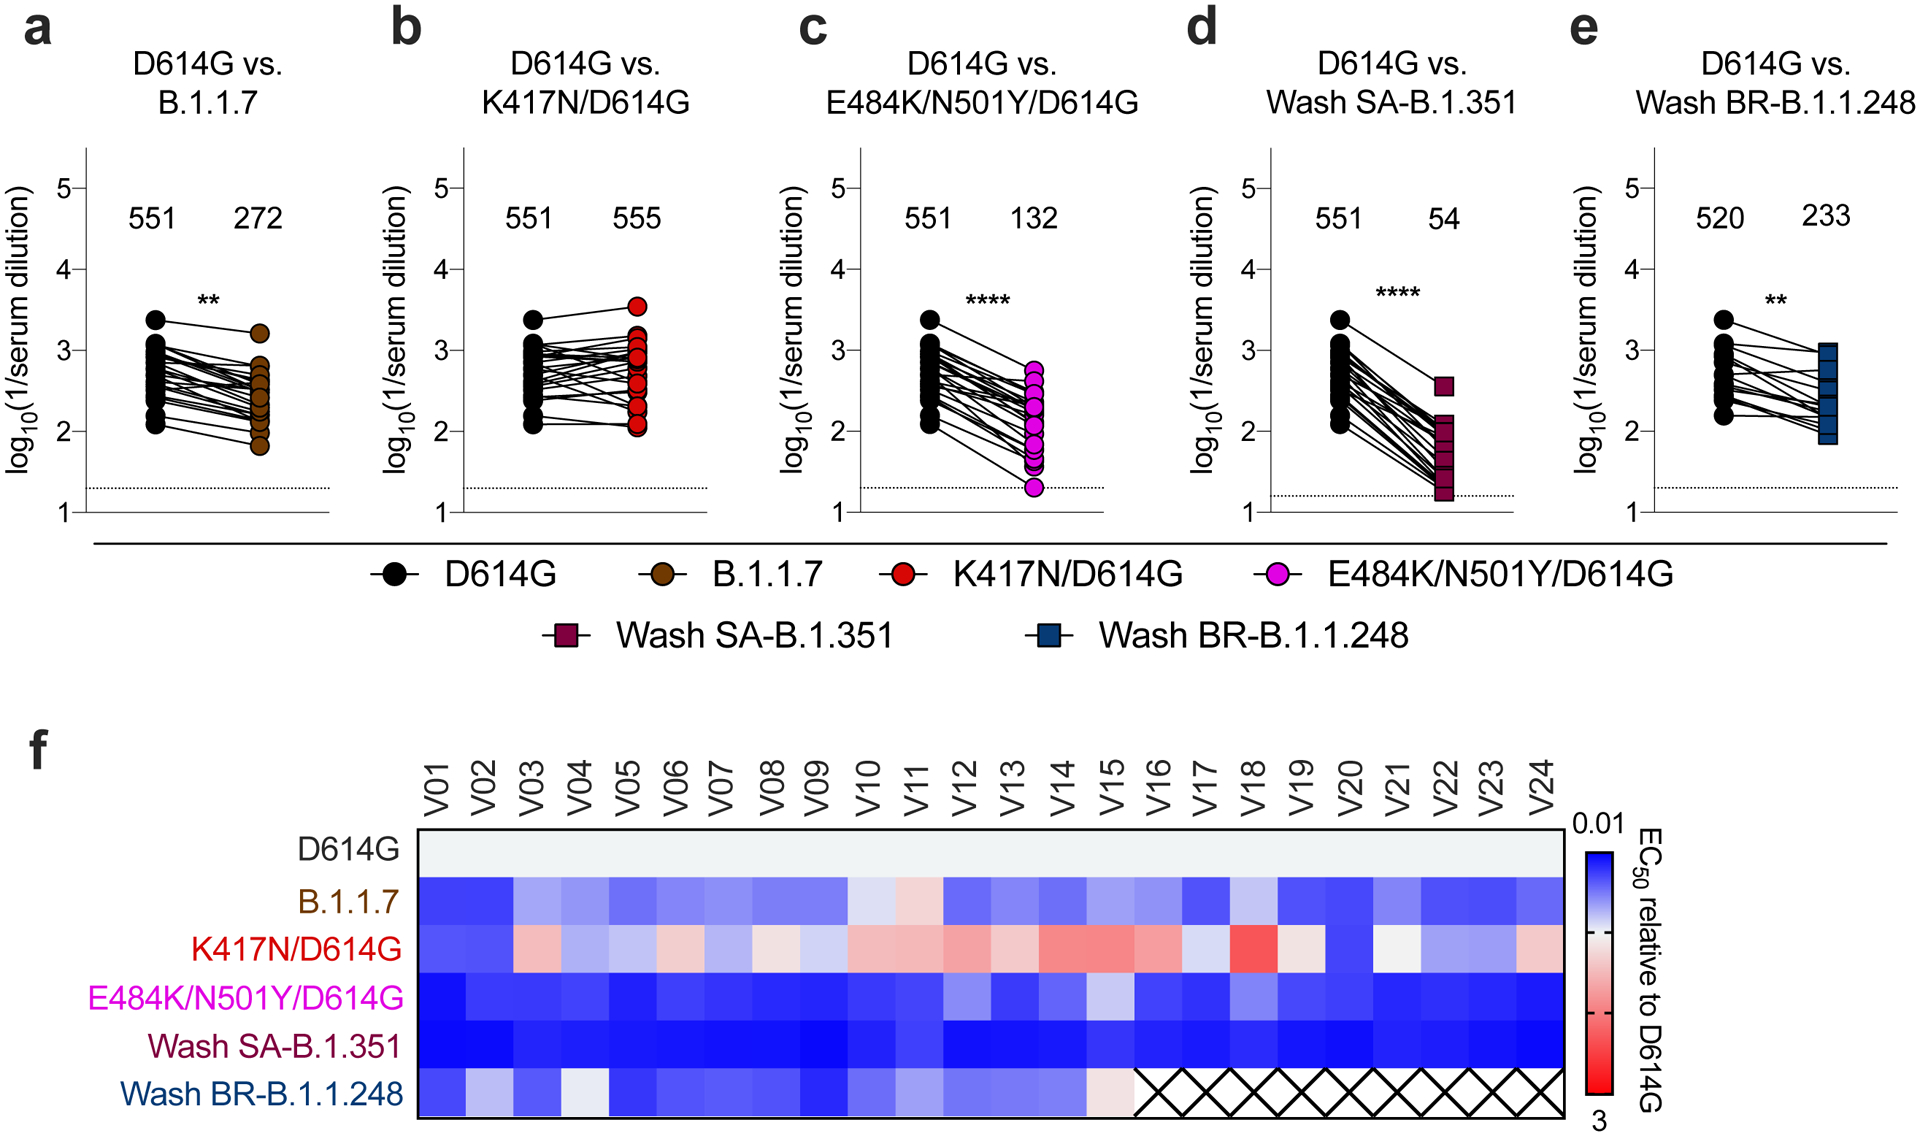
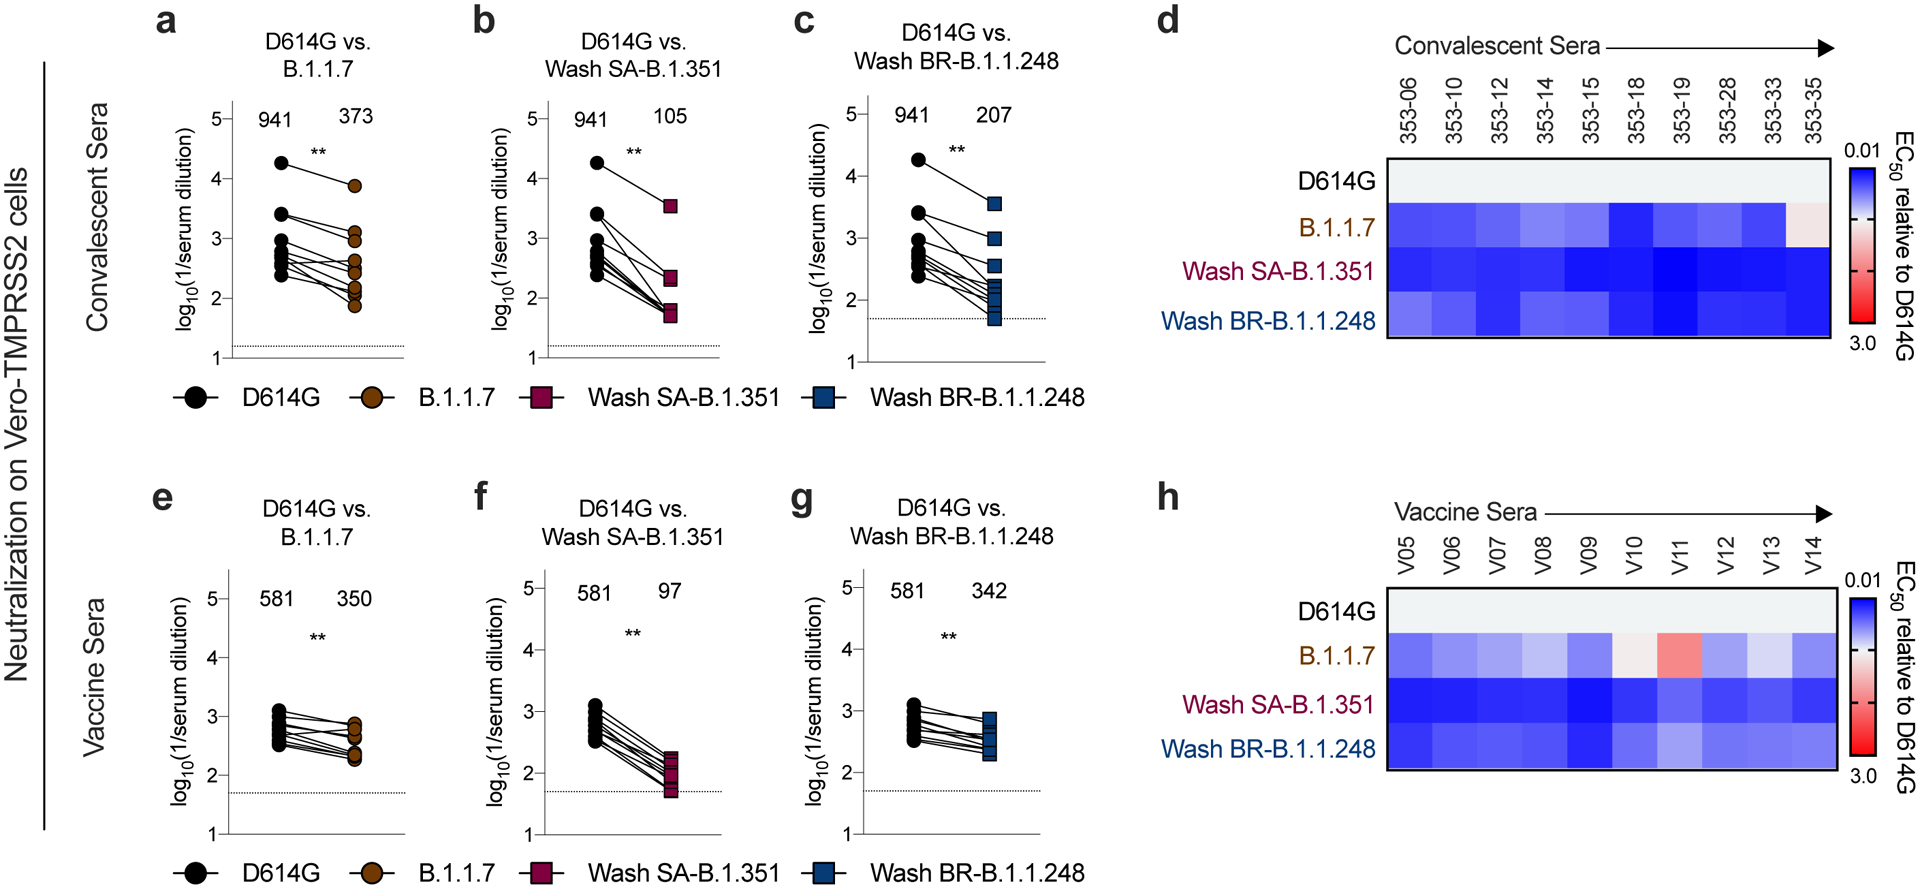
Severe acute respiratory syndrome coronavirus 2 (SARS-CoV-2) has caused the global COVID-19 pandemic. Rapidly spreading SARS-CoV-2 variants may jeopardize newly introduced antibody and vaccine countermeasures. Here, using monoclonal antibodies (mAbs), animal immune sera, human convalescent sera and human sera from recipients of the BNT162b2 mRNA vaccine, we report the impact on antibody neutralization of a panel of authentic SARS-CoV-2 variants including a B.1.1.7 isolate, chimeric strains with South African or Brazilian spike genes and isogenic recombinant viral variants. Many highly neutralizing mAbs engaging the receptor-binding domain or N-terminal domain and most convalescent sera and mRNA vaccine-induced immune sera showed reduced inhibitory activity against viruses containing an E484K spike mutation. As antibodies binding to spike receptor-binding domain and N-terminal domain demonstrate diminished neutralization potency in vitro against some emerging variants, updated mAb cocktails targeting highly conserved regions, enhancement of mAb potency or adjustments to the spike sequences of vaccines may be needed to prevent loss of protection in vivo.


Figures

Extended Data Fig. 1
Extended Data Fig. 1. MAb-spike structures
Structures of the SARS-CoV-2 RBD in complex with a representative neutralizing antibody from (a) class 1 (S2E12, PDB: 7K45), or (b) class 2 (S309, PDB: 6WPS). c, Structure of the SARS-CoV-2 spike N-terminal domain (NTD) in complex with a representative class 3 neutralizing antibody (4A8, PDB: 7C2L). All structural analysis and figures were generated with UCSF ChimeraX.
Extended Data Fig. 2
Extended Data Fig. 2. Neutralization curves with mAbs and variant SARS-CoV-2 strains
Anti-SARS-CoV-2 human mAbs were tested for neutralization of infection of the indicated viral variants and isolates using a FRNT on Vero-hACE2-TMPRSS2 or Vero-TMPRSS2 cells. One representative experiment of two performed in duplicate is shown.
Extended Data Fig. 3
Extended Data Fig. 3. Binding and neutralizing activity of mAbs to SARS-CoV-2 variants
a, Binding of mAbs S2E12 (class 1, RBM), S309 (class 2, RBD base), VIR-7381 (class 2, RBD-base), and S2X333 (class 3, NTD) to SARS-CoV-2 spike proteins from the indicated strains when expressed on the surface of ExpiCHO cells (symbols, mean of duplicates from one experiment). Gating strategy and binding of mAbs S2E12, S309, VIR-7831, and S2X333 (at 370 ng/mL) to SARS-CoV-2 spike from indicated variants when expressed on the surface of ExpiCHO cells. Shown on histograms is the gating strategy of the population of positive cells (percentage ranging between 37 and 46%) used to calculate MFI. b, Neutralization of VSV-SARS-CoV-2 pseudotyped viruses (with indicated spike proteins) on Vero E6 cells. Mean ± standard deviation of sextuplicates is shown for all pseudoviruses, except for SARS-CoV-2 WT (mean of triplicates). WT, Wuhan-1 + D614G. c, Serial dilutions of S309 mAb were mixed with Vero CCL81 cell-derived WA1/2020 and added to Vero-hACE2-TMPRSS2 or Vero-TMPRSS2 cells for evaluation of neutralizing activity by FRNT. One representative experiment of two is shown. The EC50 values are provided in the legend in ng/mL.
Extended Data Fig. 4
Extended Data Fig. 4. Neutralization curves with convalescent human sera from longitudinal cohort and variant SARS-CoV-2 strains
Serum from individuals (n = 29) who had been infected with SARS-CoV-2 (samples obtained at ~1-month post-infection) were tested for neutralization of the indicated viral variants and isolates in Vero-hACE2-TMPRSS2 cells using a FRNT. One experiment performed in duplicate is shown.
Extended Data Fig. 5
Extended Data Fig. 5. Neutralization curves with mAbs and Wash BR-B.1.1.248 virus
a, Surface representation of SARS-CoV-2 spike showing the NTD in orange, RBD in green, and S2 portion of the molecule in blue, with N- and C-termini annotated. Substitutions seen in the B.1.1.248 Brazilian variant (L18F, T20N, P26S, D138Y, R190S, K417T, E484K, N501Y, D614G, H655Y, T1027I, and V1176F) are shaded red. Red hexagon depicts approximate location of R190S, which is obscured in this view. Red star indicates approximate location of T1027I, which is obscured in this view. V1176F is not shown, as it exists beyond the C-terminus of this model, which ends at residue D1146. Inset shows top-down view of the RBD with B.1.1.248 RBD substitutions (K417T/E484K/N501Y) shaded red and contextualized with the receptor binding motif. Spike was modelled using PDB: 7C2L; RBD was modelled using PDB: 6W41. All structural analyses and figures were generated with UCSF ChimeraX. b, Selected anti-SARS-CoV-2 human mAbs (selected ones used are indicated) were tested for neutralization of the indicated Wash BR-B.1.1.248 using a FRNT on Vero-hACE2-TMPRSS2 cells (top) or on Vero -TMPRSS2 cells (bottom). One representative experiment of two performed in duplicate is shown. c, Summary of EC50 values (ng/ml) of neutralization of Wash BR-B.1.1.248 performed in Vero-hACE2-TMPRSS2 cells (top) or on Vero-TMPRSS2 cells (bottom). Data are an average of two experiments, each performed in duplicate. Blue shading of cells shows virtually complete loss of neutralizing activity: EC50 > 10,000 ng/mL.
Extended Data Fig. 6
Extended Data Fig. 6. Neutralization curves with animal sera from ChAd-CoV-2 vaccinated animals and variant SARS-CoV-2 strains
Serum samples were collected from mice (n = 10), hamsters (n = 8), or rhesus macaques (NHP, n = 6) ~30 days after a single intranasal immunization with ChAd-SARS-CoV-2-S. Sera were tested for neutralization of infection of the indicated viral variants and isolates in Vero-hACE2-TMPRSS2 cells using a FRNT. One experiment performed in duplicate is shown.
Extended Data Fig. 7
Extended Data Fig. 7. S and RBD binding activity of human sera from individuals vaccinated with BNT162b2 mRNA vaccine
Individuals were vaccinated and boosted with the Pfizer-BioNTech mRNA vaccine. At seven days after boosting, sera were collected and tested for binding to S or RBD proteins (WA1/2020 strain) by ELISA. One experiment performed in duplicate is shown.
Extended Data Fig. 8
Extended Data Fig. 8. Neutralization curves in Vero-hACE2-TMPRSS2 cells with human sera from subjects vaccinated with the BNT162b2 mRNA vaccine and variant SARS-CoV-2 strains.
Individuals were vaccinated and boosted with the Pfizer-BioNTech mRNA vaccine. Sera were collected and tested for neutralization of infection of the indicated viral variants and isolates using a FRNT and Vero-hACE2-TMPRSS2 cells. One experiment performed in duplicate is shown.
Extended Data Fig. 9
Extended Data Fig. 9. Neutralization curves of variant SARS-CoV-2 strains in Vero-TMPRSS2 cells with human sera from convalescent subjects or those vaccinated with the BNT162b2 mRNA vaccine
Serum from individuals (n = 10) who had been infected with SARS-CoV-2 (~ 1-month time point) or vaccinated with the Pfizer-BioNTech mRNA vaccine (n = 10) were tested for neutralization of the indicated SARS-CoV-2 strains (D614G, B.1.1.7, Wash SA-B.1.351, Wash BR-B.1.248) using a FRNT and Vero-TMPRSS2 cells. One experiment performed in duplicate is shown, with some exceptions due to limited sample.
Extended Data Fig. 10
Extended Data Fig. 10. Differential serum neutralization of SARS-CoV-2 produced in Vero E6 and Vero-hACE2-TMPRSS2 cells
((Top panels) Immune or vaccine-derived sera from mice, hamsters, NHP, or humans (see Figures 2, 3, and 4) were incubated with deep-sequenced confirmed p0 (Vero cell-produced) or p1 (Vero-hACE2-TMPRSS2 cell-produced) versions of K417N/E484K/N501Y/D614G virus and then subjected to a FRNT in Vero-hACE2-TMPRSS2 recipient cells. EC50 values were calculated from one experiment performed in duplicate. GMT values are shown above each graph. Dotted line represents the limit of detection of the assay. Two-tailed Wilcoxon matched-pairs signed rank test: Mouse vaccine sera, P = 0.0039; Hamster vaccine sera, P = 0.0078; NHP vaccine sera, P = 0.0312; Human convalescent sera, P = 0.0001; Human vaccine sera, P = 0.0026. (Middle panels) Serum neutralization curves with K417N/E484K/N501Y/D614G virus (p0, generated in Vero E6 cells; p1, generated in Vero-hACE2-TMPRSS2 cells) using a FRNT and Vero-hACE2-TMPRSS2 cells. One experiment performed in duplicate is shown. (Bottom left panel) Neutralization curves and EC50 values with COV2–2050 and COV2–2196 mAbs using the p0 (Vero cell-produced) or p1 (Vero-hACE2-TMPRSS2 cell-produced) viruses and recipient Vero-hACE2-TMPRSS2 cells.
Figure 1.
Figure 1.. Neutralization of SARS-CoV-2 viral variants by mAbs.
a-b, SARS-CoV-2 spike trimer. One protomer is highlighted, showing the NTD in orange, RBD in green, and S2 portion of the molecule in blue, with N- and C-termini annotated. a, Substitutions in the B.1.1.7 variant (69–70 deletion, 144–145 deletion, A570D, D614G, P681H, and T716I) are shaded in red. Red triangle depicts approximate location of P681H, which was not included in the model. Inset shows a top-down view of the RBD showing the location of the N501Y mutation contextualized with the receptor-binding motif (RBM). b, Substitutions in the Wash-SA B.1.135 variant (242–244 deletion, D80A, R246I, D614G, and A701V) are shaded in red. The red diamond denotes approximate location of D80A, which is buried in this view. Inset shows top-down view of the RBD with Wash SA-B.1.351 substitutions K417N, E484K, and N501Y shaded red and contextualized with the receptor binding motif. For all panels, structures depicting spike protein were modeled using PDB: 7C2L. Structures depicting RBD were modeled using PDB: 6W41. All analyses and figures were generated with UCSF ChimeraX. c, Viruses with indicated spike mutations. d-f, Neutralization curves in (left panels) Vero-hACE2-TMPRSS2 cells or (right panels) Vero-TMPRSS2 cells comparing the sensitivity of SARS-CoV-2 strains with class 1 (d, COV2–2130 and COV-2150), class 2 (e, SARS2–31 and S309), and class 3 (f, COV2–2676 and COV2–2489) mAbs and indicated viruses. Also shown are the neutralization curves for antibody cocktails (g, COV2–2196 + COV2–2130 and S309 + S2E12). One representative experiment of two performed in technical duplicate is shown. h-i, Summary of EC50 values (ng/ml) of neutralization of SARS-CoV-2 viruses propagated on the indicated cells and performed in Vero-hACE2-TMPRSS2 (h) or Vero-TMPRSS2 (i) cells. Blue shading of cells shows virtually complete loss of neutralizing activity: EC50 > 10,000 ng/mL.
Figure 2.
Figure 2.. Neutralization of SARS-CoV-2 viral variants by convalescent human serum in Vero-hACE2 TMPRSS2 cells.
a-e, Paired analysis of neutralizing activity by convalescent human sera (n = 19) obtained approximately 1 month after mild SARS-CoV-2 infection against WA1/2020 D614G and variant viruses in Vero-hACE2-TMPRSS2 cells: (a) B.1.1.7, (b) K417N/D614G, (c) E484K/N501Y/D614G, (d) K417N/E484K/N501Y/D614G, or (e) Wash SA-B.1.351. g. Paired analysis of neutralizing activity by a separate convalescent human sera cohort (n = 10) obtained approximately 1 month after mild SARS-CoV-2 infection against WA1/2020 D614G and Wash BR-B.1.1.248 in Vero-hACE2-TMPRSS2 cells. a-e and g. Results are from one experiment performed in duplicate. Geometric mean neutralization titers (GMT) are shown above each graph. Dotted line represents the limit of detection of the assay. Two-tailed Wilcoxon matched-pairs signed rank test: D614G vs. B.1.1.7, P = 0.0546; D614G vs. K417N/D614G, P = 0.0361; D614G vs. E484K/N501Y/D614G, P < 0.0001; D614G vs. K417N/E484K/N501Y/D614G, P < 0.0001; D614G vs. Wash SA-B.1.351, P < 0.0001; D614G vs. Wash BR-B.1.1.248, P = 0.0020. f, h Heat maps of the relative neutralizing activity of sera from individual convalescent subjects against indicated SARS-CoV-2 viruses compared to recombinant WA1/2020 D614G. Blue, reduction; red, increase.
Figure 3.
Figure 3.. Resistance of SARS-CoV-2 viral variants to neutralization by vaccine-induced serum derived from mice, hamsters, and NHPs.
Paired analysis of neutralizing activity by sera from mice (a-e, n = 10), hamsters (f-j, n = 8), and NHPs (k-o, n = 6) obtained ~30 days after a single intranasal immunization with an adenoviral vectored SARS-CoV-2 vaccine (ChAd-SARS-CoV-2-S). Neutralization data on Vero-hACE2-TMPRSS2 cells is displayed as WA1/2020 D614G versus the variant viruses: (a, f, k) B.1.1.7, (b, g, l) K417N/D614G, (c, h, m) E484K/N501Y/D614G, (d, i, n) K417N/E484K/N501Y/D614G, or (e, j, o) Wash SA-B.1.351. Results are from one experiment performed in duplicate, with some exceptions due to limited sample. GMT values are shown above each graph. Dotted line represents the limit of detection of the assay. Two-tailed Wilcoxon matched-pairs signed rank test: Mouse sera: D614G vs. B.1.1.7, P = 0.323; D614G vs. K417N/D614G, P = 0.0020; D614G vs. E484K/N501Y/D614G, P = 0.0020; D614G vs. K417N/E484K/N501Y/D614G, P = 0.0039; D614G vs. Wash SA-B.1.351, P = 0.0020. Hamster sera: D614G vs. B.1.1.7, P = 0.9453; D614G vs. K417N/D614G, P > 0.9999; D614G vs. E484K/N501Y/D614G, P = 0.0078; D614G vs. K417N/E484K/N501Y/D614G, P = 0.0078; D614G vs. Wash SA-B.1.351, P = 0.0078. NHP sera: D614G vs. B.1.1.7, P = 0.0625; D614G vs. K417N/D614G, P = 0.0312; D614G vs. E484K/N501Y/D614G, P = 0.0312; D614G vs. K417N/E484K/N501Y/D614G, P = 0.0312; D614G vs. Wash SA-B.1.351, P = 0.0312. p-r, Heat maps of the relative neutralizing activity of sera from individual mice (p), hamsters (q), and NHPs (r) against indicated SARS-CoV-2 viruses compared to WA1/2020 D614G. Blue, reduction; red, increase.
Figure 4.
Figure 4.. Resistance of SARS-CoV-2 viral variants to neutralization by human serum from Pfizer-BioNTech BNT162b2 mRNA vaccinated individuals in Vero-hACE2-TMPRSS2 cells.
Paired analysis of neutralizing activity by sera from humans (n = 24) obtained after boosting with the BNT162b2 mRNA vaccine. Neutralization data on Vero-hACE2-TMPRSS2 cells is displayed with WA1/2020 D614G versus the variant viruses: (a) B.1.1.7, (b) K417N/D614G, (c) E484K/N501Y/D614G, (d) Wash SA-B.1.351, or (e) Wash BR-B.1.1.248 (n = 15). Results are from one experiment performed in duplicate. GMT values are shown above each graph. Dotted line represents the limit of detection of the assay. Two-tailed Wilcoxon matched-pairs signed rank test: D614G vs. B.1.1.7, P < 0.0001; D614G vs. K417N/D614G, P = 0.6231; D614G vs. E484K/N501Y/D614G, P < 0.0001; D614G vs. K417N/E484K/N501Y/D614G, P = 0.8774; D614G vs. Wash SA-B.1.351, P < 0.0001; D614G vs. Wash BR-B.1.1.248, P = 0.0020. f, Heat map of the relative neutralizing activity of sera from vaccinated individuals against indicated SARS-CoV-2 viruses compared to WA1/2020 D614G. Blue, reduction; red, increase. An X indicates sera was not evaluated.
Figure 5.
Figure 5.. Resistance of SARS-CoV-2 viral variants to neutralization by human serum from convalescent and vaccinated individuals in Vero-TMPRSS2 cells.
Sera from individuals who had been infected with SARS-CoV-2 (a-c; n = 10, ~1-month post-infection) or vaccinated with the Pfizer-BioNTech mRNA vaccine (d-f; n = 10) were tested for neutralization of the indicated SARS-CoV-2 strains (WA1/2020 D614G (a, b, c, e, f, g), B.1.1.7 (a, e), Wash SA-B.1.351 (b, f), or Wash BR-B.1.1.248 (c, g) using a FRNT in Vero-TMPRSS2 cells. Results are from one experiment performed in duplicate, with some exceptions due to limited sample. GMT values are shown above each graph. Dotted line represents the limit of detection of the assay. Two-tailed Wilcoxon matched-pairs signed rank test: Convalescent sera: D614G vs. B.1.1.7, P = 0.0039; D614G vs. Wash SA-B.1.351, P = 0.0020; D614G vs. Wash BR-B.1.1.248, P = 0.0020. Vaccine sera: D614G vs. B.1.1.7, P = 0.0039; D614G vs. Wash SA-B.1.351, P = 0.0020; D614G vs. Wash BR-B.1.1.248, P = 0.0020. d, h, Heat maps of the relative neutralizing activity of sera from convalescent (d) or vaccinated (h) individuals against indicated SARS-CoV-2 viruses compared to WA1/2020. Blue, reduction; red, increase.

Update of

Similar articles

Cited by

References

    1. Sempowski GD, Saunders KO, Acharya P, Wiehe KJ & Haynes BF Pandemic Preparedness: Developing Vaccines and Therapeutic Antibodies For COVID-19. Cell 181, 1458–1463 (2020). - PMC - PubMed
    1. Letko M, Marzi A & Munster V Functional assessment of cell entry and receptor usage for SARS-CoV-2 and other lineage B betacoronaviruses. Nature microbiology 5, 562–569 (2020). - PMC - PubMed
    1. Pinto D, et al. Cross-neutralization of SARS-CoV-2 by a human monoclonal SARS-CoV antibody. Nature 583, 290–295 (2020). - PubMed
    1. Cao Y, et al. Potent neutralizing antibodies against SARS-CoV-2 identified by high-throughput single-cell sequencing of convalescent patients’ B cells. Cell 182, 73–84 (2020). - PMC - PubMed
    1. Zost SJ, et al. Rapid isolation and profiling of a diverse panel of human monoclonal antibodies targeting the SARS-CoV-2 spike protein. Nat Med 26, 1422–1427 (2020). - PMC - PubMed

Publication types