. 2021 Mar;53(3):313-321.
doi: 10.1038/s41588-021-00800-7. Epub 2021 Mar 4.

Identification of rare and common regulatory variants in pluripotent cells using population-scale transcriptomics

Collaborators, Affiliations

Identification of rare and common regulatory variants in pluripotent cells using population-scale transcriptomics

Marc Jan Bonder et al. Nat Genet. 2021 Mar.

Abstract

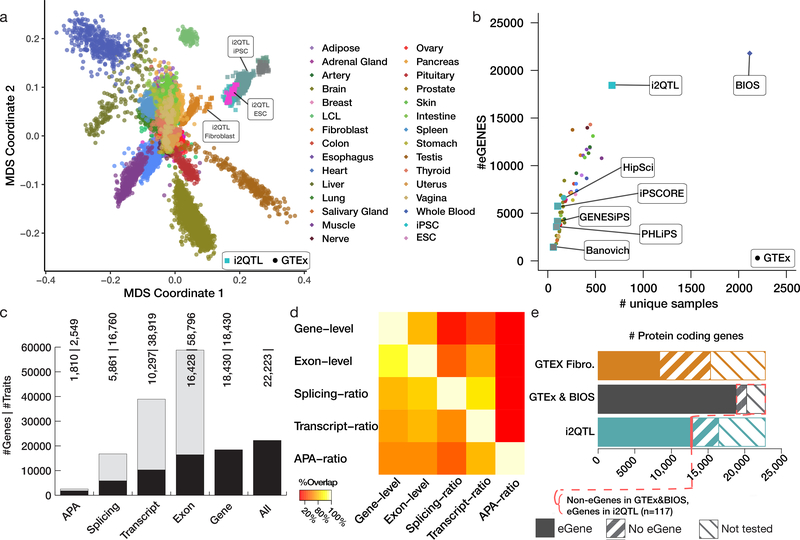
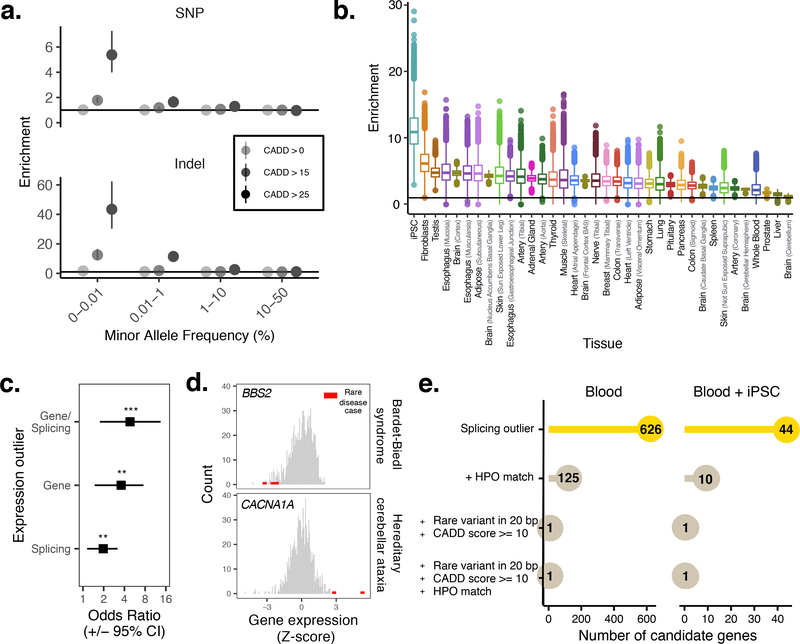
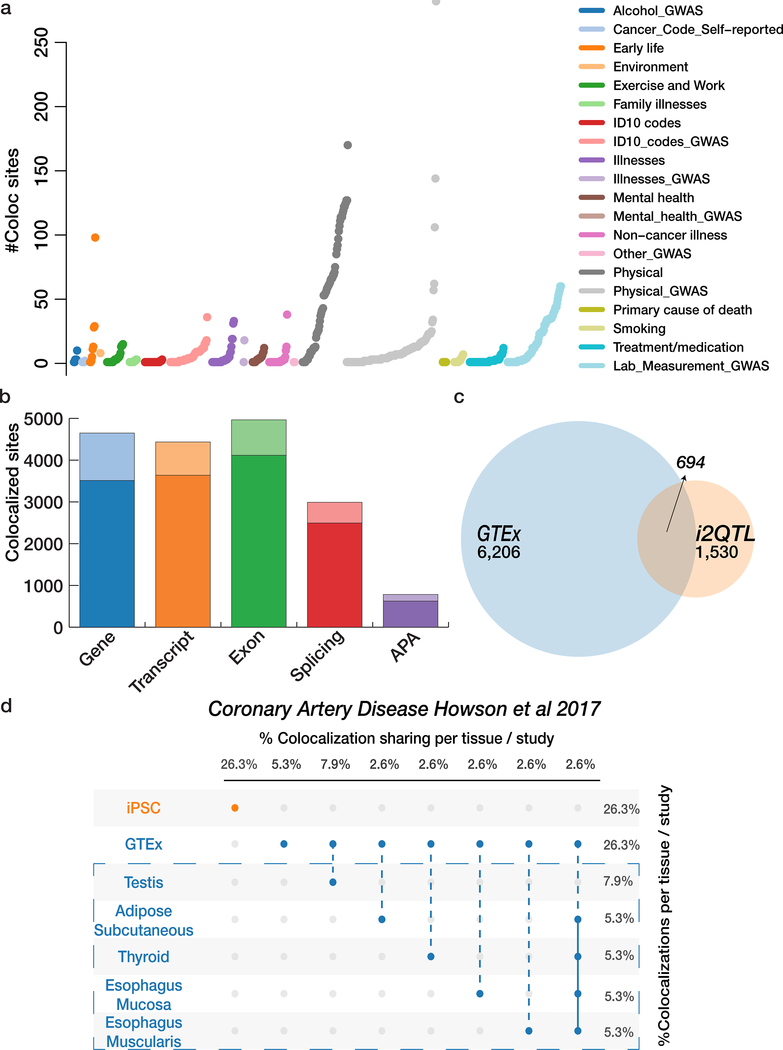
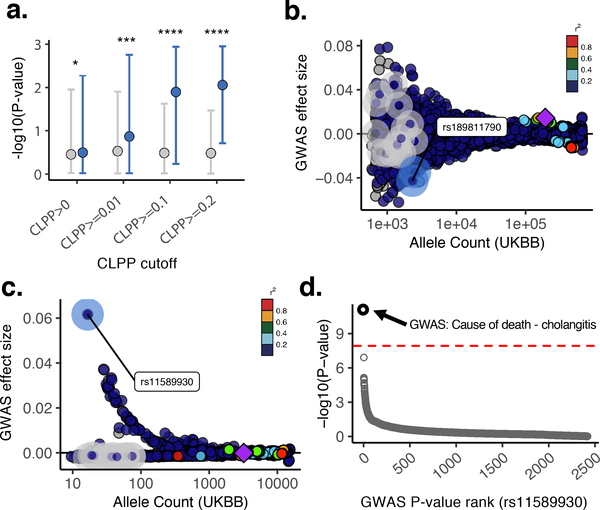
Induced pluripotent stem cells (iPSCs) are an established cellular system to study the impact of genetic variants in derived cell types and developmental contexts. However, in their pluripotent state, the disease impact of genetic variants is less well known. Here, we integrate data from 1,367 human iPSC lines to comprehensively map common and rare regulatory variants in human pluripotent cells. Using this population-scale resource, we report hundreds of new colocalization events for human traits specific to iPSCs, and find increased power to identify rare regulatory variants compared with somatic tissues. Finally, we demonstrate how iPSCs enable the identification of causal genes for rare diseases.


Conflict of interest statement

Conflicts of interest

S.B.M. is on SAB of Myome Inc.

Figures

Extended Data Fig. 1
Extended Data Fig. 1. Replication and consistency of effect sizes of eQTL discovered in the the original iPSC studies and replicated in i2QTL
Shown are scatter plots between eQTL effect size estimates in this study (i2QTL, x-axis) versus effect size estimates from previous studies (y-axis). Dots correspond to eQTL discovered in the respective study. Black: eQTL with consistent effect direction. Red: eQTL with discordant effect direction. Replication defined at nominal P<0.05 in i2QTL. A. Replication of HipSci in i2QTL. 70.4% of the effects are replicated; 98% of the eQTL have concordant effect direction. Differences in the approach for estimating effect sizes result in the observed variation. B. Replication of iPSCORE in i2QTL. 81% of the effects are replicated; 98.7% of the eQTL have concordant effect direction. Notably only SNP eQTL were considered whereas SVs were not considered for replication. C. Replication of GENESiPS in i2QTL; 76.7% of the effects are replicated; 99.5% of the effects have concordant effect direction. D. Replication of PhiLiPS in i2QTL. 76.8% of the effects are replicated; 97.5% of the effects have concordant effect direction.
Extended Data Fig. 2
Extended Data Fig. 2. Identification of multiple independent eQTL for the same gene using stepwise regression
A. Histogram of the number of independent eQTL effects identified for individual eGenes. Up to 12 independent effects were identified. B. Zoom-in view displaying the number of eGenes with 5 to 8 independent effects. C. Zoom-in view displaying the number eGenes with 8 to 12 independent effects.
Extended Data Fig. 3
Extended Data Fig. 3. Sharing of lead eQTL signals between cell types and studies, considering i2QTL, GTEX and the iPS differentiation study from Cuomo et al.
A. Pairwise sharing of lead eQTL signals in i2QTL (iPSC) and 48 GTEx tissues. Shown is the fraction of shared eQTL signals relative to the total number of common genes and lead eQTL variants in the two respective maps. Shared eQTL signals are defined as eQTL with concordant effect direction and absolute effect size within a factor of two (Methods). B. Distribution of pairwise sharing as in A of iPSCs versus GTEx tissues (blue, N=48 comparisons) versus pairwise sharing between GTEx tissues (red, N=2,401 comparisons).C. Pairwise sharing of lead eQTL signals in i2QTL (iPSC) and 48 GTEx tissues as in A, however additionally including single-cell eQTL form Cuomo et al. in iPSCs (iPSCsc), differentiated cell types (mesendo, endoderm). D. Distribution of pairwise sharing as in C, considering iPSCs and differentiated cell types (bulk left, followed by iPSC single cell), mesendoderm (cyan), and endoderm (green) versus GTex tissues (N=48 comparisons). During differentiation genetic signals in iPSC become more similar to those in GTEx tissues. Data in panels B and D are displayed as violin- and boxplot with the midpoint corresponding to the median, the lower and upper edges of the box to the first and third quartiles and the whiskers corresponding to the IQR ×1.5.
Extended Data Fig. 4
Extended Data Fig. 4. Properties of distal (trans) gene-level eQTL.
A. Dot plot of N=862 trans-eQTL detected in iPSC (FDR<10%). Dots correspond to individual trans-eQTL, with color denoting the variant category (blue: cis-eQTL, red: GWAS variant, purple: cis-eQTL and GWAS variant). </p> B. Breakdown of unique trans-eQTL variants (N=193) across different variant annotations. Darker shaded colors denote trans-eQTL linked to variants that have more than one annotation; lighter shades correspond variants that can be unique assigned to a given variant category. C. Mediation analysis of trans-eQTL, considering variants that are linked to a cis eQTL. The outer pie denotes the annotation of the underlying trans variant: GWAS only variants (n=7, white), cis eQTL variants (n=186, dark-blue). The inner pie displays results from the mediation analysis for individual trans variants: n=7 trans eQTL are exclusively linked to GWAS variants and hence not mediated (white, “GWAS only trans-eQTL”); n=58 trans eQTL variants are not significantly linked to mediation with any RNA trait (“Non-significant link to any cis-eQTL”); 86 are exclusively linked to gene-level abundance (“Only linked to gene-level cis-eQTL”), 7 are exclusively linked a RNA trait other than gene-level abundance (“Linked only to non gene-level cis-eQTL”); 35 are linked to gene-level abundance and at least one additional RNA trait(“Linked both to gene-level and other level cis-eQTL”).
Extended Data Fig. 5
Extended Data Fig. 5. Analysis of the trans-eQTL hotspot at ELF2
A. Schematic representation of the genetic loci around ELF2 (left) and NAA15 (right). SNPs are annotated by evidence of cis-eQTL regulation on different traits (blue: transcript-ratio eQTL on ELF2, purple: gene-level eQTL on EFL2, green: splice eQTL on ELF2, brown: the APA eQTL on NAA15). B. LD structure between cis-eQTL variants implicated in the hotspot, annotated by cis-eQTL type as in A. C-F. Lead cis-eQTL effects by RNA trait for ELF2 and NAA15 across SNPs linked to downstream trans-eQTLs(n=682 samples). Data are represented as a violin- and boxplot with the midpoint corresponding to the median, the lower and upper edges of the box to the first and third quartiles, the whiskers represent the interquartile range ×1.5. C. Splicing cis-eQTL on ELF2. D. Gene level cis-eQTL on ELF2. E. Transcript-ratio cis-eQTL on ELF2. F. Alternative polyadenilation cis-eQTL on NAA15. G. Co-expression network of genes that are controlled by the trans-eQTL linked to the hotspot at ELF2 (N=37 genes), including ELF2 itself (center). Color of the bounding box around Genes denotes the cis-eQTL variant that drives the corresponding trans effect (colors as in D-G). Genes with multiple trans regulators are depicted with multiple colored rings. H. Replication of trans effects at ELF2 in a single cell differentiation study (Cuomo et al.). Shown are trans-eQTL effect sizes (beta’s) for the 12 ELF2-linked trans targets that show significant replication (defined as P<0.05 and consistent effect direction) in any of the Cuomo et al tissues. From left to right: eQTL effect size in; the i2QTL study (discovery); in undifferentiated iPSC profiled using scRNA-seq; in mesendoderm profiled using scRNA-seq and in definitive endoderm profiled using scRNA-seq. Significant replication are indicated with a red asterisk.
Extended Data Fig. 6
Extended Data Fig. 6. Enrichment for rare, deleterious SNPs in iPSC and GTEx tissues
Comparison of enrichments for singleton, highly-deleterious (CADD > 25) SNPs in iPSC versus GTEx v7 tissues analogous to Fig. 2B, however with an additional adjustment for the number of expressed genes. Displayed are enrichments for 10,000 random draws of 50 samples, controlling for the number of expressed genes (genes subset at a fixed number across tissues, N=500 genes). Strongest enrichment is observed in iPSC. The data are represented as a boxplot where the middle line corresponds to the median, the lower and upper edges of the box corresponding to the first and third quartiles, the whiskers represent the interquartile range (IQR) ×1.5 and beyond the whiskers are outlier points.
Extended Data Fig. 7
Extended Data Fig. 7. Expression level of rare disease genes in iPSC versus GTEx tissues
A. Distribution of gene expression level of XX rare disease genes (log10(FPKM+1)) in i2QTL iPSC and 17 GTEx tissues with a median expression level of at least 1 FPKM (red dashed line). Expression in i2QTL highlighted in teal, GTEx tissues in yellow. Disease genes are expressed in iPSCs and only difficult to biopsy tissues in GTEx display higher expression levels. n=2,952 biologically independent samples. Data are represented as boxplots with the middle line corresponding to the median, the lower and upper edges of the box to the first and third quartiles, the whiskers to the interquartile range (IQR) ×1.5. B. Expression level of genes in different curated gene lists, comparing i2QTL iPSC (left), all GTEx tissues (middle) and GTEx whole blod (right). Shown is the fraction of genes in each category for two expression bins: [0,1) FPKM expression absent or lowly expressed; [1,1e+12) FPKM gene expressed.
Extended Data Fig. 8
Extended Data Fig. 8. Additional results from the colocalization analysis of eQTL and GWAS traits
A. Summary of colocalization results for the Coronary artery Disease GWAS (van der Harst et al 2018). 36 out of 93 GWAS loci were identified as colocalized with an eQTL of at least one RNA trait (38.7%). Shown are the number of colocalization events for eQTL of different RNA traits. From left to right: any eQTL type (All), gene-level eQTL (Gene), exon eQTL (Exon), transcript eQTL (Transcript), splicing eQTL (Splicing), APA eQTL (APA). The number of GWAS colocalization that are uniquely linked to a given RNA trait eQTL are displayed using a triangle and the total number of colocalizations per trait is depicted as a circle. B. Colocalization between a gene-level eQTL for POLR1B and a GWAS hit (rs7586668:C>T) for Height. Left: Manhatten plots displaying the local association signal for the eQTL on POLR1B (bottom) and the GWAS signal on Height (top). Right: Scatter plot of negative log P-values for the GWAS signal (x-axis) for BMI versus the POLR1B eQTL signal (y-axis) for the corresponding region.
Extended Data Fig. 9
Extended Data Fig. 9. Enrichment for large-effect outlier-associated rare variants in colocalized genes
Absolute effect size of GWAS trait associations for iPSC outlier- and non-outlier-associated variants, considering genes with varying degree of evidence for colocalization with common eQTL variants.
Extended Data Fig. 10
Extended Data Fig. 10. Optimization of the number of PEER factors to adjust for confounding expression heterogeneity.
Shown is the number of genes with at least one gene-level eQTL (eGenes) for the top 3,000 highest expressed genes in iPSC for increasing number of PEER factors. PEER factors are adjusted for as additional fixed effect covariates. The vertical red line denotes the number of PEER factors considered in all i2QTL analyses.
Figure 1.
Figure 1.. Map of cis genetic regulation in human induced pluripotent cells.
A. Comparison of gene expression profiles of iPSCs vs. GTEx (v7) tissues. Shown are the first two MDS components based on gene-level RNA abundance. B. Comparison of the number of discovered eGenes as a function of sample size considering this study (i2QTL), existing iPSC studies (HipSci, iPSCORE, GENESiPS, PHILIPS, Banovich), GTEx (color code as in A) and a blood eQTL meta-analysis (BIOS). C. Breakdown of the number of RNA traits with a cis-eQTL. The bar plots display both the number of individual RNA traits with a cis-eQTL (grey) as well as the number of genes with at least one association (eGenes, black, aggregated across RNA traits per gene). D. Pairwise replication of genetic effects between RNA traits. Shown is the fraction of cis-eQTL discovered for each trait (rows, FDR < 5%) with replicated effects in a second trait (columns, FDR < 10%; assessing pairwise replication across RNA traits per gene). E. Comparison of the number of protein-coding genes with an eQTL (eGene), genes without eQTL (no eGene) and genes not tested for eQTL (not tested) in Fibroblasts (orange), the combination of the GTEx tissues and BIOS (black) and i2QTL iPSCs (blue). The fraction of protein-coding (0.5%) eGenes without previous evidence for an eQTL in BIOS & GTEx is shown in red.
Figure 2.
Figure 2.. Linking rare variants to gene expression outliers.
A. Enrichment of deleterious rare SNPs and indels in samples with gene expression outliers. B. Comparison of enrichments for singleton, highly-deleterious (CADD > 25) SNPs in iPSCs versus GTEx v7 tissues (adjusted for differences in sample size; Methods). Shown are enrichment scores for 10,000 random draws of 50 samples. The strongest enrichment is observed in iPSCs. N = 7,756 biologically independent samples. The data are represented as a boxplot where the middle line corresponds to median, the lower and upper edges of the box corresponding to first and third quartiles, the whiskers represent the interquartile range (IQR) × 1.5 and beyond the whiskers are outlier points. C. Odds ratios comparing gene and splicing outliers in validated rare disease genes compared to non-disease genes (P values: Gene/splicing = 0.0009; Gene = 0.002; Splicing = 0.01). Outliers in rare disease patient samples are observed in known disease genes at a higher rate. P values computed using two-sided Fisher’s exact test. Error bars represent 95% confidence interval. D. Example of outlier expression in two validated rare disease genes (BBS2 for Bardet-Biedl syndrome (top) and CACNA1A for hereditary cerebellar ataxia). Rare disease cases indicated in red, reference distribution shown in grey. E. Integrating splicing outliers in blood and iPSCs to reduce the total number of candidate disease genes in a rare disease patient.
Figure 3.
Figure 3.. Colocalization of disease and traits variants with iPSC eQTL.
A. Overview of colocalization events with iPSC eQTL, depicting the total number of colocalization events across 350 GWAS and UKBB, with colors encoding the trait categories. B. Colocalization events for each cis-eQTL type, displaying the number of GWAS loci with colocalization events that are either specific to a given eQTL type (light color; not detected by any other eQTL type) or shared with at least one other eQTL type (dark color). C. Overlap between i2QTL and GTEx GWAS colocalization events for gene-level eQTL, considering the number of unique gene-colocalization pairs. D. For the Howsen et al. coronary artery disease GWAS, iPSC eQTL resulted in an 50% increase in the number of colocalization events with disease loci compare to GTEx eQTL alone. iPSC associations in orange GTEx in blue, GTEx tissues with 2 or more genes implicated in the dashed box below.
Figure 4.
Figure 4.. Integration of common-variant colocalization analyses with outlier-associated rare variants.
A. Negative log10 P values of GWAS trait associations for iPSC outlier- and non-outlier-associated variants, considering genes with varying degree of evidence for colocalization with common eQTL variants. Genes are stratified by colocalization posterior probability (CLPP) score. Outlier-associated variants have overall more significant effects in GWAS in which there was evidence for colocalization of the same genes compared to matched non-outlier variants, increasing with colocalization probability (CLPP). Dots denote median values; error bars indicate 95% of empirical data range. P values from one-sided Wilcoxon test (P values: CLPP >0, P = 1.3 × 10−02; CLPP ≥0.01, P = 7.2 × 10−04; CLPP ≥0.1, P = 4.0 × 10⁻¹⁸; CLPP ≥0.2, = 7.1 × 10⁻¹⁷). B. Example gene locus with two outlier-associated variants highlighted (blue highlight), which exhibit the largest protective effect sizes among all outlier and non-outlier samples (gray highlight) mapping to the gene. Color denotes LD (1000 Genomes European) relative to the lead variant (smallest P value) (purple diamond) in HSD17B12 gene locus. C. Example gene locus highlighting an outlier-associated variant (blue highlight) with the largest protective effect sizes among all outlier and non-outlier samples (gray highlight) mapping to the DENND1B gene. Points are colored by LD (1000 Genomes European) relative to lead variant (smallest P value) (purple diamond) in gene locus. D. P value rank for SNP rs11589930:C>A across all UKBB Phase 1 GWAS (N = 2,419). Red dashed line indicates Bonferroni P value cutoff.

Comment in

References

    1. Westra H-J et al. Systematic identification of trans eQTLs as putative drivers of known disease associations. Nat. Genet. 45, 1238–1243 (2013). - PMC - PubMed
    1. Bonder MJ et al. Disease variants alter transcription factor levels and methylation of their binding sites. Nat. Genet. 49, 131–138 (2017). - PubMed
    1. Zhernakova DV et al. Identification of context-dependent expression quantitative trait loci in whole blood. Nat. Genet. 49, 139–145 (2017). - PubMed
    1. Consortium G & GTEx Consortium. Genetic effects on gene expression across human tissues. Nature vol. 550 204–213 (2017). - PMC - PubMed
    1. Lappalainen T et al. Transcriptome and genome sequencing uncovers functional variation in humans. Nature 501, 506–511 (2013). - PMC - PubMed

Publication types