. 2021 Apr;22(4):471-484.
doi: 10.1038/s41590-021-00889-2. Epub 2021 Mar 4.

Wnt-β-catenin activation epigenetically reprograms Treg cells in inflammatory bowel disease and dysplastic progression

Affiliations

Wnt-β-catenin activation epigenetically reprograms Treg cells in inflammatory bowel disease and dysplastic progression

Jasmin Quandt et al. Nat Immunol. 2021 Apr.

Abstract

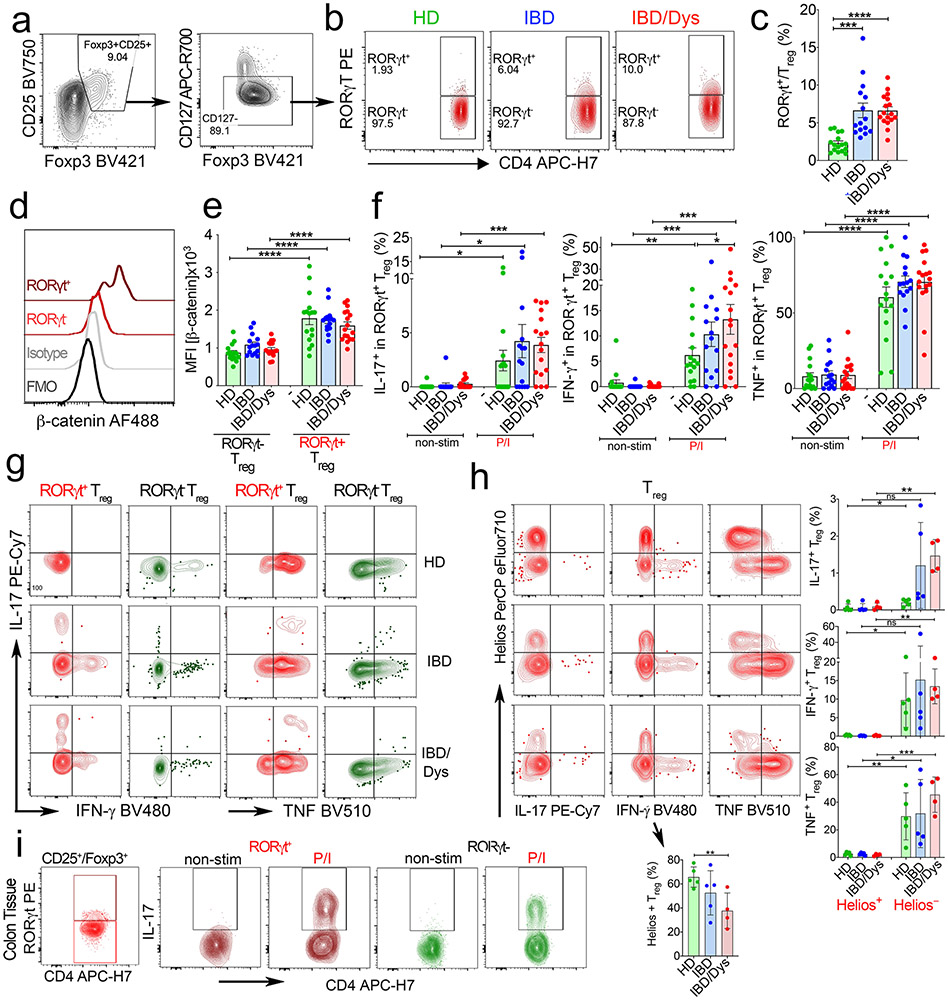
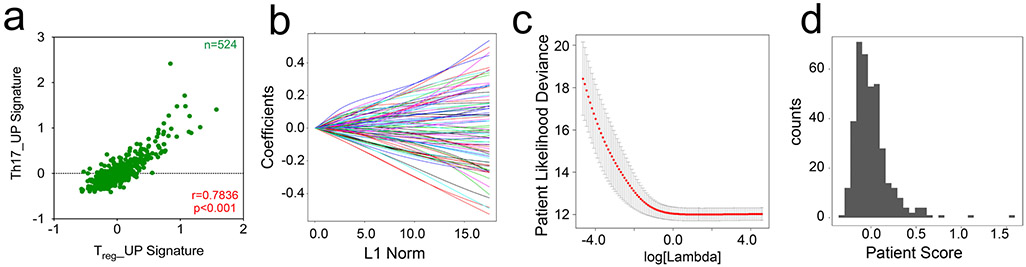
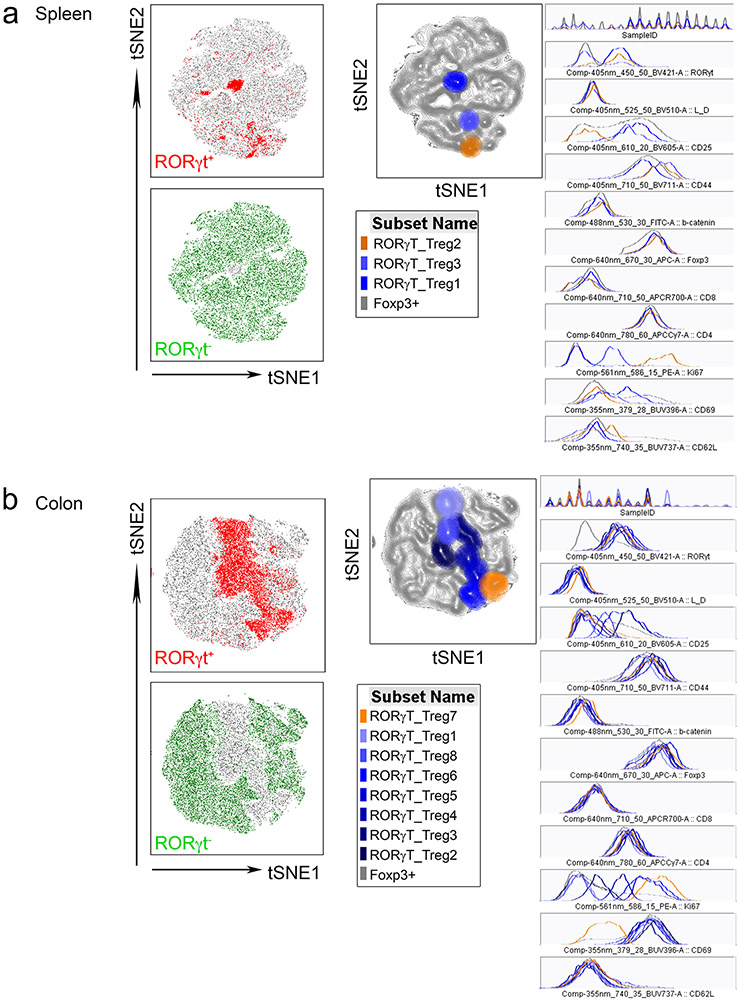
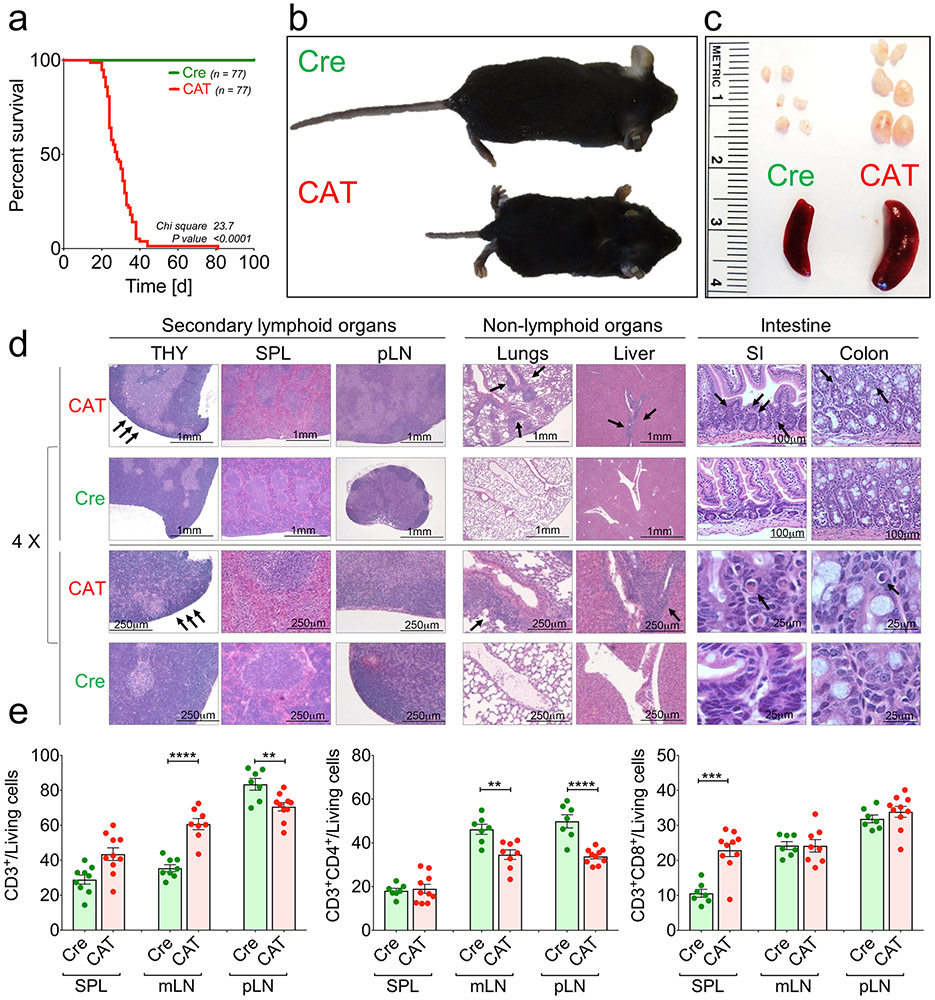
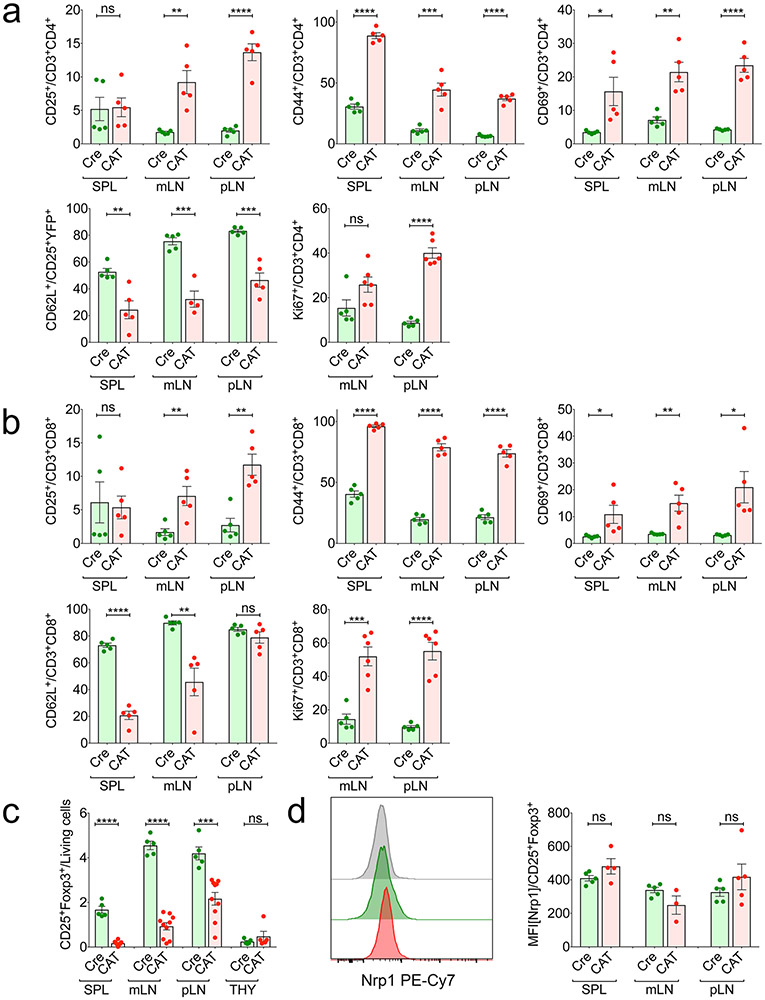
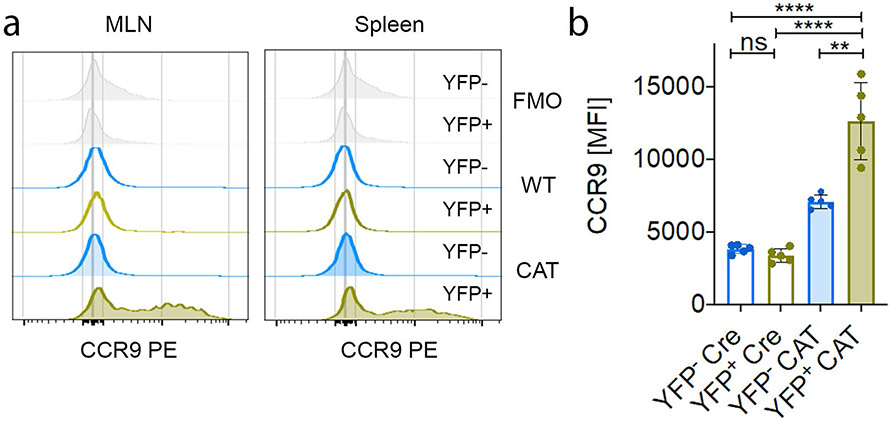
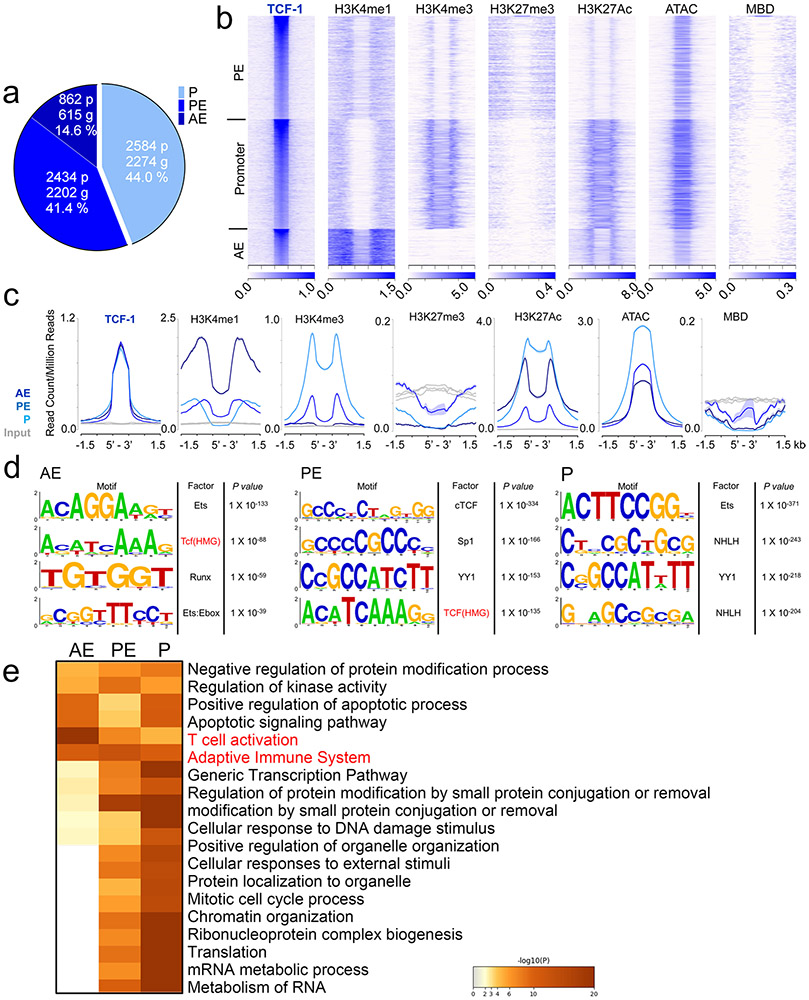
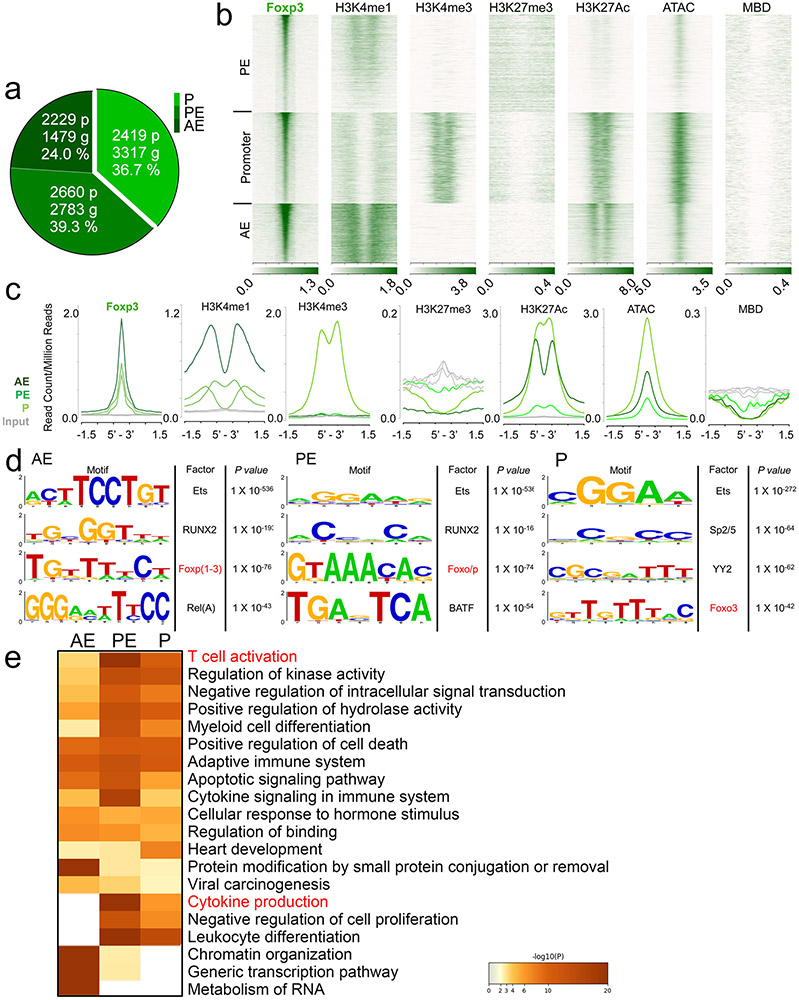
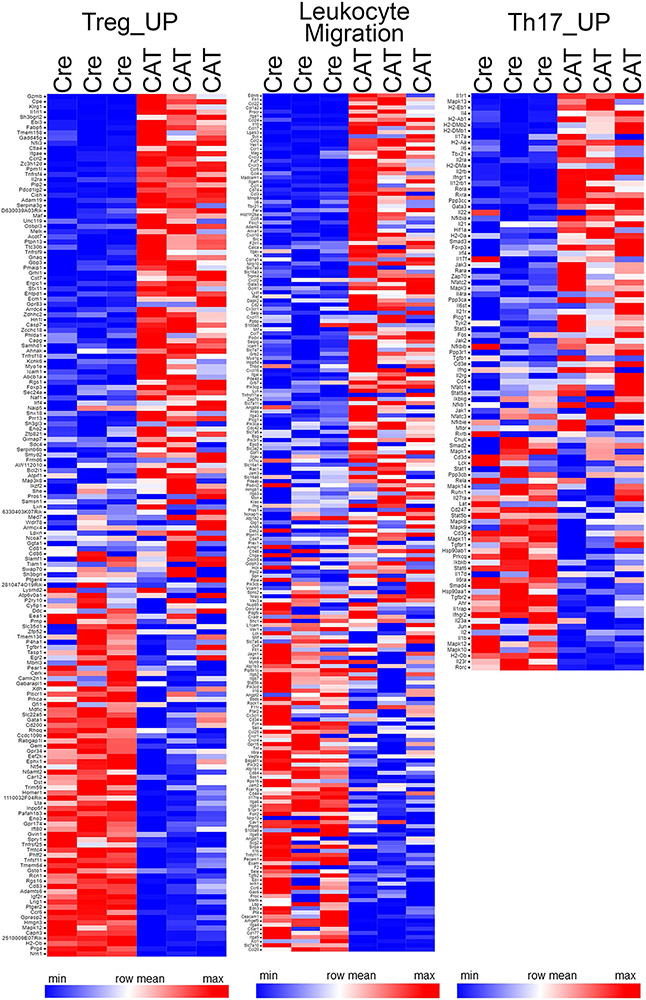
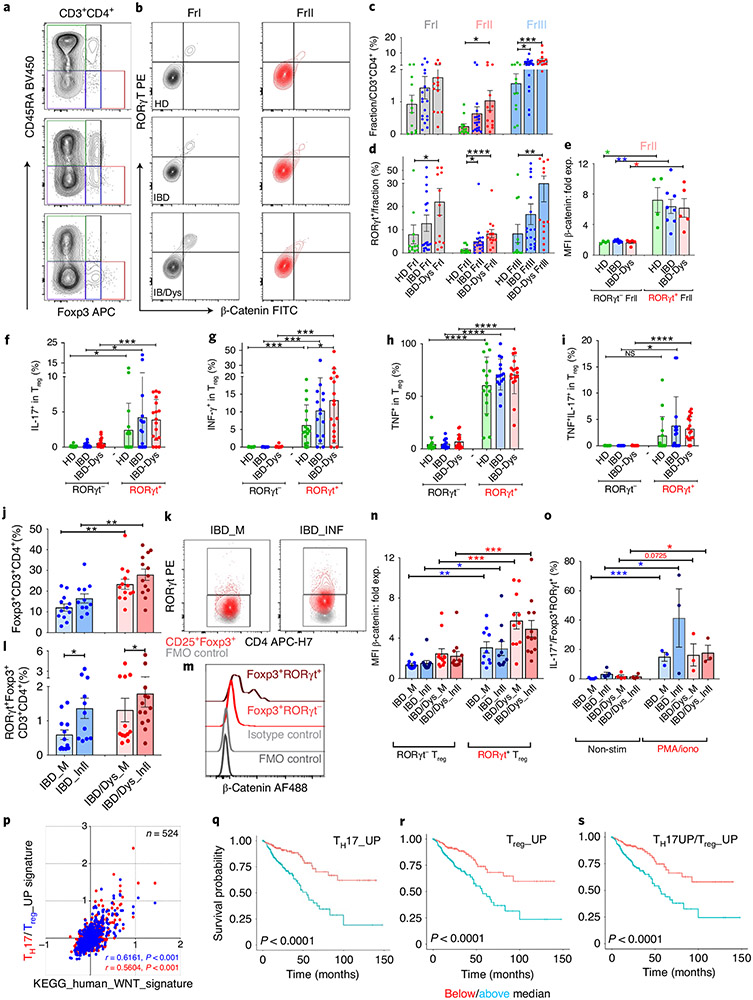
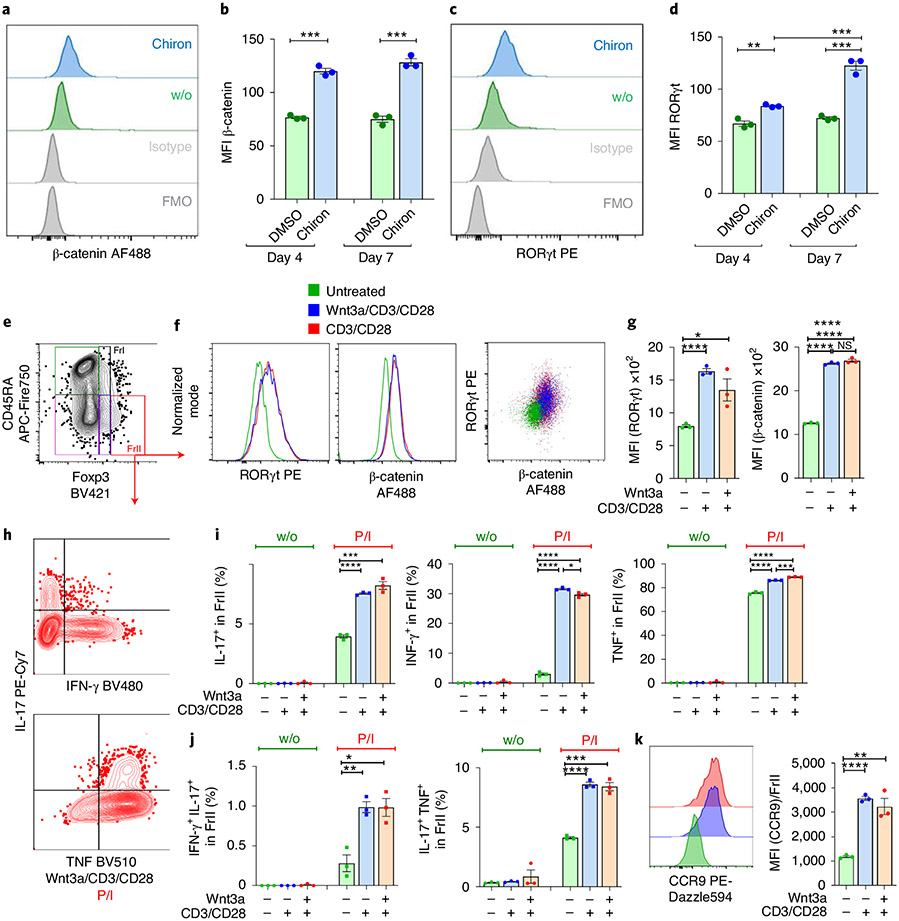
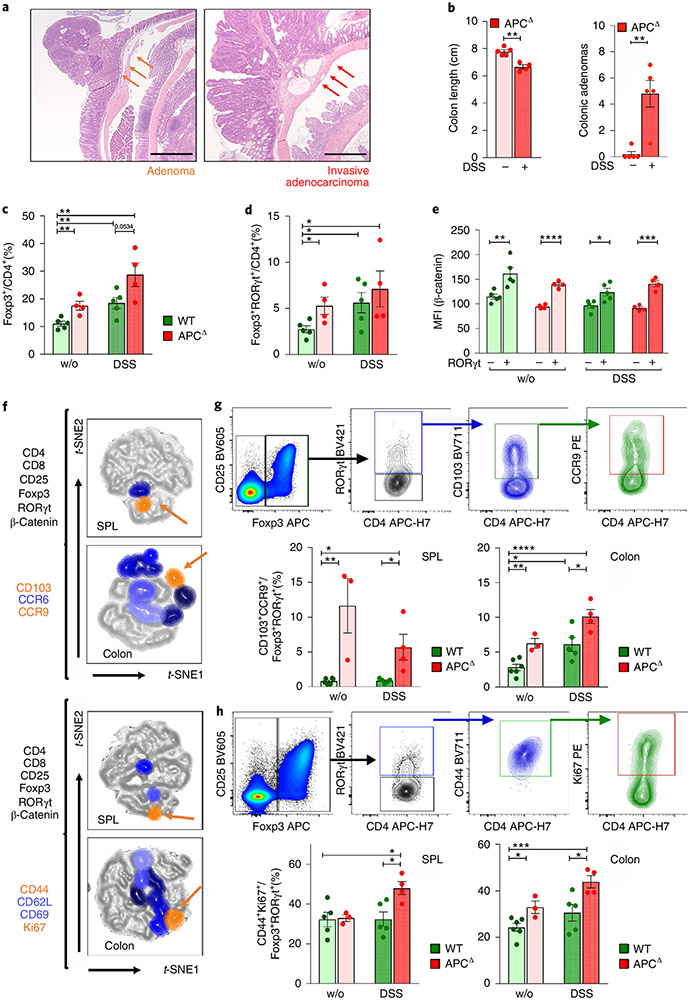
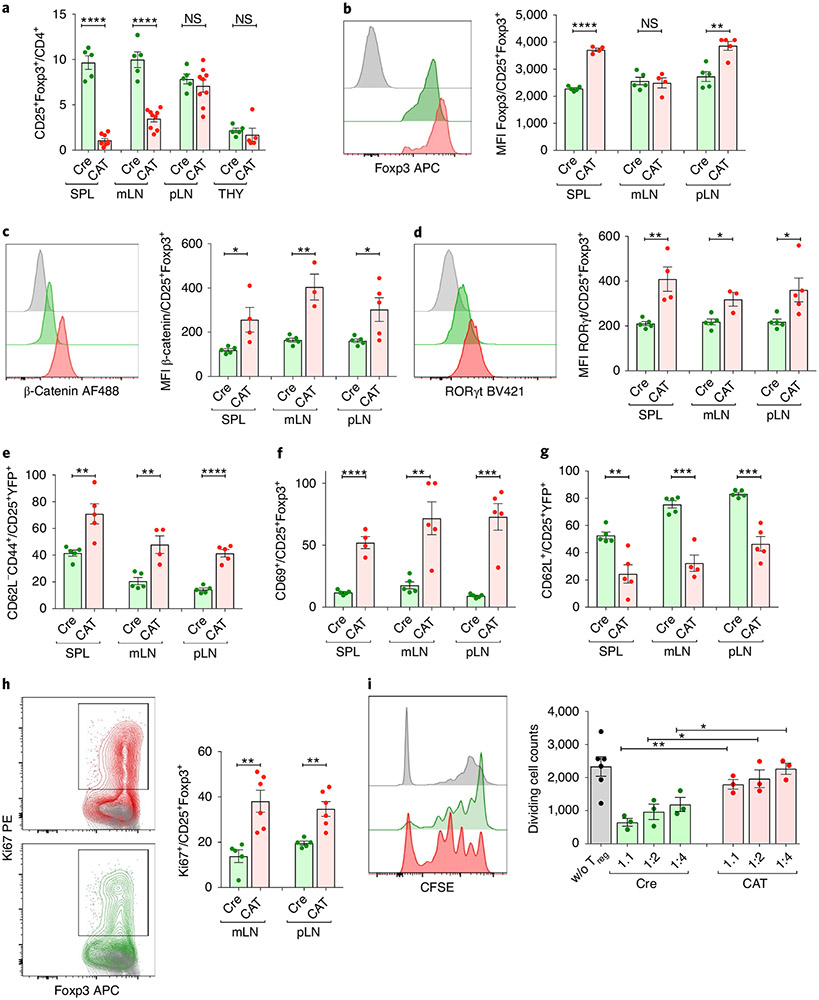
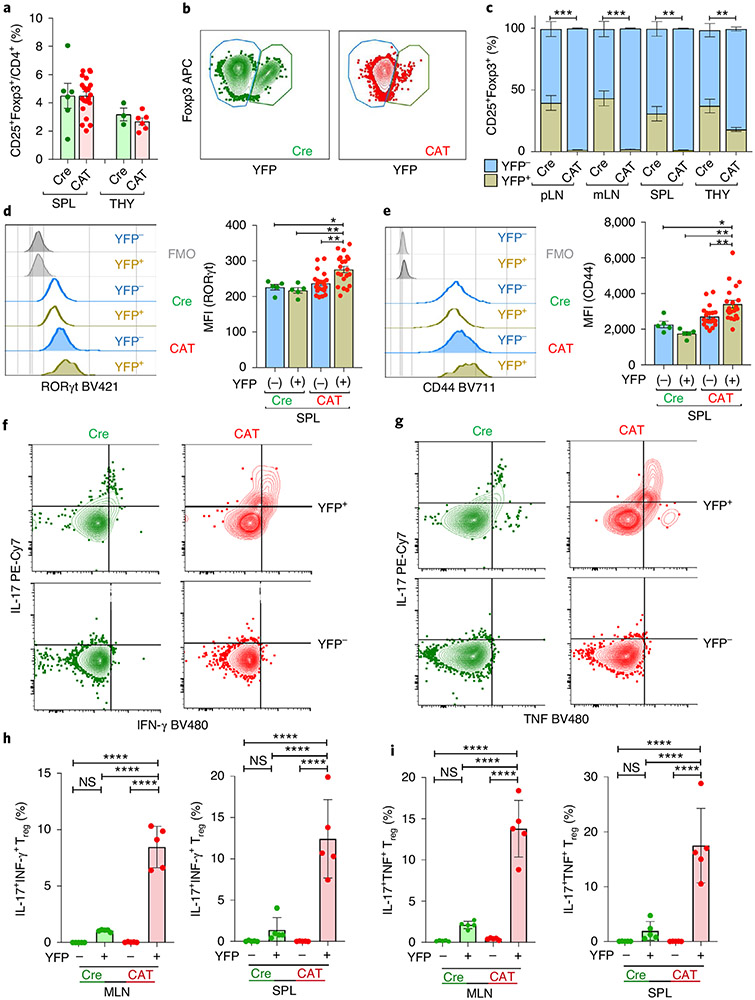
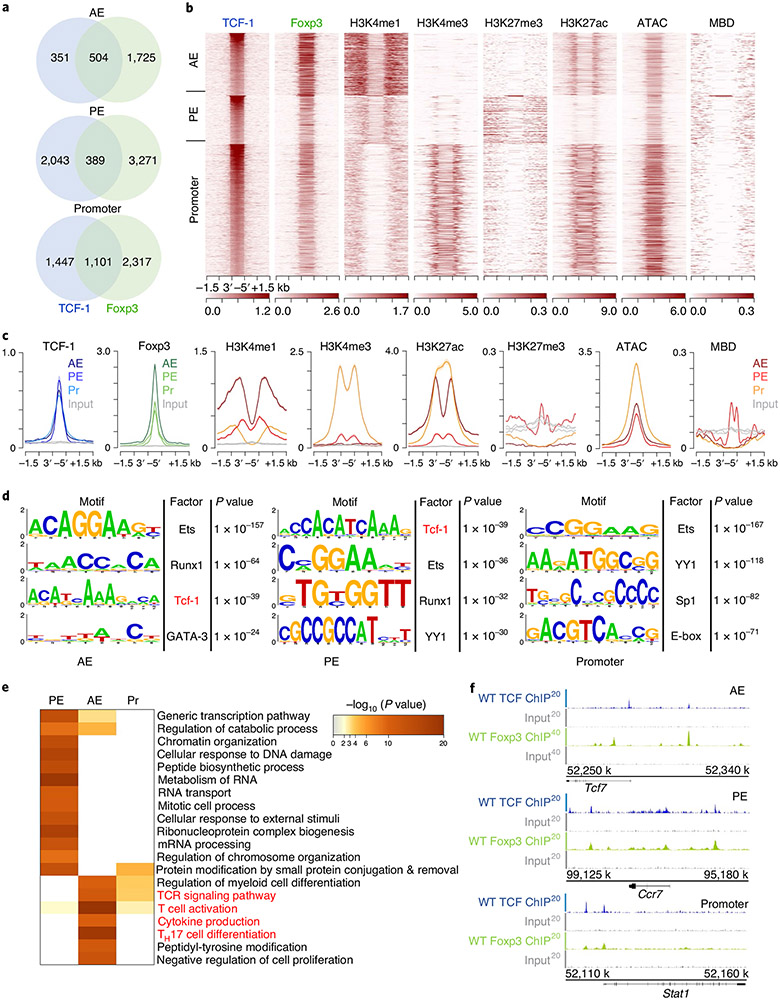
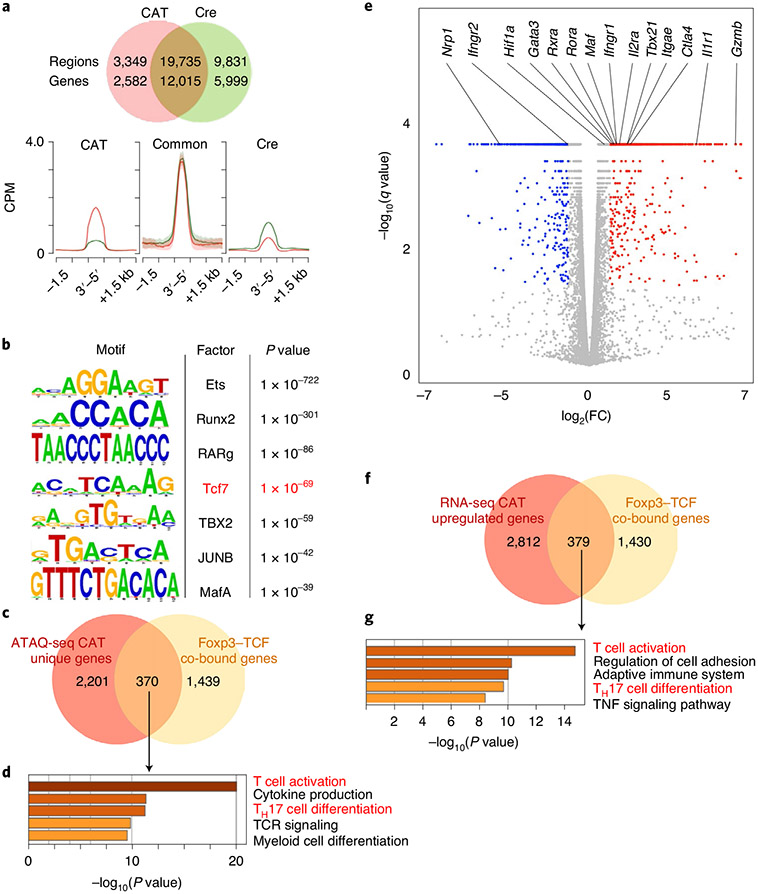
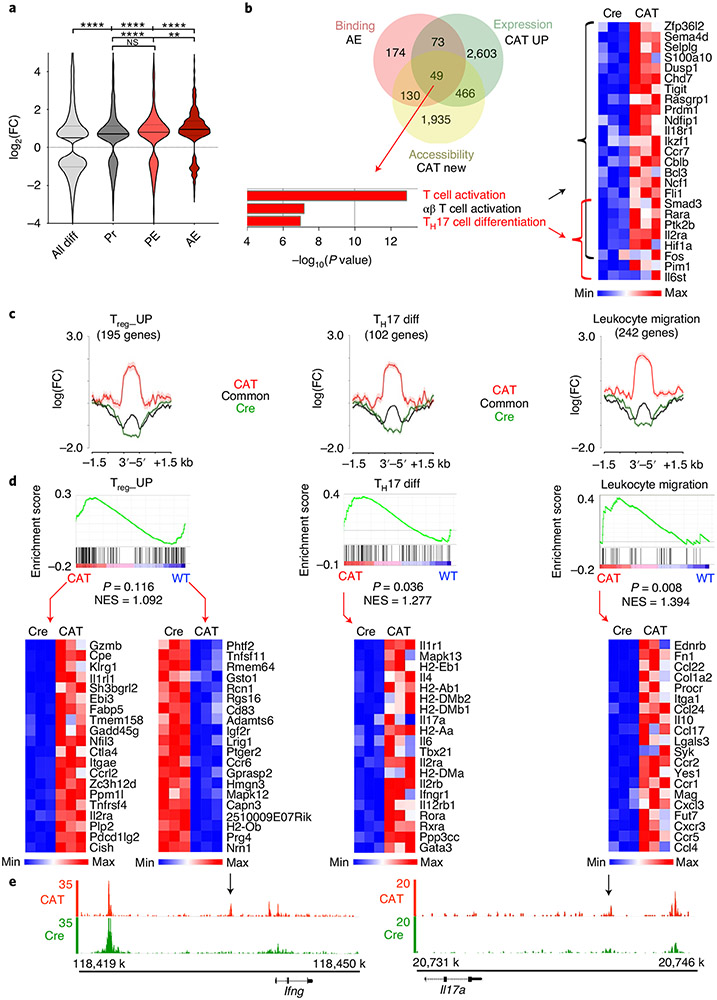
The diversity of regulatory T (Treg) cells in health and in disease remains unclear. Individuals with colorectal cancer harbor a subpopulation of RORγt+ Treg cells with elevated expression of β-catenin and pro-inflammatory properties. Here we show progressive expansion of RORγt+ Treg cells in individuals with inflammatory bowel disease during inflammation and early dysplasia. Activating Wnt-β-catenin signaling in human and murine Treg cells was sufficient to recapitulate the disease-associated increase in the frequency of RORγt+ Treg cells coexpressing multiple pro-inflammatory cytokines. Binding of the β-catenin interacting partner, TCF-1, to DNA overlapped with Foxp3 binding at enhancer sites of pro-inflammatory pathway genes. Sustained Wnt-β-catenin activation induced newly accessible chromatin sites in these genes and upregulated their expression. These findings indicate that TCF-1 and Foxp3 together limit the expression of pro-inflammatory genes in Treg cells. Activation of β-catenin signaling interferes with this function and promotes the disease-associated RORγt+ Treg phenotype.


Figures

Extended Data Fig. 1 ∣
Extended Data Fig. 1 ∣. RORγt+ Treg cells producing pro-inflammatory cytokines expand in the PB/colonic mucosa of IBD patients.
Flow cytometric gating scheme to identify Treg cells in PB a. Live CD3+CD4+CD25+ Foxp3+ cells were assessed for CD127 expression and CD127CD3+CD4+CD25+Foxp3+ Treg cells were gated for the analyses in b-f. b. Dotplots of RORγt versus CD4 expression in PB Treg cells of representative HD (HD21), and IBD (IMB29), and IBD/Dys (IMB17) patients c. Relative frequencies of RORγt+ cells within PB Treg cells. d. Representative β-catenin expression in RORγt+/RORγt PB Treg cells. e. Cumulative β-catenin expression in RORγt+/RORγt PB Treg cells (MFI). f. IL-17, IFN-γ, and TNF production in RORγt+ PB Treg cells before and after stimulation by PMA/ionomycin as indicated. b-f. two-sided unpaired t-test. Number of samples in c,e,f. HD(n = 16), IBD(n = 15), IBD_Dys(n = 17) g. Flow cytometric gating scheme assessing pro-inflammatory cytokine production by RORγt+ and RORγt PB Treg populations (CD127CD3+CD4+CD25+Foxp3+) after PMA/ionomycin stimulation. h. (left) Flow cytometric gating scheme for assessing pro-inflammatory cytokine production versus Helios expression in PB Treg cells, (right) Cumulative frequencies of Helios+ Treg cells in HD(n = 5), IBD(n = 5) and IBD/Dys(n = 4) patients, and IL-17, IFN-γ, and TNF expression in Helios+ and Helios PB Treg cells of the same samples (two-sided unpaired t-test). i. Flow cytometric gating scheme for assessing IL-17 production by CD3+CD4+Foxp3+ RORγt+ and RORγT colonic mucosa Treg cells.
Extended Data Fig. 2 ∣
Extended Data Fig. 2 ∣. The expression of Th17 and Treg cell signature genes in the TCGA CRC dataset indicate a prognostic relevance.
a–d. Analysis of the TCGA CRC cohort: a. Spearman correlation of average z-scores for the Th17_UP versus Treg_UP (blue, r = 0.7836, p < 0.001) signatures in CRC patients (n = 524). b. Ridge regression regularization and, c. cross validation of the deployed Cox proportional-hazards regression on the CRC clinical data extracted from TCGA. d. Histogram of Th17 gene-based score distribution through the CRC patient cohort (median = −0.033). If not stated differently data are represented as median +/− SEM and statistical testing is depicted as *P ≤ 0.05, **P ≤ 0.01, ***P ≤ 0.001, ****P ≤ 0.0001.
Extended Data Fig. 3 ∣
Extended Data Fig. 3 ∣. tSNE projection of flow cytometric data identifies unique populations within RORγt+ Treg cells in the APC/DSS IBD-associated CRC model.
Strategy for tSNE projection of a, splenic and b, colon-tissue resident Treg populations exemplarily shown for the activation marker flow-cytometric panel: Treg populations (gated on as live/dead stain negative, CD4+CD8Foxp3+) from all samples of all treatment groups were concatenated into one fcs file and the tSNE analysis was performed on the concatenated file (settings used for FlowJo tSNE Plugin Tool: Iterations = 1000, Perplexity = 30, ETA/Learning Rate = 100). RORγt positive and negative fractions of Treg cells are indicated in red and green in the tSNE landscapes, respectively. Different RORγt+ Treg populations were identified within in the tSNE plot and histogram expression profiles of identified RORγt+ Treg populations are shown.
Extended Data Fig. 4 ∣
Extended Data Fig. 4 ∣. Treg cell specific up-regulation of β-catenin leads to a severe scurfy-like phenotype in mice.
a, Kaplan-Mayer survival curve of Foxp3Cre(0/+) wild-type (Cre) and Foxp3Cre(0/+) Ctnnb1fl(ex3) (CAT) male mice. b, Representative picture of the scurfy-like phenotype of a CAT mouse compared to a Cre mouse (26 d old). c, Representative picture of the pathologic enlargement of peripheral LNs and splenomegaly in a CAT mouse compared to a Cre litter mate control mouse. d, H&E-stainings of paraffin sections from organs of a representative 21 d old male CAT mouse and a Cre litter mate. Enlargement of secondary lymphoid organs (SPL – spleen & pLNs – peripheral lymph nodes) and reduction of the thymic cortex (THY – thymus, arrows) in CAT mice. CAT mice show severe immune infiltrates in lung and liver (middle panels, arrows), and eosinophil infiltration in the small intestine (SI) and colon (arrows). Size are provided in the images. At least 4 independent CAT and Cre litter mate mice were analysed. e, Frequency of CD3+, CD3+CD4+, and CD3+CD8+ T cell numbers in peripheral lymphoid organs of 3-4 weeks old Cre and CAT mice as determined by flow cytometric analysis. Cre_SPL(n = 7), Cre_mLN(n = 7), Cre_pLN(n = 7), CAT_SPL(n = 10), CAT_mLN(n = 8), p(CAT_mLN) = 10, data are represented as median +/− SEM and statistical testing is depicted as two-sided unpaired t-tests with *P ≤ 0.05, **P ≤ 0.01, ***P ≤ 0.001, ****P ≤ 0.0001.
Extended Data Fig. 5 ∣
Extended Data Fig. 5 ∣. Treg cell specific stabilization of β-catenin results in severe systemic T cell activation and an altered Treg cell phenotype.
Activation status of a, CD3+CD4+ conventional T cells and, b, CD3+CD8+ CTLs was assessed via flow cytometric staining for CD25, CD44, CD69, CD62L, and Ki67 in peripheral lymphoid organs of 3-4 weeks old Foxp3Cre(0/+) wild-type (Cre) and Foxp3Cre(0/+) Ctnnb1fl(ex3) (CAT) male mice (CAT(n = 5), WT(n = 5)). c, Frequencies of total Treg cells within viable cells in peripheral lymphoid organs and the thymus (Cre_SPL(n = 5), Cre_mLN(n = 5), Cre_pLN(n = 5), Cre_THY(n = 5), CAT_SPL(n = 10), CAT_mLN(n = 10), CAT_pLN(n = 10), CAT_THY(n = 5)). d, Expression of Neuropilin in Cre and CAT Treg cells depicted as representative flow plots and cumulative column plots throughout peripheral lymphoid organs (Cre_SPL(n = 5), Cre_mLN(n = 5), Cre_pLN(n = 5), CAT_SPL(n = 4), CAT_mLN(n = 3), CAT_THY(n = 5)). Data are represented as median +/− SEM and statistical testing is depicted as two-sided unpaired t-tests with *P ≤ 0.05, **P ≤ 0.01, ***P ≤ 0.001, ****P ≤ 0.0001.
Extended Data Fig. 6 ∣
Extended Data Fig. 6 ∣. The chemokine receptor CCR9 is upregulated in β-cateninhi Treg cells.
a, Representative histograms for flow cytometric characterization of CCR9 expression in the natural chimera female heterozygote CD3+CD4+CD25+Foxp4+ Treg cells comparing YFP+ (Cre+) to YFP (Cre) populations in Foxp3Cre(+/−) Ctnnb1fl(ex3) (CAT) and Foxp3Cre(+/−) (Cre) chimeras in MLN and Spleen, as indicated. (FMO = fluorescence minus one negative staining control). b, Quantification of CCR9 MFI respresented as bar graphs in MLN (Cre(n = 5), CAT(n = 5)). Data are represented as median +/− SEM and statistical testing is depicted as one way Anova multiple comparisons with *P ≤ 0.05, **P ≤ 0.01, ***P ≤ 0.001, ****P ≤ 0.0001.
Extended Data Fig. 7 ∣
Extended Data Fig. 7 ∣. TCF-1 binds gene loci that are involved in T cell activation and survival in wild-type Treg cells.
a, Pie chart of the distribution of TCF-1 binding in genomic regions (P = promoter, PE = poised enhancer, AE = active enhancer) identified by K-means-clustering. Peak numbers (p), corresponding gene numbers (g), and relative percentages (%) for each genomic region. b, Heat maps centered on TCF-1 binding in indicated genomic regions (± 1.5 kb) and enrichment of histone marks (H3K4me1, H3K4me3, H3K27me3, H3K27Ac), chromatin accessibility (ATAC), and DNA methylation (MBD). c, Enrichment histograms of TCF-1 binding, histone marks, chromatin accessibility, and DNA methylation marks at TCF-1 bound sites (± 1.5 kb) in the indicated genomic regions. d, De novo transcription-factor-binding motif analysis (HOMER) of TCF-1-bound sites for the indicated genomic regions. Most, significantly enriched motifs and corresponding p values are listed. e, Functional pathways enriched for TCF-1-bound genes in the indicated genomic regions. Pathways and statistical enrichment were determined using Metascape (http://www.metascape.org).
Extended Data Fig. 8 ∣
Extended Data Fig. 8 ∣. Foxp3 preferentially binds accessible chromatin and its consensus motif within different regulatory elements of genes in Treg cells.
a, Pie chart of the distribution of Foxp3 binding in genomic regions (P = promoter, PE = poised enhancer, AE = active enhancer) identified by K-means-clustering. Peak numbers (p), corresponding gene numbers (g), and relative percentages (%) for each genomic region. b, Heat maps centered on Foxp3 binding in indicated genomic regions (± 1.5 kb) and enrichment of histone marks (H3K4me1, H3K4me3, H3K27me3, H3K27Ac), chromatin accessibility (ATAC), and DNA methylation (MBD). c, Enrichment histograms of Foxp3 binding, histone marks, chromatin accessibility, and DNA methylation marks at Foxp3 bound sites (± 1.5 kb) in the indicated genomic regions. d, De novo transcription-factor-binding motif analysis (HOMER) of TCF-1-bound sites for the indicated genomic regions. Most, significantly enriched motifs and corresponding p values are listed. e, Functional pathways enriched for TCF-1-bound genes in the indicated genomic regions. Pathways and statistical enrichment were determined using Metascape (http:/www.metascape.org).
Extended Data Fig. 9 ∣
Extended Data Fig. 9 ∣. Wnt/β-catenin activation does not significantly alter the Treg_UP signature and enhances the expression of leukocyte migration signature genes in Treg cells.
RNA expression heat maps (n = 3 biological replicates for each genotype, FPKMs) showing genes of GSEA analysis for the Treg_UP, TH17_UP, and leukocyte migration signature displayed in Fig. 8d of CAT versus Cre Treg cells.
Fig. 1 ∣
Fig. 1 ∣. β-Cateninhi RORγt+ Treg cells producing IL-17, IFN-γ and TNF expand during inflammatory bowel disease progression.
a, Live CD3+CD4+ cells divided into five fractions according to CD45RA versus Foxp3 expression. b, RORγt versus β-catenin expression assessed in Fr.I and Fr.II Treg cells. Representative samples from HDs (HD8), and individuals with IBD (IMB11) and IBD/Dys (IMB6). c, Cumulative frequencies of Fr.I and Fr.II Treg cells and Fr.III T cells in PB of HDs (n = 12) and individuals with IBD (n = 19) and IBD/Dys (n = 13). d, Relative frequencies of RORγt+ cells within Fr.I, Fr.II and Fr.III of samples in c (two-sided Kruskal–Wallis test). e, Cumulative β-catenin expression in PB RORγt+/RORyt Fr.II Treg cells in HDs (n = 4) and individuals with IBD (n = 8) and IBD/Dys (n = 5) depicted as mean fluorescence intensity (MFI) normalized to isotype/fluorescence minus one (FMO) negative staining controls for each individual (two-sided, paired t-test). f-i, IL-17 (f), IFN-γ (g), TNF (h) and IL-17 + TNF (i) production after PMA/ionomycin stimulation in RORγt and RORγt+ CD4+CD25+Foxp3+CD127 PB Treg cells assessed by intracellular cytokine staining (two-sided, paired t-test; HDs (n = 16); IBD (n = 15); IBD/Dys (n = 17). j, Cumulative frequencies of CD3+CD4+Foxp3+ cells in inflamed (INF) and less inflamed (margin; M) mucosa of IBD and IBD/Dys samples. k,l, Flow plots (k) and cumulative frequencies (l) of Foxp3+RORγt+ Treg cells. m,n, Flow cytometric histogram (m) and cumulative normalized MFI (n) of β-catenin expression in RORγt+/RORγt Treg cells. j-n, IBD_M (n = 12); IBD_INF (n = 11); IBD/Dys_M (n = 13); IBD/Dys_INF (n = 13); two-sided, paired t-test. o, IL-17 production before (non-stim) and after (PMA/iono) stimulation of mucosal Treg populations assessed by intracellular staining (non-stim: IBD_M (n = 5), IBD_INF (n = 5), IBD/Dys_M (n = 4), IBD/Dys_INF (n = 4); PMA/iono: IBD_M (n = 3), IBD_INF (n = 3), IBD/Dys_M (n = 3), IBD/Dys_INF (n = 3); two-sided, unpaired t-test). p-s, Analysis of the TCGA CRC cancer cohort. p, Spearman’s correlation of average z-scores for the KEGG_human_WNT signature versus the combined TH17_UP (red; r = 0.5604, P < 0.001) and Treg_UP (blue; r = 0.6161, P < 0.001) signatures in individuals with CRC (n = 524). q-s, Kaplan–Meier plots generated after dichotomizing individuals with CRC on the median levels of TH17_UP, Treg_UP and TH17_UP/Treg_UP signature-based scores (P < 0.001, log-rank test). Unless stated otherwise, data are represented as the median ± s.e.m., and statistical testing is depicted as *P ≤ 0.05, **P ≤ 0.01, ***P ≤ 0.001, ****P ≤ 0.0001. NS, not significant.
Fig. 2 ∣
Fig. 2 ∣. Ex vivo stabilization of β-catenin in human Treg cells induces the pro-inflammatory phenotype.
a–d, Ex vivo treatment of HD PBMCs with GSK-3β inhibitor Chiron for 4 to 7 d. Flow cytometric histograms and cumulative MFI analysis of β-catenin (a and b) and RORγt (c and d) expression in CD25+Foxp3+ Treg cells in these cultures. DMSO, dimethylsulfoxide. e–k, Ex vivo Wnt signaling pathway induction in HD PBMCs. e, Representative gating scheme to identify Treg cell fractions f, Representative flow cytometric histograms and dot plot of β-catenin and RORγt expression in Fr.II Treg cells on day 6 of culture. g, Cumulative MFI analysis of β-catenin and RORγt expression in Treg cells. h, Representative flow cytometric profiles of IL-17 versus IFN-γ or TNF production in Fr.II Treg cells. i,j, Cumulative analysis of IL-17+, IFN-γ+ and TNF+ Fr.II Treg cells (i), and dual production of IL-17/IFN-γ and IL-17/TNF (j), before and after stimulation with PMA/ionomycin (P/I). k, Representative flow cytometric histograms and cumulative MFI analysis of CCR9 expression. Each experiment was performed three times (with PBMCs from different HDs) in triplicate; data are represented as the median ± s.e.m., and statistical testing is depicted as two-sided, unpaired t-tests; *P ≤ 0.05, **P ≤ 0.01, ***P ≤ 0.001, ****P ≤ 0.0001.
Fig. 3 ∣
Fig. 3 ∣. Activated RORγt+ Treg cell subpopulations peripherally expand during disease progression in a murine IBD/CRC model.
a, Representative H&E staining of an adenoma and an invasive adenocarcinoma (scale bar: 1 mm). b, Colon length and adenoma numbers in the colon of DSS-treated and untreated ApcΔ mice. c,d, Frequencies of colon-resident Foxp3+ Treg cells (c) and RORγt+ Treg cells (d) within CD4+CD8 T cells for the four treatment groups. e, β-catenin expression of RORγt+ versus RORγt Treg cell populations. f, Identification and characterization of RORγt+ Treg subpopulations that increase in frequency during disease progression via t-SNE projection of multicolor flow cytometric data; two independent flow cytometric panels characterize migratory behavior and activation status. Orange arrows indicate shared populations between spleen (SPL) and colon. g,h, Gating for and quantification of shared RORγt+ Treg cell populations in different anatomic locations and treatment groups for the migratory (g) and activation (h) flow cytometric panels. WT (n = 6), WT + DSS (n = 5), APCΔ (n = 4), APCΔ + DSS (n = 4); one of a series of three experiments; data are represented as the median ± s.e.m., and statistical testing is depicted as two-sided, unpaired t-tests; *P ≤ 0.05, **P ≤ 0.01, ***P ≤ 0.001, ****P ≤ 0.0001.
Fig. 4 ∣
Fig. 4 ∣. Treg cell-specific β-catenin stabilization results in an activated Treg cell phenotype in mice.
a, Frequency of CD25+Foxp3+ Treg cells in Cre and CAT mice within CD3+CD4+ T cells (CAT (n = 10), Cre (n = 5)). bd, Intracellular expression of Foxp3 (b), β-catenin (c) and RORγt (d) in Foxp3Cre(0/+) WT (Cre) and Foxp3Cre(0/+) Ctnnb1fl(ex3) (CAT) Treg cells, depicted as representative flow plots and cumulative column plots for peripheral lymphoid organs; Cre_SPL (n = 5), Cre_mLN (n = 5), Cre_pLN (n = 5), CAT_SPL (n = 4), CAT_mLN (n = 4), CAT_mLN (n = 5). eh, Activation status and proliferation of Treg cells in Cre and CAT mice was determined through staining and flow cytometric analysis of CD44 (e) (Cre_SPL (n = 5), Cre_mLN (n = 5), Cre_pLN (n = 5), CAT_SPL (n = 5), CAT_mLN (n = 4), CAT_mLN (n = 5)), CD69 (f) (Cre_SPL (n = 5), Cre_mLN (n = 5), Cre_pLN (n = 5), CAT_SPL (n = 4), CAT_mLN (n = 5), CAT_mLN (n = 5)), CD62L (g) (Cre_SPL (n = 5), Cre_mLN (n = 5), Cre_pLN (n = 5), CAT_SPL (n = 5), CAT_mLN (n = 4), CAT_mLN (n = 5)) and Ki67 (h) (Cre_SPL (n = 5), Cre_pLN (n = 5), CAT_SPL (n = 6), CAT_mLN (n = 6)) in the indicated lymphoid organs. i, Representative flow cytometric histograms and cumulative analysis of the suppressive capacity of Treg cells derived from Cre versus CAT mice. Fraction of proliferating, polyclonally activated CD4+ Tcon cells is shown. 1:1, 1:2, 1:4 = Treg:Tcon ratio (CAT (n = 3), Cre (n = 3) and untreated (w/o; n = 6) Treg cells). Data are represented as the median ± s.e.m., and statistical testing is depicted as two-sided, unpaired t-tests; *P ≤ 0.05, **P ≤ 0.01, ***P ≤ 0.001, ****P ≤ 0.0001.
Fig. 5 ∣
Fig. 5 ∣. β-cateninhi Treg cells have a competitive disadvantage in an unperturbed chimeric setting.
ai, Flow cytometric characterization of Foxp3Cre(+/−) Ctnnb1fl(ex3) (CAT) and Foxp3Cre(+/−) (Cre) heterozygous female mice representing intrinsic Treg chimeras. a, Frequency of Treg cells within CD4+ T cells in spleen and thymus (Cre_SPL (n = 6), CAT_SPL (n = 21), Cre_THY (n = 3), CAT_THY (n = 6)). b,c, Representative flow cytometric dot plots (b) and quantification (c) of Cre+/YFP+ and Cre/YFP fractions in lymphoid organs (Cre_pLN (n = 5), CAT_pLN (n = 5), Cre_mLN (n = 5), CAT_mLN (n = 5), Cre_SPL (n = 6), CAT_SPL (n = 21), Cre_THY (n = 3), CAT_THY (n = 6)). d,e, Representative flow cytometric histograms and cumulative analyses of RORγt (d) and CD44 (e) expression in YFP+/YFP Treg cells; Cre (n = 5), CAT (n = 21). f,g, Representative flow cytometric dot plots of IL-17 versus IFN-γ (f) and IL-17 versus TNF (g) production in YFP+ versus YFP Cre and CAT mLN Treg cells. h,i, Cumulative analysis of the frequencies of coproduction of IL-17 and IFN-γ (h) and IL-17 and TNF (i) in YFP+ and YFP Cre and CAT Treg cells in mLNs and spleen; Cre (n = 5), CAT (n = 5); data are represented as the median ± s.e.m., and statistical testing is depicted as two-sided, unpaired t-tests; *P ≤ 0.05, **P ≤ 0.01, ***P ≤ 0.001, ****P ≤ 0.0001.
Fig. 6 ∣
Fig. 6 ∣. TCF-1 co-binds accessible chromatin with Foxp3 at crucial Treg cell gene loci.
a, Venn diagrams of overlapping TCF-1 (blue) and Foxp3 (green) binding sites (numbers of peaks) in the genomic regions identified in Extended Data Figs. 6 and 7 in Treg cells for TCF-1 and Foxp3, respectively. b, Heat map of TCF-1-Foxp3 co-bound genomic regions (±1.5 kb). Enrichment of histone marks (H3K4me1, H3K4me3, H3K27me3 and H3K27ac), chromatin accessibility (ATAC) and DNA methylation (MBD) are shown. c, Comparative enrichment histograms of transcription factor binding (TCF-1 and Foxp3), histone marks, chromatin accessibility and DNA methylation marks at TCF-1-Foxp3 co-bound sites (±1.5 kb) in the genomic regions established above. d, De novo transcription factor-binding motif analysis (HOMER) of TCF-1-Foxp3 co-bound sites in the indicated genomic regions. The most highly significantly enriched motifs and corresponding P values are listed. e, Functional pathways enriched for TCF-1-Foxp3 co-bound genes in the indicated genomic regions. Pathways and their statistical enrichment were determined using Metascape. f, Representative TCF-1-Foxp3 co-bound regions at the indicated loci (IGB tracks) for the different genomic regions. ChIP-seq enrichment tracks for TCF-1 and Foxp3 and respective input controls are shown.
Fig. 7 ∣
Fig. 7 ∣. Activation of β-catenin in Treg cells increased the accessibility and transcription of genes in TH17 differentiation and T cell activation pathways.
a, Venn diagram comparing accessible chromatin sites in CAT (red) versus Cre (green) Treg cells and comparative enrichment histograms of chromatin accessibility at CAT and Cre common sites, newly gained in CAT sites, as well as Cre unique sites. CPM, counts per million mapped reads. b, De novo transcription factor-binding motif analysis (HOMER) of newly accessible sites in CAT Treg cells. The most significantly enriched motifs and corresponding P values are listed. c, Venn diagram comparing genes gaining newly accessible sites in CAT Treg cells to TCF-1-Foxp3 co-bound genes. d, Functional pathway enrichment analysis of genes that gained accessibility in CAT Treg cells and are TCF-1-Foxp3 co-bound. e, Volcano plot of differentially expressed genes in CAT over Cre Treg cells (q-value cutoff < 1 × 10⁻⁵). f, Venn diagram comparing genes that were significantly upregulated (q < 0.05) in CAT Treg cells with TCF-1-Foxp3 co-bound genes. g, Functional pathway enrichment analysis of genes that were transcriptionally upregulated in CAT Treg cells and co-bound by TCF-1-Foxp3. Cells for ATAC-seq and RNA-seq analysis were isolated from pLNs of age-matched 21-day-old CAT and Cre WT mice.
Fig. 8 ∣
Fig. 8 ∣. β-catenin stabilization epigenetically changes the activation of critical Foxp3 and TCF-1 co-regulated genes to drive the phenotype of RORγt+ Treg cells.
a, Differential accessibility estimated by ATAC-seq in regulatory regions of TCF-1-Foxp3 co-bound genes (AE: n = 373; PE: n = 275; Pr: n = 613) compared to all differentially accessible genes (all diff: n = 14,452; data are represented as the median ± two quartiles (dotted lines). Statistical testing is depicted as a Mann–Whitney, two-sided test with **P ≤ 0.01, ****P ≤ 0.0001). FC, fold change. b, Venn diagram comparing TCF-1-Foxp3 co-bound genes in active enhancers (red), transcriptionally upregulated genes in CAT Treg cells (green) and genes that gained newly accessible chromatin sites in CAT Treg cells (yellow). Functional pathway enrichment analysis of the Venn diagram overlap and corresponding RNA expression heat map (n = 3 biological replicates for each genotype; fragments per transcript kilobase per million fragments mapped (FPKMs)) are shown. c, Differential accessibility at genes within the Treg_UP (n = 195), TH17 differentiation (n = 102) and leukocyte migration signatures (n = 242). Data are represented as the mean ± s.e.m. across the regions and shown as a semitransparent shade around the mean curves. d, GSEA (top) and associated RNA expression heat maps of indicated leading-edge genes (bottom; n = 3 biological replicates for each genotype; FPKMs). NES, normalized enrichment score. e, IGB tracks for ATAC-seq accessibility at Ifng and Il17a genomic loci in CAT and Cre Treg cells. Arrows indicate CAT-enriched open chromatin peaks.

Comment in

References

    1. Kuswanto W et al. Poor repair of skeletal muscle in aging mice reflects a defect in local, interleukin-33-dependent accumulation of regulatory T cells. Immunity 44, 355–367 (2016). - PMC - PubMed
    1. Ito M et al. Brain regulatory T cells suppress astrogliosis and potentiate neurological recovery. Nature 565, 246–250 (2019). - PubMed
    1. Zhu J, Yamane H & Paul WE Differentiation of effector CD4 T cell populations. Annu. Rev. Immunol 28, 445–489 (2010). - PMC - PubMed
    1. Levine AG et al. Stability and function of regulatory T cells expressing the transcription factor T-bet. Nature 546, 421–425 (2017). - PMC - PubMed
    1. Yu F, Sharma S, Edwards J, Feigenbaum L & Zhu J Dynamic expression of transcription factors T-bet and GATA-3 by regulatory T cells maintains immunotolerance. Nat. Immunol 16, 197–206 (2015). - PMC - PubMed

Publication types

MeSH terms