. 2021 Feb 26:15:859-869.
doi: 10.2147/OPTH.S304272. eCollection 2021.

Comparison of Visual Acuity Measurement Using Three Methods: Standard ETDRS Chart, Near Chart and a Smartphone-Based Eye Chart Application

Affiliations

Comparison of Visual Acuity Measurement Using Three Methods: Standard ETDRS Chart, Near Chart and a Smartphone-Based Eye Chart Application

Nanida Tiraset et al. Clin Ophthalmol. .

Abstract

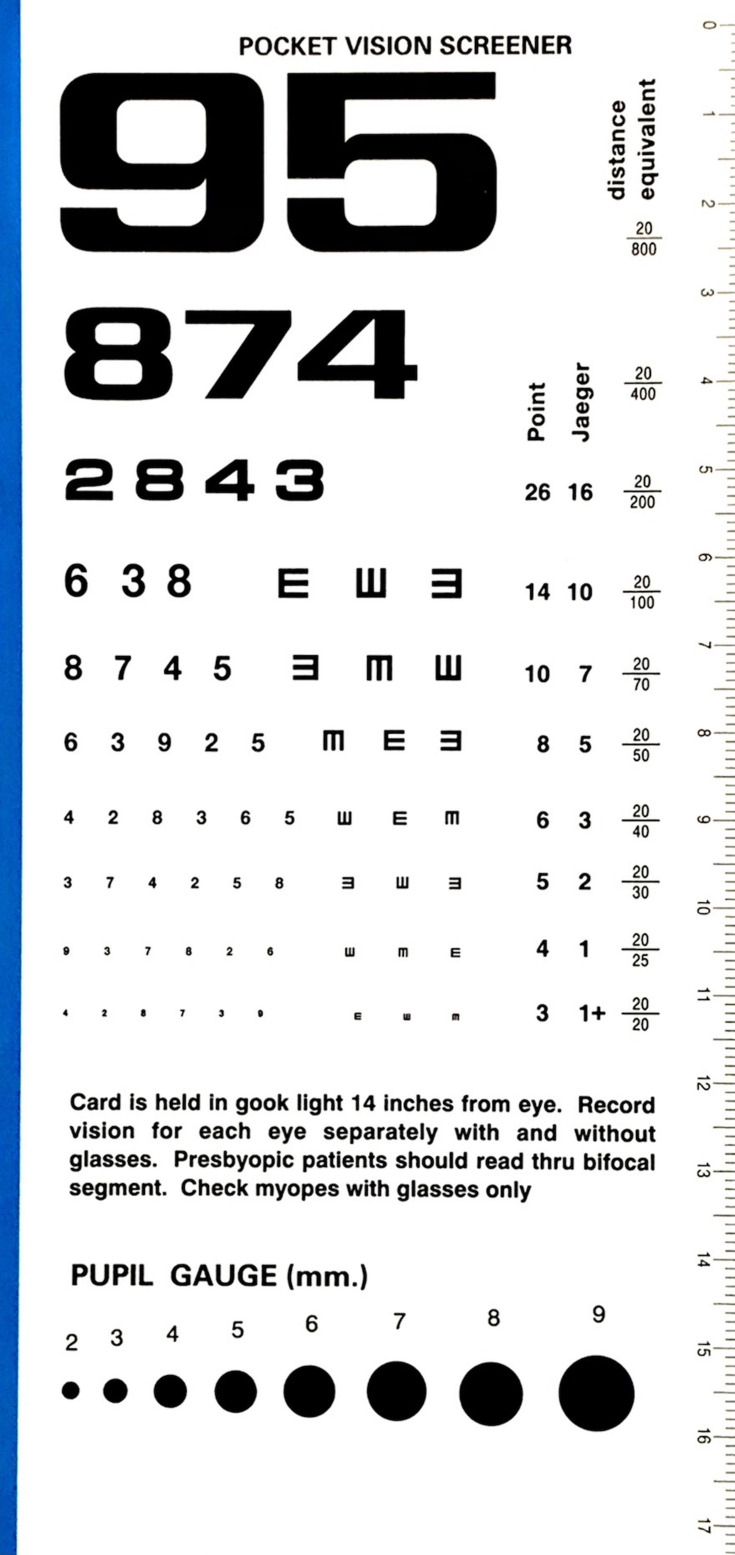
Purpose: To validate the Rosenbaum near vision card (Near Chart) and a smartphone-based visual acuity (VA) test (Eye Chart) against a standard retro-illuminated Early Treatment Diabetic Retinopathy Study (ETDRS) chart within participants.

Materials and methods: A cross-sectional study of participants aged ≥18 years was conducted. VA was measured in all participants using the ETDRS chart, Near Chart and smartphone-based Eye Chart application, respectively. VA was converted to logarithm of the minimum angle of resolution (logMAR) for statistical analysis. Eyes with ETDRS VA worse than 1.0 logMAR (20/200) were excluded. The main outcome measures were levels of agreement between VA measured using the Near Chart or Eye Chart application vs the ETDRS chart.

Results: A total of 295 eyes of 151 participants were included. One hundred participants (66.2%) were female and the mean age was 64.3 ± 12.5 years. Educational level was high school or below for 49% of participants and at Bachelor's degree or above for 51%. The median logMAR VAs of all eyes tested using the ETDRS chart, Near Chart and Eye Chart application were 0.1, 0.0 and 0.1, respectively. The median VA difference between the Near Chart vs ETDRS chart and Eye Chart application vs ETDRS chart was 0.0 logMAR in both cases for both the right eye (OD) and left eye (OS). Intraclass correlation coefficient (ICC) demonstrated a strong positive correlation between VA tested with the Near Chart vs ETDRS chart (OD: ICC=0.85; p<0.001, OS: ICC=0.77; p<0.001) and Eye Chart application vs ETDRS chart (OD: ICC=0.88; p<0.001, OS: ICC=0.74; p<0.001).

Conclusion: VA measurements with the Near Chart and smartphone-based Eye Chart application corresponded well to the standard ETDRS chart, suggesting potential utility of alternative portable VA tests for in-office or remote vision monitoring, particularly during periods of physical distancing such as the Coronavirus disease 2019 (COVID-19) era.

Keywords: COVID-19; ETDRS chart; Rosenbaum near vision card; smartphone-based Eye Chart application; visual acuity.


Conflict of interest statement

The authors declare that they have no conflicts of interest for this work.

Figures

Figure 1
Figure 1
Early Treatment Diabetic Retinopathy Study (ETDRS) chart.
Figure 2
Figure 2
Eye Chart application: (A) Snellen chart display; (B) tumbling E display.
Figure 3
Figure 3
Rosenbaum near vision card (Near Chart).
Figure 4
Figure 4
A flow diagram depicting the procedure followed in this study.
Figure 5
Figure 5
Comparison between logMAR visual acuity with Near Chart vs ETDRS chart. (A) Correlation between logMAR visual acuity in logMAR measured using the Near Chart and ETDRS chart for the right (OD) and left eye (OS). The black solid lines show linear regression. (B) A Bland–Altman plot demonstrating the differences in logMAR visual acuity scores between the Near Chart and ETDRS chart acuities for the right (OD) and left eye (OS). The x-axis displays the average logMAR acuity of the two methods being compared. The y-axis displays the difference in logMAR acuity between the two methods. Values above zero on the y-axis represent higher logMAR values (lower acuity) for the Near Chart than the ETDRS chart. The red solid line represents the mean visual acuity difference between the methods (−0.05 logMAR). The red dashed lines represent the limits of agreement (±2 SD of the mean visual acuity difference; SD=0.09 logMAR).
Figure 6
Figure 6
Comparison between logMAR visual acuity with Eye Chart application vs ETDRS chart. (A) Correlation between the visual acuity in logMAR measured using the Eye Chart application and ETDRS chart for the right (OD) and left eye (OS). The black solid lines show linear regression. (B) A Bland–Altman plot demonstrating the differences in logMAR visual acuity scores between the Eye Chart application and ETDRS chart for the right (OD) and left eye (OS). The x-axis displays the average logMAR acuity of the two methods being compared. The y-axis displays the difference in logMAR acuity between the two methods. Values above zero on the y-axis represent higher logMAR values (lower acuity) for the Eye Chart application than the ETDRS chart. The red solid line represents the mean of visual acuity difference between the methods (−0.01 logMAR). The red dashed lines represent the limits of agreement (±2 SD of the mean visual acuity difference; SD=0.10 logMAR).
Figure 7
Figure 7
Comparison between logMAR visual acuity with Eye Chart application vs Near Chart. (A) Correlation between visual acuity in logMAR measured with the Eye Chart application and Near Chart for the right (OD) and left eye (OS). The black solid lines show linear regression. (B) A Bland–Altman plot demonstrating the differences in logMAR visual acuity scores between the Eye Chart application and Near Chart for the right (OD) and left eye (OS). The x-axis displays the average logMAR acuity of the two methods being compared. The y-axis displays the difference in logMAR acuity between the two methods compared. Values above zero on the y-axis represent higher logMAR values (lower acuity) for the Eye Chart application than the Near Chart. The red solid line represents the mean visual acuity difference between the two methods (0.04 logMAR). The red dashed lines represent the limits of agreement (±2 SD of the mean visual acuity difference; SD=0.10 logMAR).

References

    1. World Health Organization (WHO). Visual impairment and blindness factsheet [Internet]; 2020. Available from: https://www.who.int/news-room/fact-sheets/detail/blindness-and-visual-im.... Accessed November11, 2020.
    1. Eckert KA, Carter MJ, Lansingh VC, et al. A simple method for estimating the economic cost of productivity loss due to blindness and moderate to severe visual impairment. Ophthalmic Epidemiol. 2015;22:349–355. doi: 10.3109/09286586.2015.1066394 - DOI - PubMed
    1. Evans BJ, Rowlands G. Correctable visual impairment in older people: a major unmet need. Ophthalmic Physiol Opt. 2004;24:161–180. doi: 10.1111/j.1475-1313.2004.00197.x - DOI - PubMed
    1. McCarty CA, Nanjan MB, Taylor HR. Vision impairment predicts 5 year mortality. Br J Ophthalmol. 2001;85:322–326. doi: 10.1136/bjo.85.3.322 - DOI - PMC - PubMed
    1. Taylor HR, Katala S, Muñoz B, Turner V. Increase in mortality associated with blindness in rural Africa. Bull World Health Organ. 1991;69(3):335–338. - PMC - PubMed

LinkOut - more resources