

Widespread Decoding of Tactile Input Patterns Among Thalamic Neurons
- PMID: 33664654
- PMCID: PMC7921320
- DOI: 10.3389/fnsys.2021.640085
Widespread Decoding of Tactile Input Patterns Among Thalamic Neurons
Abstract
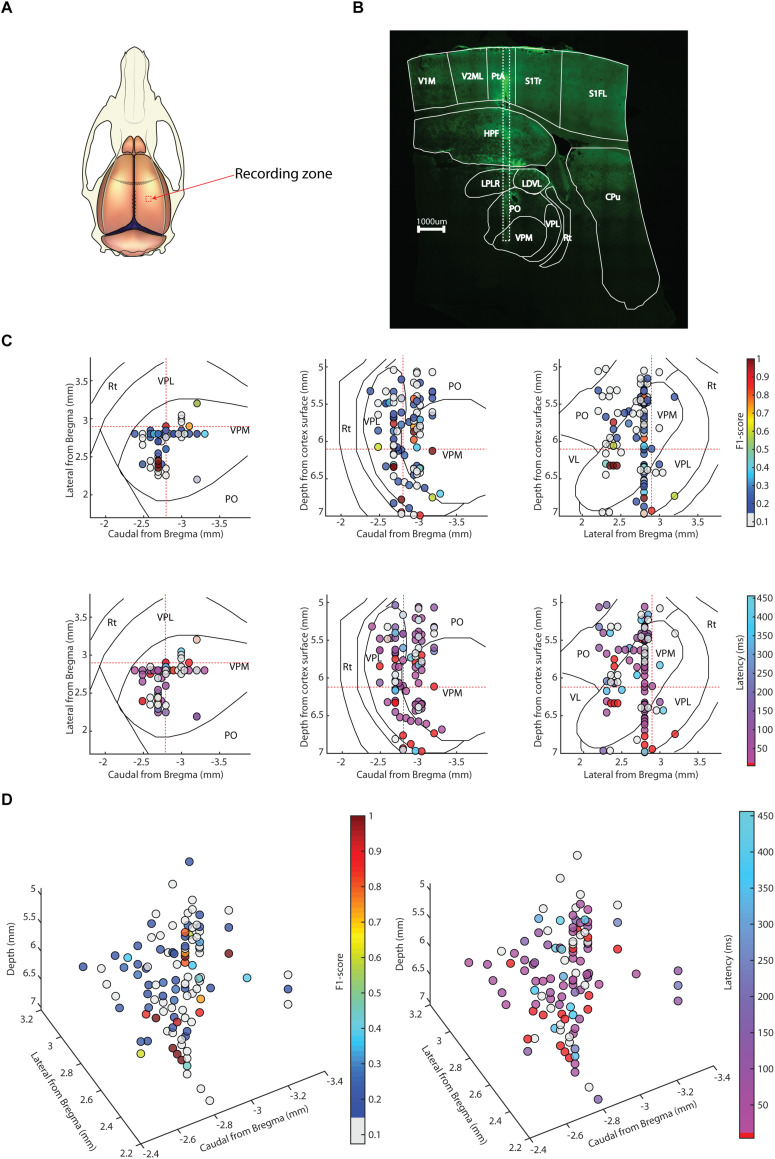
Whereas, there is data to support that cuneothalamic projections predominantly reach a topographically confined volume of the rat thalamus, the ventroposterior lateral (VPL) nucleus, recent findings show that cortical neurons that process tactile inputs are widely distributed across the neocortex. Since cortical neurons project back to the thalamus, the latter observation would suggest that thalamic neurons could contain information about tactile inputs, in principle regardless of where in the thalamus they are located. Here we use a previously introduced electrotactile interface for producing sets of highly reproducible tactile afferent spatiotemporal activation patterns from the tip of digit 2 and record neurons throughout widespread parts of the thalamus of the anesthetized rat. We find that a majority of thalamic neurons, regardless of location, respond to single pulse tactile inputs and generate spike responses to such tactile stimulation patterns that can be used to identify which of the inputs that was provided, at above-chance decoding performance levels. Thalamic neurons with short response latency times, compatible with a direct tactile afferent input via the cuneate nucleus, were typically among the best decoders. Thalamic neurons with longer response latency times as a rule were also found to be able to decode the digit 2 inputs, though typically at a lower decoding performance than the thalamic neurons with presumed direct cuneate inputs. These findings provide support for that tactile information arising from any specific skin area is widely available in the thalamocortical circuitry.
Keywords: information processing; integrative neurophysiology; neurophysiology; tactile; thalamus.
Copyright © 2021 Wahlbom, Enander and Jörntell.
Conflict of interest statement
The authors declare that the research was conducted in the absence of any commercial or financial relationships that could be construed as a potential conflict of interest.
Figures
Similar articles
-
Ubiquitous Neocortical Decoding of Tactile Input Patterns.Front Cell Neurosci. 2019 Apr 12;13:140. doi: 10.3389/fncel.2019.00140. eCollection 2019. Front Cell Neurosci. 2019. PMID: 31031596 Free PMC article.
-
Bilateral Tactile Input Patterns Decoded at Comparable Levels But Different Time Scales in Neocortical Neurons.J Neurosci. 2018 Apr 11;38(15):3669-3679. doi: 10.1523/JNEUROSCI.2891-17.2018. Epub 2018 Mar 14. J Neurosci. 2018. PMID: 29540549 Free PMC article.
-
Effect of tactile inputs on thalamic responses to noxious colorectal distension in rat.J Neurophysiol. 2002 Sep;88(3):1185-96. doi: 10.1152/jn.2002.88.3.1185. J Neurophysiol. 2002. PMID: 12205140
-
Functional anatomy of thalamus and basal ganglia.Childs Nerv Syst. 2002 Aug;18(8):386-404. doi: 10.1007/s00381-002-0604-1. Epub 2002 Jul 26. Childs Nerv Syst. 2002. PMID: 12192499 Review.
-
Parallel organization of somatosensory cortical areas I and II for tactile processing.Clin Exp Pharmacol Physiol. 1996 Oct-Nov;23(10-11):931-8. doi: 10.1111/j.1440-1681.1996.tb01145.x. Clin Exp Pharmacol Physiol. 1996. PMID: 8911737 Review.
Cited by
-
Remote cortical perturbation dynamically changes the network solutions to given tactile inputs in neocortical neurons.iScience. 2021 Dec 2;25(1):103557. doi: 10.1016/j.isci.2021.103557. eCollection 2022 Jan 21. iScience. 2021. PMID: 34977509 Free PMC article.
-
Widely Different Correlation Patterns Between Pairs of Adjacent Thalamic Neurons In vivo.Front Neural Circuits. 2021 Jun 30;15:692923. doi: 10.3389/fncir.2021.692923. eCollection 2021. Front Neural Circuits. 2021. PMID: 34276316 Free PMC article.
-
Functional connectivity of thalamic nuclei during sensorimotor task-based fMRI at 9.4 Tesla.Front Neurosci. 2025 May 13;19:1568222. doi: 10.3389/fnins.2025.1568222. eCollection 2025. Front Neurosci. 2025. PMID: 40433501 Free PMC article.
-
Hippocampal output profoundly impacts the interpretation of tactile input patterns in SI cortical neurons.iScience. 2023 May 13;26(6):106885. doi: 10.1016/j.isci.2023.106885. eCollection 2023 Jun 16. iScience. 2023. PMID: 37260754 Free PMC article.
-
High-dimensional cortical signals reveal rich bimodal and working memory-like representations among S1 neuron populations.Commun Biol. 2024 Aug 23;7(1):1043. doi: 10.1038/s42003-024-06743-z. Commun Biol. 2024. PMID: 39179675 Free PMC article.
References
-
- Alloway K. D., Wallace M. B., Johnson M. J. (1994). Cross-correlation analysis of cuneothalamic interactions in the rat somatosensory system: influence of receptive field topography and comparisons with thalamocortical interactions. J. Neurophysiol. 72 1949–1972. 10.1152/jn.1994.72.4.1949 - DOI - PubMed
LinkOut - more resources
Full Text Sources
Other Literature Sources