. 2021 Feb 16:11:613882.
doi: 10.3389/fimmu.2020.613882. eCollection 2020.

Surface NKG2C Identifies Differentiated αβT-Cell Clones Expanded in Peripheral Blood

Affiliations

Surface NKG2C Identifies Differentiated αβT-Cell Clones Expanded in Peripheral Blood

Elena I Kovalenko et al. Front Immunol. .

Abstract

T cells that express CD56 in peripheral blood of healthy humans represent a heterogeneous and poorly studied subset. In this work, we analyzed this subset for NKG2C expression. In both CD56+ and CD56- subsets most of the NKG2C+ T cells had a phenotype of highly differentiated CD8+ TEMRA cells. The CD56+NKG2C+ T cells also expressed a number of NK cell receptors, such as NKG2D, CD16, KIR2DL2/DL3, and maturation marker CD57 more often than the CD56-NKG2C+CD3+ cells. TCR β-chain repertoire of the CD3+CD56+NKG2C+ cell fraction was limited by the prevalence of one or several clonotypes which can be found within the most abundant clonotypes in total or CD8+ T cell fraction TCRβ repertoire. Thus, NKG2C expression in highly differentiated CD56+ T cells was associated with the most expanded αβ T cell clones. NKG2C+ T cells produced almost no IFN-γ in response to stimulation with HCMV pp65-derived peptides. This may be partially due to the high content of CD45RA+CD57+ cells in the fraction. CD3+NKG2C+ cells showed signs of activation, and the frequency of this T-cell subset in HCMV-positive individuals was positively correlated with the frequency of NKG2C+ NK cells that may imply a coordinated in a certain extent development of the NKG2C+ T and NK cell subsets under HCMV infection.

Keywords: NKG2C; NKT-like cells; T cell differentiation; TCR repertoire; cytomegalovirus infection.


Conflict of interest statement

The authors declare that the research was conducted in the absence of any commercial or financial relationships that could be construed as a potential conflict of interest.

Figures
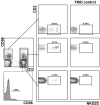
Figure 1
Figure 1
Gating strategy for the assessment of the distribution of NKG2C+ cells in CD56 and CD56+ (NKT-like) T cell subsets and in NK cells. Experimental sample and fluorescence minus one (FMO) control lacking NKG2C-antibody are presented.
Figure 2
Figure 2
TCR-beta repertoire structure. (A) Repertoire structure of the CD3+CD56+NKG2C+ fraction. Ranking of clonotypes was performed in the cell fraction isolated by fluorescence-activated cell sorting. Top 10 clonotypes identified in samples for donors are shown proportionally of their percentage in the fraction. (B) The top clonotypes of the CD3+CD56+NKG2C+ fraction matched in total TCR-beta repertoire sequenced from PBMC sample.
Figure 3
Figure 3
Phenotypic analysis of NKG2C+ cells. (A) Gating strategy for the assessment of the distribution of various surface markers in NKG2C+ cells in CD56 and CD56+ αβ T cell subsets. As an example, NKG2D expression level in the T cell fractions is presented; antibody panel: CD3-PE-Cy7, CD56-APC, γδTCR-Brilliant Violet 421, NKG2C-AF488, NKG2D-PE. (B) Analysis of CD8 expression in CD56+NKG2C+ αβ T cells. Representative staining is presented. (C) Analysis of CD8 expression in CD56+NKG2C+ T cells of the donor 2.
Figure 4
Figure 4
Phenotypic analysis of T cell subsets. (A) NKG2C+ cell frequencies analyzed in CD3+CD56+/−CD8+/− cell subsets (n = 7). (B) Expression of CD45-RA, CD45-RO, CCR7 (CD197), CD27, CD28, CD57, CD16, NKG2D, KIR2DL2/DL3, NKG2A, CD161, CD69, HLA-DR and γδTCR on NKG2C and NKG2C+ CD56/+ T cells (n = 8, 9, 9, 9, 5, 7, 8, 7, 8, 7, 5, 8, 8 and 8, respectively. (B) NKG2C+ in CD8+/−CD56+/− T cell subsets (n = 7). Means ± SEM are presented (*p < 0.05; **p < 0.01; ***p < 0.001; ****p < 0.0001, Mann-Whitney U test).
Figure 5
Figure 5
Production of IFN-γ in NKG2C and NKG2C+CD8+ T cells. (A) Representative staining of cells from one of the donors is presented. CMV-specific IFN-γ response was induced using pp65 peptide set (PepTivator, Miltenyi Biotec). Staphylococcal enterotoxin B was used as a positive control. (B) Summary of data on IFN-γ production accessed in CD56NKG2C, CD56NKG2C+, CD56+NKG2C, CD56+NKG2C+ cells from the CD3+CD8+ T cell subset. Means ± SEM of three independent experiments are presented. *p < 0.05.
Figure 6
Figure 6
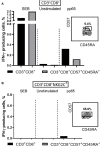
IFN-γ production induced by SEB (positive control) or pp65 peptide set in CD8+ T cells. (A) IFN-γ production levels in CD8+ and more differentiated CD8+CD57+CD45RA+ T cell subsets. (B) IFN-γ production levels in CD8+NKG2C+ T cell subsets and in more differentiated CD8+CD57+CD45RA+NKG2C+ T cells. Percentages of CD57+CD45RA+ cells in CD8+ and CD8+NKG2C+ cell fractions are indicated. Representative staining is presented.
Figure 7
Figure 7
Cytotoxic activity of NKG2C/+ CD56/+ T cells estimated by surface expression of LAMP-1 in degranulation assay. (A) Natural cytotoxicity of T cells measured against K562 target cells. T cell subsets isolated from PBMC by cell sorting were stimulated overnight with IL-2 (500 U/ml). Percentage of LAMP-1–positive T cells after incubation with target cells was measured. Means ± SEM of 6 independent experiments and histograms of one of the experiments are presented. (B) Antibody-dependent cell-mediated cytotoxicity of T cells measured against Rituximab-coated C1R target cells. Means ± SEM for 5 independent experiments and histograms of one of the experiments are presented. *p < 0.05.

References

    1. Sallusto F, Lenig D, Förster R, Lipp M, Lanzavecchia A. Two subsets of memory T lymphocytes with distinct homing potentials and effector functions. Nature (1999) 401:708–12. 10.1038/44385 - DOI - PubMed
    1. Omilusik KD, Goldrath AW. Remembering to remember: T cell memory maintenance and plasticity. Curr Opin Immunol (2019) 58:89–97. 10.1016/j.coi.2019.04.009 - DOI - PMC - PubMed
    1. Welten SPM, Sandu I, Baumann NS, Oxenius A. Memory CD8 T cell inflation vs tissue-resident memory T cells: Same patrollers, same controllers? Immunol Rev (2018) 283:161–75. 10.1111/imr.12649 - DOI - PubMed
    1. Huard B, Karlsson L. A subpopulation of CD8+ T cells specific for melanocyte differentiation antigens expresses killer inhibitory receptors (KIR) in healthy donors: Evidence for a role of KIR in the control of peripheral tolerance. Eur J Immunol (2000) 30:1665–75. 10.1002/1521-4141(200006)30:6<1665::AID-IMMU1665>3.0.CO;2-2 - DOI - PubMed
    1. Speiser DE, Valmori D, Rimoldi D, Pittet MJ, Liénard D, Cerundolo V, et al. . CD28-negative cytolytic effector T cells frequently express NK receptors and are present at variable proportions in circulating lymphocytes from healthy donors and melanoma patients. Eur J Immunol (1999) 29:1990–9. 10.1002/(SICI)1521-4141(199906)29:06<1990::AID-IMMU1990>3.0.CO;2-9 - DOI - PubMed

Publication types

MeSH terms

Substances