. 2021 Feb 16:12:605616.
doi: 10.3389/fimmu.2021.605616. eCollection 2021.

Therapeutic Effects of (5R)-5-Hydroxytriptolide on Fibroblast-Like Synoviocytes in Rheumatoid Arthritis via lncRNA WAKMAR2/miR-4478/E2F1/p53 Axis

Affiliations

Therapeutic Effects of (5R)-5-Hydroxytriptolide on Fibroblast-Like Synoviocytes in Rheumatoid Arthritis via lncRNA WAKMAR2/miR-4478/E2F1/p53 Axis

Xinpeng Zhou et al. Front Immunol. .

Abstract

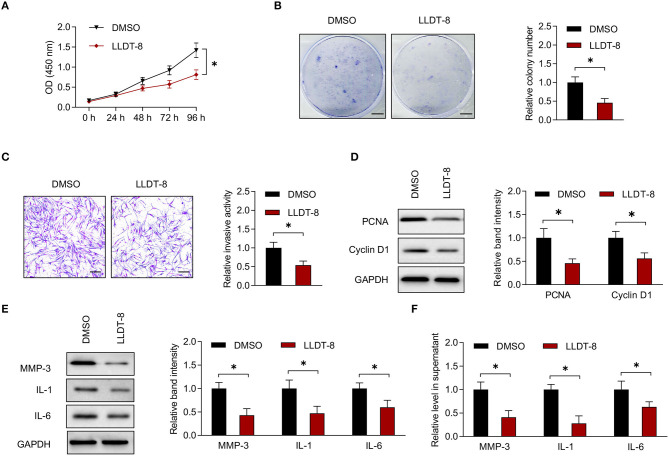
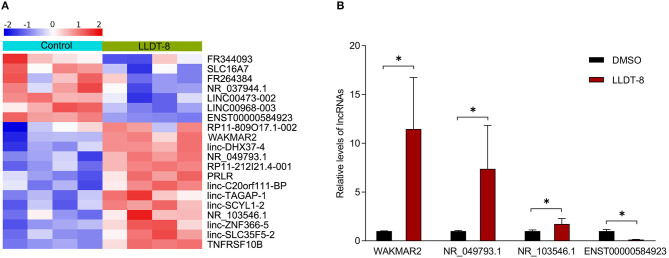
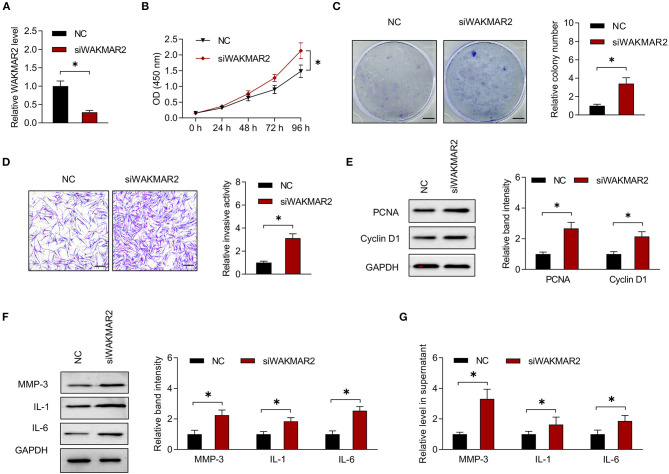
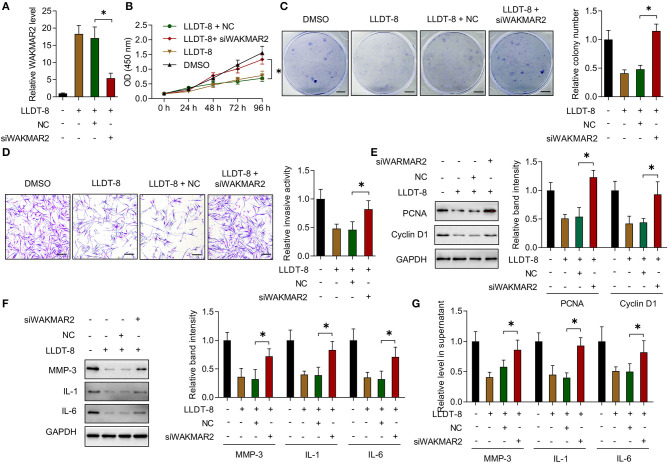
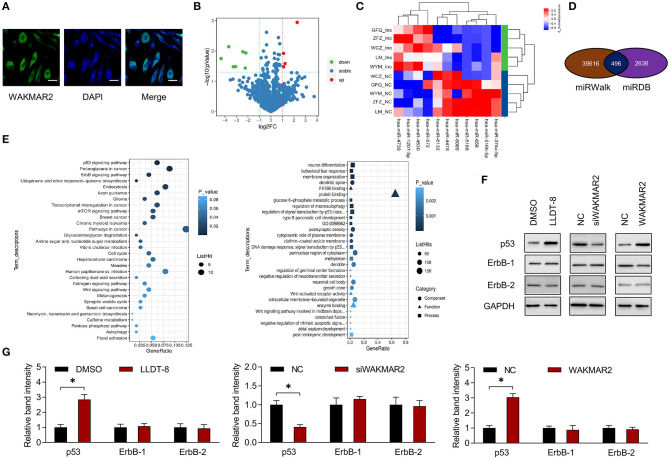
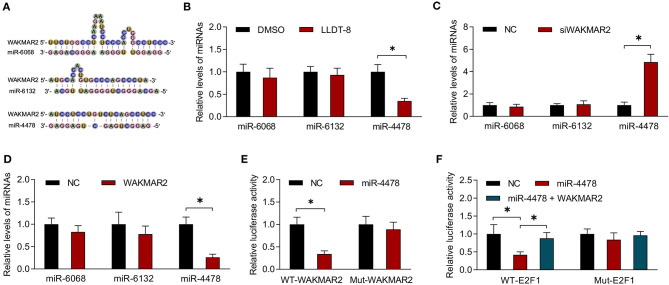
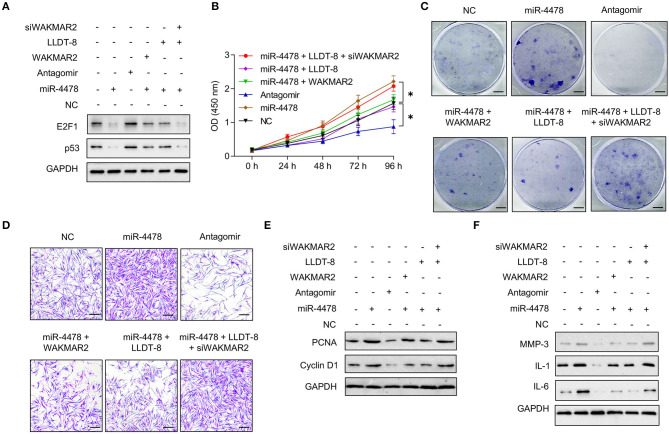
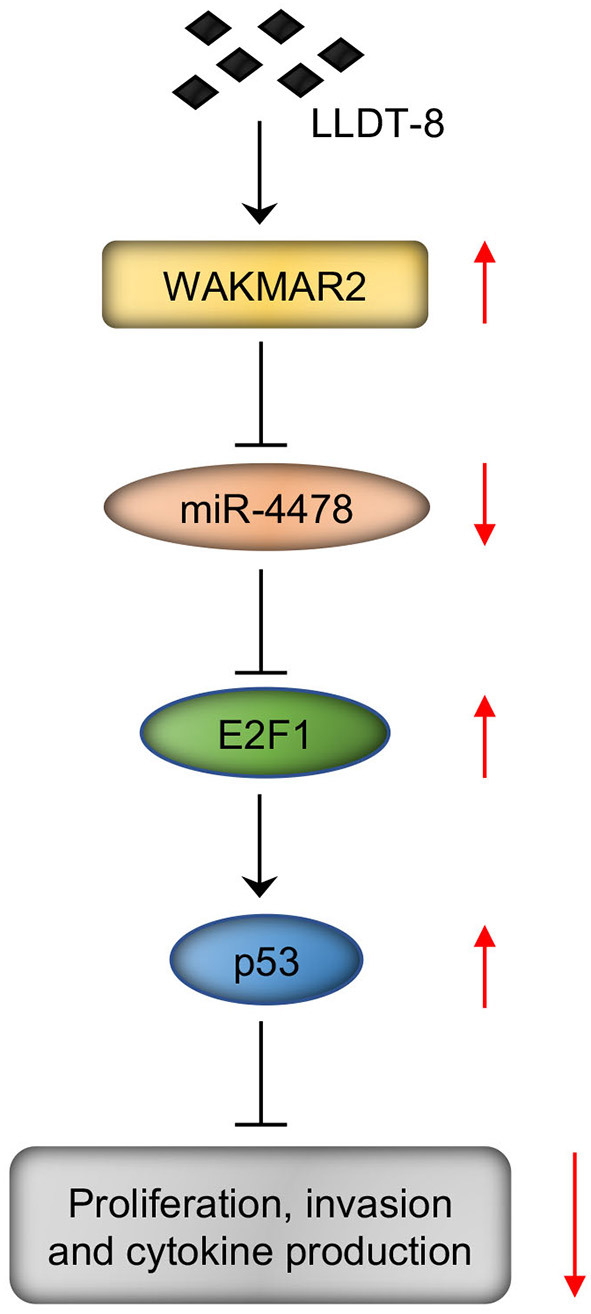
Rheumatoid arthritis (RA) is an autoimmune disease. Fibroblast-like synoviocytes (FLS) serve a major role in synovial hyperplasia and inflammation in RA. (5R)-5-hydroxytriptolide (LLDT-8), a novel triptolide derivative, shows promising therapeutic effects for RA and is now in phase II clinical trials in China. However, the underlying mechanism of LLDT-8 is still not fully understood. Here, we found that LLDT-8 inhibited proliferation and invasion of RA FLS, as well as the production of cytokines. Microarray data demonstrated that LLDT-8 upregulated the expression of long non-coding RNA (lncRNA) WAKMAR2, which was negatively associated with proliferation and invasion of RA FLS, as well as the production of pro-inflammatory cytokines. Knockdown of WAKMAR2 abolished the inhibitory effects of LLDT-8 on RA FLS. Mechanistically, WAKMAR2 sponged miR-4478, which targeted E2F1 and downstreamed p53 signaling. Rescue experiments indicated that the inhibitory effects of LLDT-8 on RA FLS were dependent on WAKMAR2/miR-4478/E2F1/p53 axis.

Keywords: (5R)-5-hydroxytriptolide; WAKMAR2; fibroblast-like synoviocytes; inflammation; miR-4478/E2F1/p53 axis; rheumatoid arthritis.


Conflict of interest statement

The authors declare that the research was conducted in the absence of any commercial or financial relationships that could be construed as a potential conflict of interest.

Figures

Figure 1
Figure 1
Effects of LLDT-8 on RA FLS. (A) Proliferative ability of RA FLS treated with 50 nm LLDT-8 or vehicle (DMSO), as determined by CCK-8 assay. (B) Colony formation of RA FLS with the above treatment. Scale bars = 5 mm. (C) Invasion of RA FLS with the above treatment, as determined by transwell assay. Scale bars = 200 μm. (D) The levels of PCNA and Cyclin D1 in RA FLS with the above treatment, as determined by western blotting. (E) The levels of MMP-3, IL-1, and IL-6 in RA FLS with the above treatment, as determined by western blotting. (F) The levels of MMP-3, IL-1, and IL-6 in supernatant of RA FLS with the above treatment, as determined by ELISA. The data are presented as mean ± SD. *P < 0.05. Both, representative images and quantitative measurement of colony formation, invasion, and western blotting were shown. All experiments were repeated 3 times. LLDT-8, (5R)-5-hydroxytriptolide; RA, rheumatoid arthritis; FLS, fibroblast-like synoviocytes; DMSO, dimethyl sulfoxide; PCNA, proliferating cell nuclear antigen; ELISA, enzyme-linked immunosorbent assay; IL, interleukin; MMP, matrix metalloproteinase.
Figure 2
Figure 2
Effects of LLDT-8 on expression of lncRNAs in RA FLS. (A) Heatmap showing differentially expressed lncRNAs in RA FLS treated with LLDT-8 or DMSO. (B) Relative levels of WAKMAR2, NR_049793.1, NR_103546.1, and ENST00000584923 in RA FLS treated with LLDT-8 or DMSO, as determined by real-time PCR. The data are presented as mean ± SD. *P < 0.05. All experiments were repeated 8 times. LLDT-8, (5R)-5-hydroxytriptolide; RA, rheumatoid arthritis; FLS, fibroblast-like synoviocytes; lncRNAs, long non-coding ribonucleic acids; DMSO, dimethyl sulfoxide; PCR, polymerase chain reaction.
Figure 3
Figure 3
Effects of WAKMAR2 silencing on RA FLS. (A) Levels of WAKMAR2 in RA FLS transfected with WAKMAR2 silencing vector (siWAKMAR2) or negative control vector (NC), as determined by real-time PCR. (B) Proliferative ability of RA FLS with the above transfection, as determined by CCK-8 assay. (C) Colony formation of RA FLS with the above transfection. Scale bars = 5 mm. (D) Invasion of RA FLS with the above transfection, as determined by transwell assay. Scale bars = 200 μm. (E) The levels of PCNA and Cyclin D1 in RA FLS with the above transfection, as determined by western blotting. (F) The levels of MMP-3, IL-1, and IL-6 in RA FLS with the above transfection, as determined by western blotting. (G) The levels of MMP-3, IL-1, and IL-6 in supernatant of RA FLS with the above transfection, as determined by ELISA. The data are presented as mean ± SD. *P < 0.05. Both, representative images and quantitative measurement of colony formation, invasion and western blotting were shown. All experiments were repeated 3 times. RA, rheumatoid arthritis; FLS, fibroblast-like synoviocytes; NC, negative control vector; PCR, polymerase chain reaction; PCNA, proliferating cell nuclear antigen; IL, interleukin; MMP, matrix metalloproteinase; ELISA, enzyme-linked immunosorbent assay.
Figure 4
Figure 4
Effects of LLDT-8 on RA FLS with WAKMAR2 silencing. (A) Level of WAKMAR2 in LLDT-8-treated FLS with or without transfection of WAKMAR2 silencing vector (siWAKMAR2) or negative control vector (NC), as determined by real-time PCR. (B) Proliferative ability of RA FLS with the above treatment, as determined by CCK-8 assay. (C) Colony formation of RA FLS with the above treatment. Scale bars = 5 mm. (D) Invasion of RA FLS with the above treatment, as determined by transwell assay. Scale bars = 200 μm. (E) The levels of PCNA and Cyclin D1 in RA FLS with the above treatment, as determined by western blotting. (F) The levels of MMP-3, IL-1, and IL-6 in RA FLS with the above treatment, as determined by western blotting. (G) The levels of MMP-3, IL-1, and IL-6 in supernatant of RA FLS with the above treatment, as determined by ELISA. The data are presented as mean ± SD. *P < 0.05.Both, representative images and quantitative measurement of colony formation, invasion, and western blotting were shown. All experiments were repeated 3 times. RA, Rheumatoid arthritis; FLS, Fibroblast-like synoviocytes; PCNA, proliferating cell nuclear antigen; IL, interleukin; MMP, matrix metalloproteinase; ELISA, enzyme-linked immunosorbent assay.
Figure 5
Figure 5
Expression profiling of miRNAs and bioinformatic analysis. (A) Subcellular localization of WAKMAR2 in RA FLS treated with 100 nM LLDT-8, as determined by FISH assay. Green color showed localization of WAKMAR2. Blue color showed nuclear staining by DAPI. Scale bars= 50 μm. (B) Volcano plot showing differentially expressed miRNAs in RA FLS with overexpression of WAKMAR2. Red color indicated upregulated miRNAs and green color indicated downregulated miRNAs after defining the threshold of fold change ≥2 and P < 0.05. (C) Heatmap illustrating expression patterns of the significantly upregulated and downregulated miRNAs. (D) Overlapping miRNA-mRNA pairs between miRWalk and miRDB databases. (E) GO and KEGG pathway enrichment analysis. The top 30 items with the smallest P-value in the enrichment analysis were shown in KEGG (left) and GO (right) bubble diagrams. (F) The levels of p53 and ErbB-1/2 in RA FLS treated with LLDT-8 or DMSO, or transfected with WAKMAR2 silencing vector (siWAKMAR2), WAKMAR2 overexpressing vector or their corresponding negative control vectors (NC). (G) Quantitative measurement of western blotting. The data are presented as mean ± SD. *P < 0.05. All experiments were repeated 3 times. FISH, fluorescence in situ hybridization; miRNA, microRNA; RA, rheumatoid arthritis; FLS, fibroblast-like synoviocytes; GO, gene ontology; KEGG, kyoto encyclopedia of genes and genomes.
Figure 6
Figure 6
Interaction between miR-4478 and WAKMAR2. (A) Prediction of binding sites between WAKMAR2 and miRNA candidates (miR-6068, miR-6132, and miR-4478) using RNAHybrid. (B) Relative levels of miR-6068, miR-6132, and miR-4478 in RA FLS treated with LLDT-8 or DMSO. (C) Relative levels of miR-6068, miR-6132, and miR-4478 in RA FLS transfected with WAKMAR2 silencing vector (siWAKMAR2) or negative control vectors (NC). (D) Relative levels of miR-6068, miR-6132, and miR-4478 in RA FLS transfected with WAKMAR2 overexpressing vector or negative control vectors (NC). (E) Luciferase activity in RA FLS transfected with miR-4478 mimic or negative control mimic (NC) and WT-WAKMAR2 or Mut-WAKMAR2, as determined by luciferase reporter assay. (F) The luciferase activity in RA FLS transfected with miR-4478 mimic, negative control mimic (NC), or miR-4478 mimic + WAKMAR2 overexpression vector and WT-E2F1 or Mut-E2F1. Data are presented as mean ± SD. *P < 0.05. All experiments were repeated 3 times. RNA, ribonucleic acid; RA, rheumatoid arthritis; FLS, fibroblast-like synoviocytes; NC, negative control vector.
Figure 7
Figure 7
Effects of miR-4478 on RA FLS. (A) The levels of p53 and E2F1 in RA FLS transfected with miR-4478 mimic, antagomir, miR-4478 mimic + WAKMAR2 overexpression vector, miR-4478 mimic + LLDT-8 treatment, or miR-4478 mimic +WAKMAR2 silencing vector (siWAKMAR2) + LLDT-8 treatment. (B) Proliferative ability of RA FLS with the above treatment, as determined by CCK-8 assay. (C) Colony formationof RA FLS with the above treatment. Scale bars = 5 mm. (D) Invasion of RA FLS with the above treatment, as determined by transwell assay. Scale bars = 200 μm. (E) The levels of PCNA and Cyclin D1 in RA FLS with the above treatment, as determined by western blotting. (F) The levels of MMP-3, IL-1, and IL-6 in RA FLS with the above treatment, as determined by western blotting. The data are presented as mean ± SD. *P < 0.05. All experiments were repeated 3 times. RA, rheumatoid arthritis; FLS, fibroblast-like synoviocytes; LLDT-8, (5R)-5-hydroxytriptolide; IL, interleukin; MMP, matrix metalloproteinase; PCNA, proliferating cell nuclear antigen.
Figure 8
Figure 8
LLDT-8/WAKMAR2/miR-4478/E2F1/p53 axis in RA FLS. Briefly, LLDT-8 induced upregulation of WAKMAR2, which sponged miR-4478, leading to increased expression of E2F1 and p53 and inhibited proliferation and invasion of RA FLS as well as production of cytokines. LLDT-8, (5R)-5-hydroxytriptolide; RA, rheumatoid arthritis; FLS, fibroblast-like synoviocytes.

Similar articles

Cited by

References

    1. Scott DL, Wolfe F, Huizinga TW. Rheumatoid arthritis. Lancet. (2010) 376:1094–108. 10.1016/S0140-6736(10)60826-4 - DOI - PubMed
    1. Guo Q, Wang Y, Xu D, Nossent J, Pavlos NJ, Xu J. Rheumatoid arthritis: pathological mechanisms and modern pharmacologic therapies. Bone Res. (2018) 6:15. 10.1038/s41413-018-0016-9 - DOI - PMC - PubMed
    1. Nygaard G, Firestein GS. Restoring synovial homeostasis in rheumatoid arthritis by targeting fibroblast-like synoviocytes. Nat Rev Rheumatol. (2020) 16:316–33. 10.1038/s41584-020-0413-5 - DOI - PMC - PubMed
    1. Zhang X, Feng H, Du J, Sun J, Li D, Hasegawa T, et al. . Aspirin promotes apoptosis and inhibits proliferation by blocking G0/G1 into S phase in rheumatoid arthritis fibroblast-like synoviocytes via downregulation of JAK/STAT3 and NF-kappaB signaling pathway. Int J Mol Med. (2018) 42:3135–48. 10.3892/ijmm.2018.3883 - DOI - PMC - PubMed
    1. Bartok B, Firestein GS. Fibroblast-like synoviocytes: key effector cells in rheumatoid arthritis. Immunol Rev. (2010) 233:233–55. 10.1111/j.0105-2896.2009.00859.x - DOI - PMC - PubMed

Publication types

MeSH terms