. 2021 Feb 16:12:628966.
doi: 10.3389/fimmu.2021.628966. eCollection 2021.

PDIA5 is Correlated With Immune Infiltration and Predicts Poor Prognosis in Gliomas

Affiliations

PDIA5 is Correlated With Immune Infiltration and Predicts Poor Prognosis in Gliomas

Hao Zhang et al. Front Immunol. .

Abstract

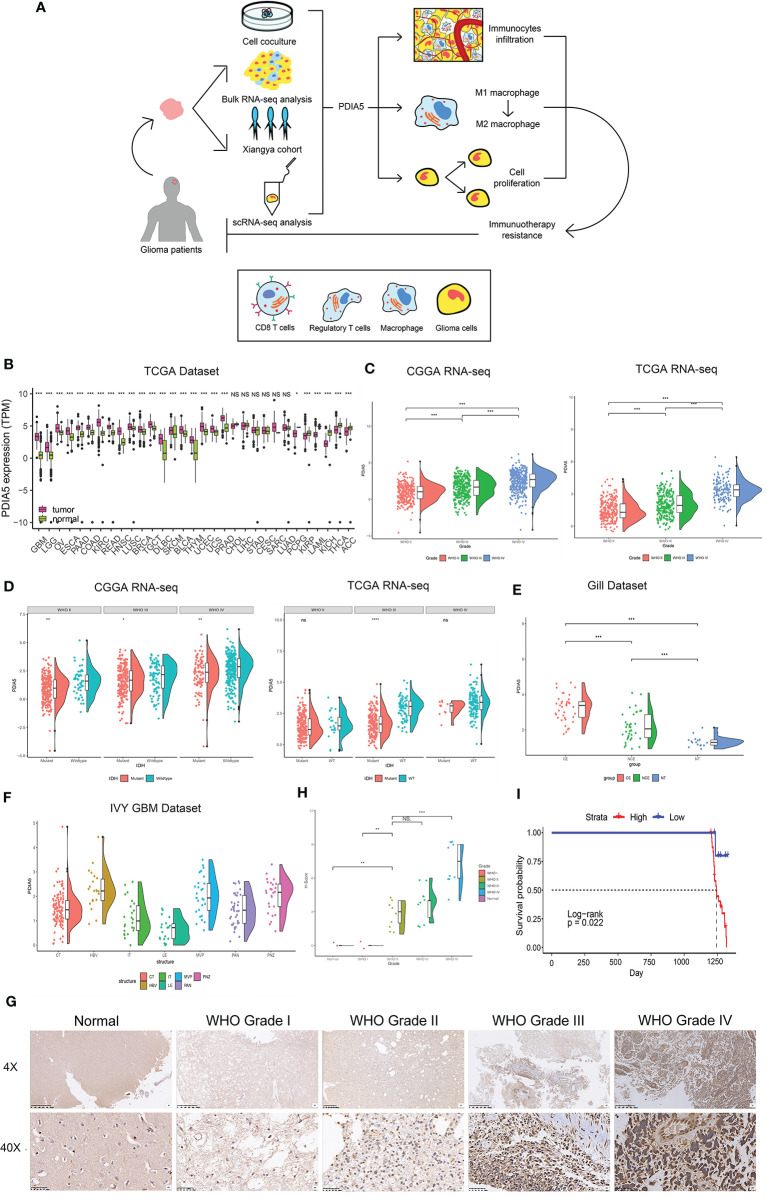
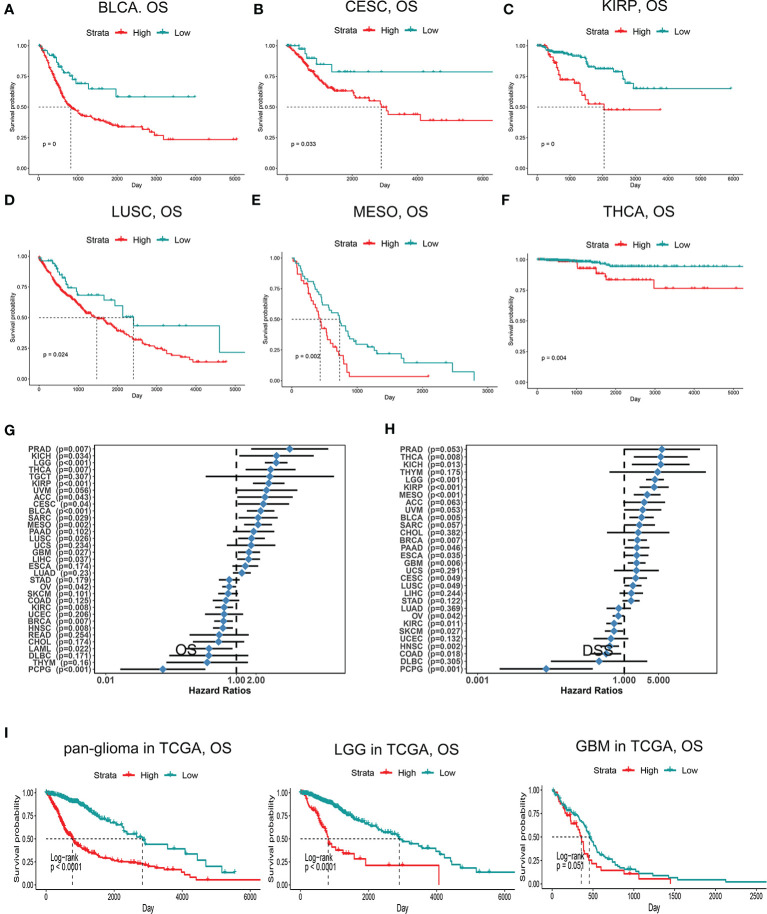
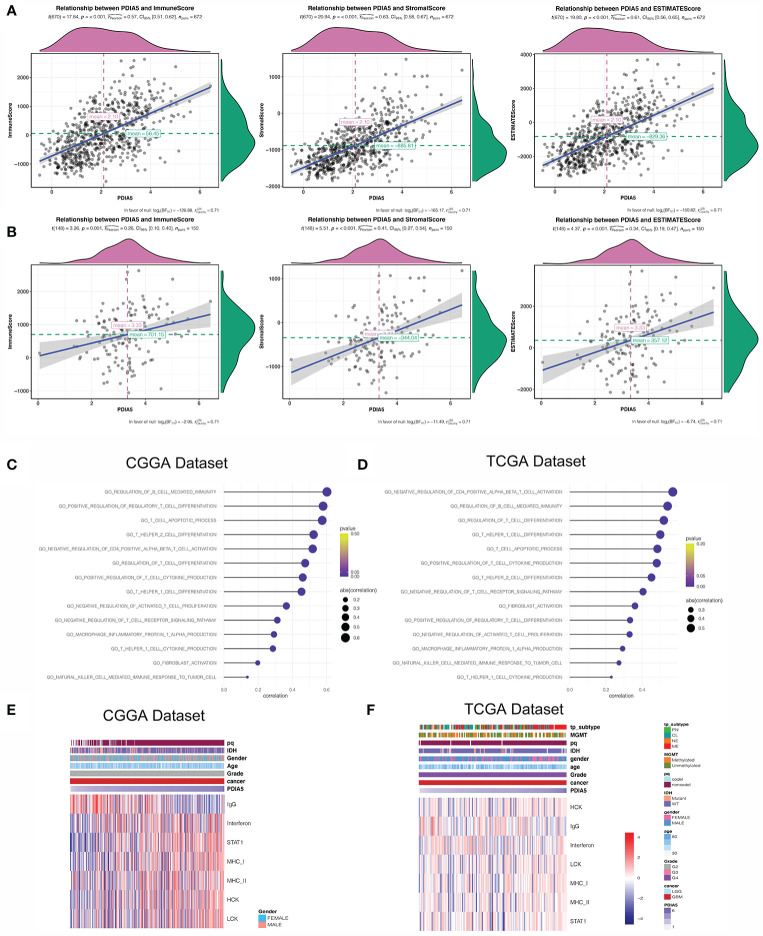
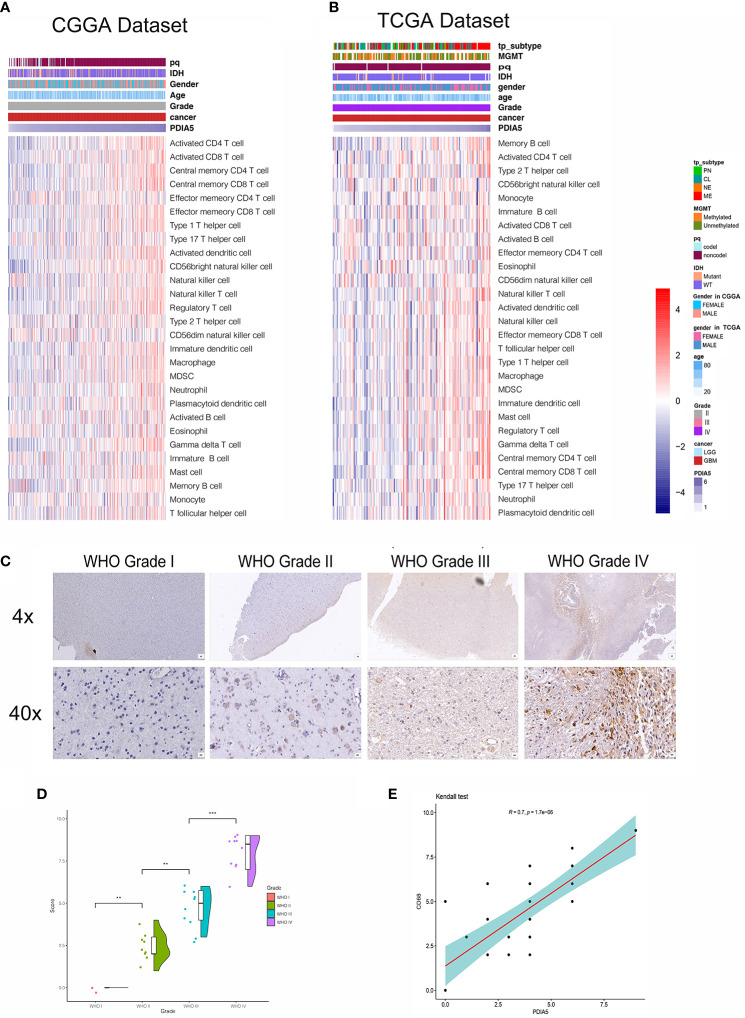
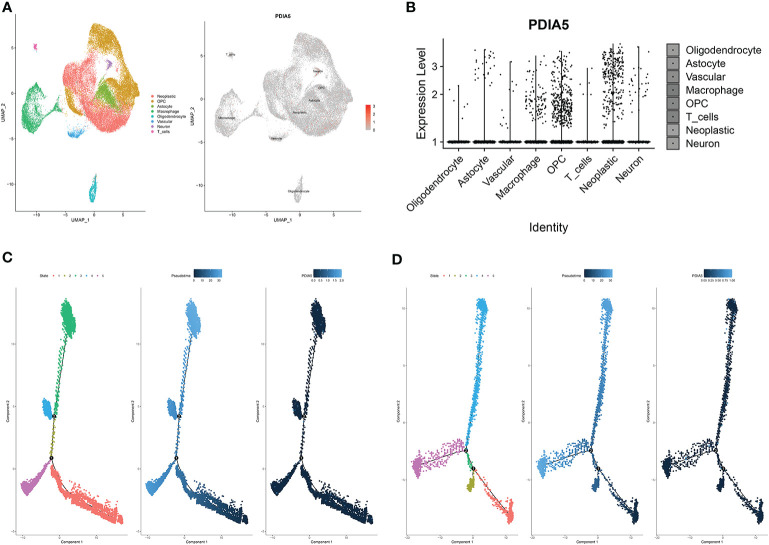
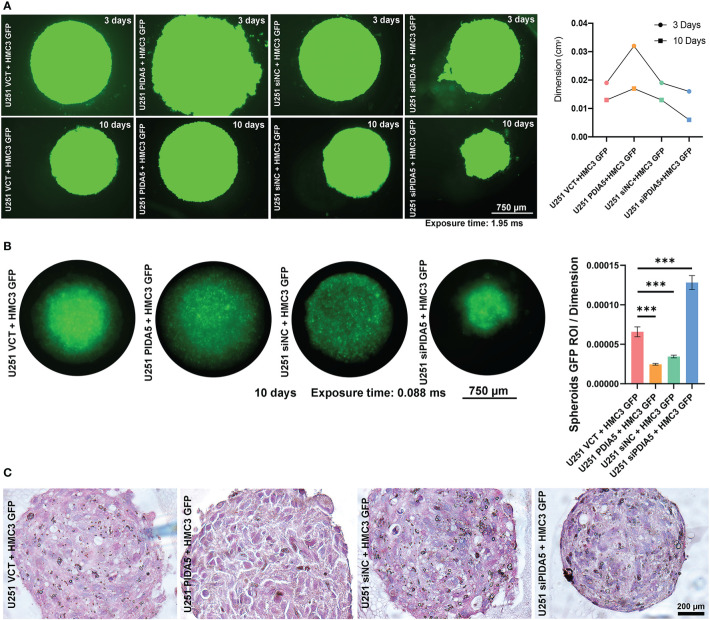
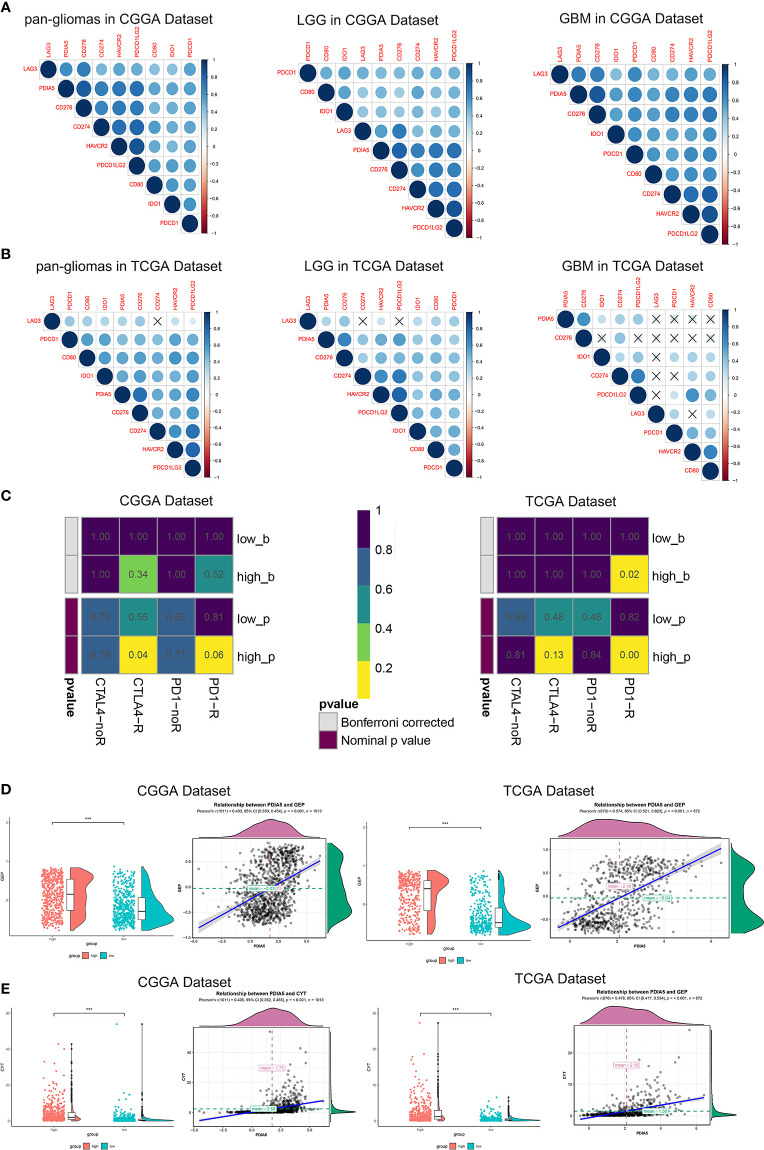
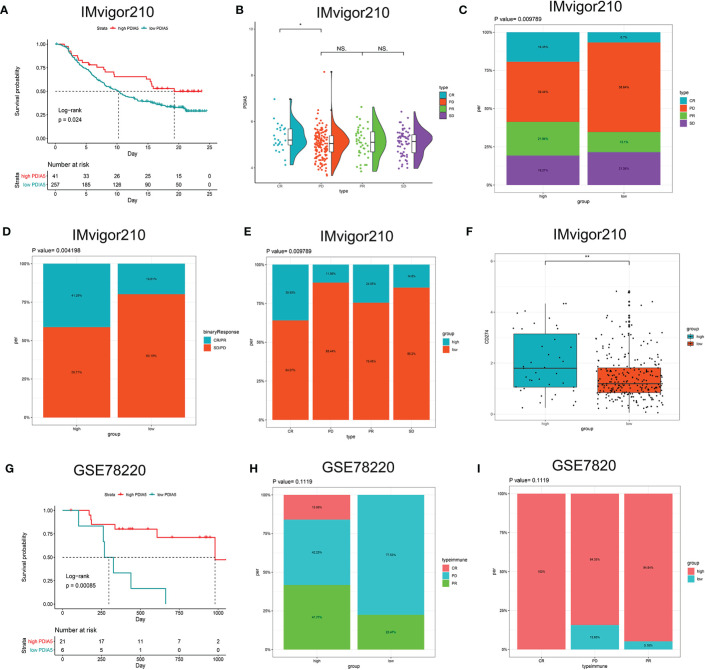
Gliomas are the most common and lethal primary malignant tumor of the brain. Routine treatment including surgical resection, chemotherapy, and radiotherapy produced limited therapeutic effect, while immunotherapy targeting the glioma microenvironment has offered a novel therapeutic option. PDIA5 protein is the member of PDI family, which is highly expressed in glioma and participates in glioma progression. Based on large-scale bioinformatics analysis, we discovered that PDIA5 expression level is upregulated in aggressive gliomas, with high PDIA5 expression predicting poor clinical outcomes. We also observed positive correlation between PDIA5 and immune infiltrating cells, immune related pathways, inflammatory activities, and other immune checkpoint members. Patients with high PDIA5 high-expression benefited from immunotherapies. Additionally, immunohistochemistry revealed that PDIA5 and macrophage biomarker CD68 were upregulated in high-grade gliomas, and patients with low PDIA5 level experienced favorable outcomes among 33 glioma patients. Single cell RNA sequencing exhibited that PDIA5 was in high level presenting in neoplastic cells and macrophages. Cell transfection and co-culture of glioma cells and macrophages revealed that PDIA5 in tumor cells mediated macrophages exhausting. Altogether, our findings indicate that PDIA5 overexpression is associated with immune infiltration in gliomas, and may be a promising therapeutic target for glioma immunotherapy.

Keywords: PDIA5; gliomas; immune infiltration; immunotherapy; scRNA-seq.


Conflict of interest statement

The authors declare that the research was conducted in the absence of any commercial or financial relationships that could be construed as a potential conflict of interest.

Figures

Figure 1
Figure 1
Clinical and molecular characteristics of PDIA5 in gliomas. (A) The flow diagram of this research. (B) Expression of PDIA5 in multiple human cancers from the The Cancer Genome Atlas (TCGA) dataset. GBM, glioblastoma multiforme; LGG, brain lower grade glioma; OV, ovarian serous cystadenocarcinoma; ESCA, esophageal carcinoma; PAAD, pancreatic adenocarcinoma; COAD, colon adenocarcinoma; KIRC, kidney renal clear cell carcinoma; READ, rectum adenocarcinoma; HNSC, head and neck squamous cell carcinoma; LUSC, lung squamous cell carcinoma; BRCA, breast invasive carcinoma; TGCT, testicular germ cell tumors; DLBC, lymphoid neoplasm diffuse large B-cell lymphoma; SKCM, skin cutaneous melanoma; BLCA, bladder urothelial carcinoma; THYM, thymoma; UCEC, uterine corpus endometrial carcinoma; UCS, uterine carcinosarcoma; PRAD, prostate adenocarcinoma; CHOL, cholangiocarcinoma; LIHC, liver hepatocellular carcinoma; STAD, stomach adenocarcinoma; CESC, cervical squamous cell carcinoma and endocervical adenocarcinoma; SARC, sarcoma; LUAD, lung adenocarcinoma; PCPG, pheochromocytoma and paraganglioma; KIRP, kidney renal papillary cell carcinoma; LAML, acute myeloid leukemia; KICH, kidney chromophobe; THCA, thyroid carcinoma; ACC, adrenocortical carcinoma. (C) The expression levels of PDIA5 increased with WHO grade in the Chinese Glioma Genome Atlas (CGGA) and TCGA datasets. (D) PDIA5 expression was upregulated in isocitrate dehydrogenase (IDH) wild-type compared with IDH mutant gliomas in CGGA and TCGA datasets. (E) PDIA5 expression levels in different radiographical regions of glioblastoma multiforme (GBM) and normal brain from the Gill dataset. (F) PDIA5 expression was detected in different locations in the IVY GBM dataset. CT, cellular tumor; HBV, hyperplastic blood vessels; IT, infiltrating tumor; LE, leading edge; MVP, microvascular proliferation; PAN, pseudopalisading cells around necrosis; PNZ, perinecrotic zone. (G) Representative images of IHC staining for PDIA5 in normal brain tissue and different WHO grades of glioma [scale bar=625µm (upper), 50µm (lower)]. (H) Quantification (H-score) of PDIA5 IHC staining in normal brain (n=3) and different pathological grades of gliomas (n=31). (I) Kaplan-Meier survival curves comparing the high and low expression of PDIA5 in glioma patients from Xiangya Hospital. *P <.05, **P <.01, ***P <.001, ns. p>.05.
Figure 2
Figure 2
Kaplan-Meier survival curves comparing high and low expression of PDIA5 in different cancers. OS of bladder urothelial carcinoma (BLCA) (A), cervical and endocervical cancers (CESC) (B), kidney renal papillary cell carcinoma (KIRP) (C), lung squamous cell carcinoma (LUSC) (D), mesothelioma (MESO) (E), and thyroid carcinoma (THCA) (F). Correlation of PDIA5 expression with OS (G) and DSS (H) in 33 types of cancer. OS, overall survival. DSS; disease specific survival. (I) Kaplan-Meier analysis of OS based on high vs. low expression of PDIA5 in pan-glioma, LGG, and GBM patients in the TCGA dataset. Red curve represents patients with high expression of PDIA5, and blue curve represents low PDIA5.
Figure 3
Figure 3
PDIA5 is associated with immunity pathways and inflammatory activities in GBM. PDIA5 expression was positively correlated with immune score, stromal score, and ESTIMATE score in pan-gliomas (A) and GBM patients (B). Correlation of PDIA5 and immunity pathways in CGGA (C) and TCGA (D) datasets. The relationship between PDIA5 and inflammatory activities in the CGGA (E) and TCGA (F) datasets. Expression values are z-transformed and are highlighted in red for high expression and blue for low expression as indicated in the scale bar.
Figure 4
Figure 4
Correlation between PDIA5 expression and immune cell infiltration in gliomas. Correlation of PDIA5 and 28-immune cell lineage genes in glioblastoma multiforme (GBM) from the Chinese Glioma Genome Atlas (CGGA) (A) and The Cancer Genome Atlas (TCGA) (B) datasets. Expression values are z-transformed and are highlighted in red for high expression and blue for low expression as indicated in the scale bar. (C) Representative images of immunohistochemical (IHC) staining for CD68 in different WHO grades of gliomas [scale bar=625µm (upper), 50µm (lower)]. (D) Quantification (H-score) of CD68 IHC staining in normal brain (n=3) and different pathological grades of gliomas (n=31). (E) Correlations analysis between PDIA5 and CD68 of IHC staining. **P <.01, ***P <.001.
Figure 5
Figure 5
scRNA-seq results for PDIA5 in gliomas. (A) The cells were categorized into eight clusters (left). Scatter plots of PDIA5 expression distribution of different cell clusters (right). Gray areas represent the whole cell clusters. The red dots represent cell with PDIA5 expression. (B) Violin plot of PDIA5 expression distribution of different cell clusters. (C) The single-cell trajectory of neoplastic cells contains four main branches. Cells are colored based on state (left), pseudotime (middle), and PDIA5 (right). (D) The single-cell trajectory of macrophages contained four main branches. Cells are colored based on state (left), pseudotime (middle), and PDIA5 (right).
Figure 6
Figure 6
PDIA5 high expression tumor cells exhausted immune cells (HMC3) activation. (A) PDIA5 relative U251 lines were co-cultured with HMC3 GFP in organoids medium and monitored and quantified at 3/10 days-post droplets implantation (exposure time: 1.95 ms). (B) GFP ROI per dimension measurements valued the viabilities of HMC3 in each co-culturing (exposure time: 0.888 ms). (C) HE stained co-cultured organoids demonstrated cell types. Note: figure panel pairs in (A–C) represent images captured at differing magnifications; magnification scale bars: panel (A, B) 4×amplification: 750 µm; panel (C) 10×amplification: 200 µm. ***P <.001.
Figure 7
Figure 7
Immunotherapy is more practical for high PDIA5 patients. Correlation between PDIA5 and immune checkpoint members in pan-gliomas, low grade glioma (LGG), and glioblastoma multiforme (GBM) from the Chinese Glioma Genome Atlas (CGGA) (A) and The Cancer Genome Atlas (TCGA) (B) datasets. (C) Submap analysis of the response of anti-CTLA-4 and anti-PD-1 therapy in the CGGA and TCGA datasets. low_b, or high_b was the value obtained from low_p, or high_p multiplied by 8 (2 *4) based on Bonferroni correction, respectively. (D) The relationship between PDIA5 and T cell-inflamed gene expression profile (GEP) level in the CGGA and TCGA datasets. (E) The relationship between PDIA5 and cytolytic activity (CYT) in the CGGA and TCGA datasets. ***P <.001.
Figure 8
Figure 8
The role of PDIA5 in predicting the therapeutic value of checkpoint blockade immunotherapy. (A) Kaplan–Meier survival plot showed a significant survival benefit in the high PDIA5 group of IMvigor210 cohort. (B) Distribution of PDIA5 in the distinct anti-PD-L1 clinical response group. *p <.05, ns, p >.05. (C) The proportions of clinical response to anti-PD-L1 immunotherapy in the high and low PDIA5 groups. (D) The proportions of clinical binary response to anti-PD-L1 immunotherapy in the high and low PDIA5 groups. (E) The proportions of the high and low PDIA5 groups in the anti-PD-L1 immunotherapy clinical response. (F) Differences in CD274 (PD-L1) expression in the high and low PDIA5 groups in the IMvigor210 cohort. (G) Kaplan–Meier survival plot showed a significant survival benefit in the high PDIA5 group of GSE78220 cohort. (H) The proportions of clinical response to anti-PD-1 immunotherapy in the high and low PDIA5 groups. (I) The proportions of the high and low PDIA5 groups in the anti-PD-1 immunotherapy clinical response. **p < .01.

Similar articles

Cited by

References

    1. Weller M, Wick W, Aldape K, Brada M, Berger M, Pfister SM, et al. . Glioma. Nat Rev Dis Primers (2015) 1:15017. 10.1038/nrdp.2015.17 - DOI - PubMed
    1. Zhang H, Wang R, Yu Y, Liu J, Luo T, Fan F. Glioblastoma Treatment Modalities besides Surgery. J Cancer (2019) 10(20):4793–806. 10.7150/jca.32475 - DOI - PMC - PubMed
    1. Jiang T, Mao Y, Ma W, Mao Q, You Y, Yang X, et al. . CGCG clinical practice guidelines for the management of adult diffuse gliomas. Cancer Lett (2016) 375(2):263–73. 10.1016/j.canlet.2016.01.024 - DOI - PubMed
    1. Zeng F, Wang K, Liu X, Zhao Z. Comprehensive profiling identifies a novel signature with robust predictive value and reveals the potential drug resistance mechanism in glioma. Cell Commun Signal (2020) 18(1):2. 10.1186/s12964-019-0492-6 - DOI - PMC - PubMed
    1. Audia A, Conroy S, Glass R, Bhat KPL. The Impact of the Tumor Microenvironment on the Properties of Glioma Stem-Like Cells. Front Oncol (2017) 7:143. 10.3389/fonc.2017.00143 - DOI - PMC - PubMed

Publication types

MeSH terms

LinkOut - more resources