. 2021 Feb 16:12:624656.
doi: 10.3389/fpls.2021.624656. eCollection 2021.

Identification of Metal Stresses in Arabidopsis thaliana Using Hyperspectral Reflectance Imaging

Affiliations

Identification of Metal Stresses in Arabidopsis thaliana Using Hyperspectral Reflectance Imaging

Anne M Ruffing et al. Front Plant Sci. .

Abstract

Industrial accidents, such as the Fukushima and Chernobyl disasters, release harmful chemicals into the environment, covering large geographical areas. Natural flora may serve as biological sensors for detecting metal contamination, such as cesium. Spectral detection of plant stresses typically employs a few select wavelengths and often cannot distinguish between different stress phenotypes. In this study, we apply hyperspectral reflectance imaging in the visible and near-infrared along with multivariate curve resolution (MCR) analysis to identify unique spectral signatures of three stresses in Arabidopsis thaliana: salt, copper, and cesium. While all stress conditions result in common stress physiology, hyperspectral reflectance imaging and MCR analysis produced unique spectral signatures that enabled classification of each stress. As the level of potassium was previously shown to affect cesium stress in plants, the response of A. thaliana to cesium stress under variable levels of potassium was also investigated. Increased levels of potassium reduced the spectral response of A. thaliana to cesium and prevented changes to chloroplast cellular organization. While metal stress mechanisms may vary under different environmental conditions, this study demonstrates that hyperspectral reflectance imaging with MCR analysis can distinguish metal stress phenotypes, providing the potential to detect metal contamination across large geographical areas.

Keywords: Arabidopsis; cesium stress; copper stress; hyperspectral imaging; metal stress; multivariate curve resolution; plant hyperspectral imaging; salt stress.


Conflict of interest statement

The authors declare that the research was conducted in the absence of any commercial or financial relationships that could be construed as a potential conflict of interest.

Figures
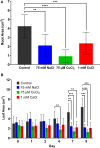
FIGURE 1
FIGURE 1
Changes in A. thaliana biomass with metal stress treatments. (A) root area after 9 days of metal stress treatment and (B) leaf area over time. All data are averages of at least five biological replicates with error bars indicating the standard deviation. Statistical significance determined by two-tailed t-test with equal variance comparing the treatment to the control; ∗∗p < 0.01, ∗∗∗p < 0.001, ∗∗∗∗p < 0.0001.
FIGURE 2
FIGURE 2
Confocal fluorescence microscopy images of A. thaliana leaves 4 days after stress exposure. (A) Control, (B) 75 mM NaCl, (C) 75 μM CuCl2, and (D) 1 mM CsCl conditions. Scale bar = 20 μm.
FIGURE 3
FIGURE 3
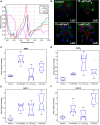
Chlorophyll spectral components of A. thaliana under different stress conditions from MCR analysis of hyperspectral reflectance data. (A) chlorophyll component spectra, (B) chl-1 (green) and chl-2 (blue) spectra in plant images under control and stress conditions, and (C,D) box and whisker plot of the mean signal intensity for the chl-1 (C) and chl-2 (D) components under control and stress conditions after 9 days of treatment. Mean signal intensity of the chlorophyll stress components is the average intensity of all plant pixels in an image for at least five biological replicates. For each box plot, the top and bottom of the box corresponds to the 25th and 75th percentile of the data, respectively, while the red line in the middle of the notch corresponds to the sample median across the replicates. The whiskers above and below each box show the extent of the data, aside from any outliers (marked with red asterisks). Observations are defined as outliers if they are more than 1.5 times the interquartile range away from the top or bottom of the box. Results of the Games-Howell test for statistical significance are shown in Table 1.
FIGURE 4
FIGURE 4
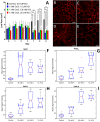
Stress spectral components of A. thaliana under different stress conditions from MCR analysis of hyperspectral reflectance data. (A) stress component spectra, (B) CuCl2 (green), NaCl (blue), and CsCl-2 (red) stress spectra in plant images under control and stress conditions, and (C–F) box and whisker plot of the mean signal intensity for the stress spectral components of NaCl (C), CuCl2 (D), CsCl-1 (E), and CsCl-2 (F) under control and stress conditions after 9 days of treatment. Mean signal intensity of each stress component is the average intensity of all plant pixels in an image for at least five biological replicates. For each box plot, the top and bottom of the box corresponds to the 25th and 75th percentile of the data, respectively, while the red line in the middle of the notch corresponds to the sample median across the replicates. The whiskers above and below each box show the extent of the data, aside from any outliers (marked with red asterisks). Observations are defined as outliers if they are more than 1.5 times the interquartile range away from the top or bottom of the box. Results of the Games-Howell test for statistical significance are shown in Table 1.
FIGURE 5
FIGURE 5
Physiological and spectral changes in A. thaliana exposed to 1 mM CsCl stress with varying levels of KCl. (A) leaf area; (B–E) confocal fluorescence microscopy images of A. thaliana leaves 9 days after exposure for control (B), 1 mM CsCl with 5.6 mM KCl (C), 1 mM CsCl with 10 μM KCl (D), and 1 mM CsCl with 25 mM KCl (E); and (F–I) mean signal intensity of NaCl (F), CuCl2 (G), CsCl-1 (H) and CsCl-2 (I) stress components 9 days after treatment. Leaf area is the average of at least five biological replicates with error bars indicating the standard deviation. Statistical significance for leaf area was determined by two-tailed t-test with equal variance comparing the treatment to the control; ∗∗p < 0.01, ∗∗∗p < 0.001. Scale bar for microscopy images is 20 μm. Mean signal intensities of the stress components are the average intensity of all plant pixels in an image for at least five biological replicates. For each box plot, the top and bottom of the box corresponds to the 25th and 75th percentile of the data, respectively, while the red line in the middle of the notch corresponds to the sample median across the replicates. The whiskers above and below each box show the extent of the data, aside from any outliers (marked with red asterisks). Observations are defined as outliers if they are more than 1.5 times the interquartile range away from the top or bottom of the box. Results of the Games-Howell test for statistical significance are shown in Table 1.

References

    1. Asaari M. S. M., Mishra P., Mertens S., Dhondt S., Inzé D., Wuyts N., et al. (2018). Close-range hyperspectral image analysis for the early detection of stress responses in individual plants in a high-throughput phenotyping platform. ISPRS J. Photogr. Remote Sens. 138 121–138. 10.1016/j.isprsjprs.2018.02.003 - DOI
    1. Bannari A., Morin D., Bonn F., Huete A. (1995). A review of vegetation indices. Remote Sens. Rev. 13 95–120.
    1. Bertrand M., Schoefs B. (1999). “Photosynthetic pigment metabolism in plants during stress,” in Handbook of Plant and Crop Stress, ed. Pessarakli M. (New York, NY: Marcel Dekker, Inc.), 527–544. 10.1201/9780824746728.ch23 - DOI
    1. Blackburn G. A. (2006). Hyperspectral remote sensing of plant pigments. J. Exp. Bot. 58 855–867. 10.1093/jxb/erl123 - DOI - PubMed
    1. Bohnenkamp D., Kuska M., Mahlein A. K., Behmann J. (2019). Hyperspectral signal decomposition and symptom detection of wheat rust disease at the leaf scale using pure fungal spore spectra as reference. Plant Pathol. 68 1188–1195. 10.1111/ppa.13020 - DOI